
ABSTRACT
To effectively manage hydrological drought, there is an urgent need to better understand and evaluate its human drivers. Using the “downstreamness” concept, we assess the role of a reservoir network in the emergence and evolution of droughts in a river basin in Brazil. In our case study, the downstreamness concept shows the effect of a network of reservoirs on the spatial distribution of stored surface water volumes over time. We demonstrate that, as a consequence of meteorological drought and recovery, the distribution of stored volumes became spatially skewed towards upstream locations, which affected the duration and magnitude of hydrological drought both upstream (where drought was alleviated) and downstream (where drought was aggravated). The downstreamness concept thus appears to be a useful entry point for spatiotemporally explicit assessments of hydrological drought and for determining the likelihood of progression from meteorological drought to a human-modified hydrological drought in a basin.
Editor A. Castellarin; Associate editor Q. Zhang
1 Introduction
Drought affects more people than any other hazard today (Hagman et al. Citation1984, World Meteorological Organization [WMO] Citation2012). Droughts, generally defined as periods of low precipitation, lead to shortages of water for human and natural purposes. Droughts are complex events and involve multiple parameters (Mishra and Singh Citation2010). Determining the magnitude and duration of a drought is therefore less than straightforward. Oftentimes when drought is referred to, it is used to indicate water shortage caused by natural influences only (Van Loon and Van Lanen Citation2013). However, a drought can be aggravated or alleviated by anthropogenic influences. Study of these and other influences has helped us to realize that there are different, though related, types of drought, such as meteorological, soil moisture, hydrological, socioeconomic and ecological drought (Wilhite Citation2000, Tallaksen and Lanen Citation2004, Mishra and Singh Citation2010).
Hydrological drought, defined as a scarcity of groundwater and water in lakes and rivers, usually develops as an extension of meteorological drought, though sometimes there is a time lag in between (Peters et al. Citation2003, Van Loon and Van Lanen Citation2012). The frequency and severity of hydrological drought is usually defined at the catchment level, and observed in low streamflow and low reservoir volumes. Water storage can be either natural (in groundwater and lakes) or artificial (in reservoirs). Infrastructures such as large public dams (WCD Citation2000) and multitudes of smaller dams retain water, thus serving as an aid to overcome periods of water shortage (López-Moreno et al. Citation2009). Meteorological anomalies interact with land surface processes, developments in water storage and human activities in various and complex ways (Van Loon et al. Citation2016b). Implementation and operation of reservoirs, for instance, smoothens catchment hydrographs, producing lower peak flows and higher low flows. To some extent, river regulation by reservoirs can compensate for increased water abstraction (Wanders and Wada Citation2015, Rangecroft et al. Citation2016). But reservoir management may intensify hydrological drought as well (Van Loon and Van Lanen Citation2013, Citation2015, He et al. Citation2017).
Despite the impact of human activities on the emergence and evolution of drought, there are few tools for studying how human activities affect drought (Mishra and Singh Citation2010, Van Loon et al. Citation2016a). The “Panta Rhei” initiative of the International Association of Hydrological Sciences (IAHS) introduced the field of socio-hydrology (Montanari et al. Citation2013). The terms human-modified and human-induced drought have been added to the literature to distinguish droughts due to anthropogenic causes from those caused by natural conditions (Van Loon et al. Citation2016a, Citation2016b). Human-modified drought refers to a drought that is either aggravated or alleviated by human action, while a human-induced drought is caused by human processes, occurring when no drought is indicated by natural conditions (Van Loon et al. Citation2016a).
This paper builds on these advances, proposing a new approach for diagnosing drought and understanding the progression from meteorological to hydrological drought, including human influences. The approach uses the “downstreamness” concept (Van Oel et al. Citation2009, Citation2011) and incorporates the role of human pressures by looking at the effect of a network of surface water reservoirs. We demonstrate application of the downstreamness concept by studying the emergence and evolution of droughts over a 37-year period in a large dryland basin in Brazil.
2 Methods
2.1 Drought detection using standardized indices
For drought detection, we used the standardized precipitation index (SPI) and the standardized streamflow index (SSI). A tool for obtaining these is available from the website of the National Drought Mitigation Center (NDMC Citation2017). For both the SPI and the SSI, we adopted the definition proposed by McKee et al. (Citation1993). Thus, a drought is said to occur when the SPI (or SSI) is continuously negative and the SPI (or SSI) reaches a value of −1.0 or less. The drought begins when the SPI first falls below zero and ends upon registration of a positive value subsequent to a value of −1.0 or less (McKee et al. Citation1993). Also following McKee et al. (Citation1993), we classify droughts into four categories: mild (–1.0 < SPI < 0.0), moderate (–1.5 < SPI < −1.0), severe (–2.0 < SPI < −1.5) and extreme (SPI < −2.0). Drought magnitude (DM) is defined as the absolute summation of SPI (or SSI) for all months of the drought (McKee et al. Citation1993). As we are interested in hydrological drought, we considered SPI and SSI values for 12-month periods, in line with the guidelines of the World Meteorological Organization (WMO Citation2012). According to the WMO (Citation2012), streamflow responds to precipitation anomalies in the order of 6 to 24 months. For natural systems, we expect the 12-month SPI and SSI values to strongly correlate, particularly in areas with relatively strong seasonality and extensive storage capacity (Barker et al. Citation2016). Moreover, two recent studies also confirm that a 12-month time scale is suitable to relate SPI to SSI, in a semi-arid environment (Marcos-Garcia et al. Citation2017, Rad et al. Citation2017).
2.2 Drought diagnosis using downstreamness
The proposed approach for drought diagnosis comprises two steps. These are briefly explained below.
Step 1: Comparing hydrological drought to meteorological drought
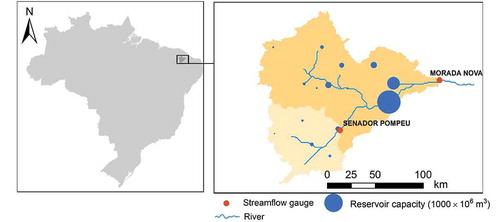
We determined how droughts evolved over time by comparing the 12-month SPI and SSI values at the end of the wet season (on 1 July in our case study) for selected drought events. This enabled us to explore occurrences of meteorological drought in relation to hydrological drought in selected periods. Rather than examining the correlation between the SPI and SSI, as in Barker et al. (Citation2016), we looked at how the difference between the two developed over time. We also investigated differences along the stream, by comparing the drought indicators (SPI and SSI) at a downstream gauging station (the Morada Nova station, see ) with indicators from another gauging station located upstream (the Senador Pompeu station, see ). The two differed considerably in catchment size and amount of storage capacity upstream of the gauging station. For both, drought was indicated by both duration (months) and magnitude (as specified above).
Figure 1. Sub-catchment of the Morada Nova gauging station, located in the Jaguaribe basin, Ceará, Brazil. Blue dots represent the 16 reservoirs monitored by water agencies. The sub-catchment of the Senador Pompeu gauging station is located upstream of the Morada Nova station. See for details on the two catchments. The size of the blue dots represents reservoir storage capacity.
Step 2: Assessing the influence of a reservoir network on hydrological drought
A reservoir network is a system of reservoirs connected by streams or canals that converges towards the outlet of the catchment. To assess the influence of the reservoir network on hydrological drought, we examined the spatial distribution of surface water storage reservoirs in a reservoir network over time. For this, we calculated changes in the “downstreamness” (Van Oel et al. Citation2011) of stored volumes (and storage capacities). Every location, x, in a catchment was characterized by the size of its upstream area. To indicate a location’s relative positioning in the context of the entire catchment, we divided the upstream area, Aup,x (m2), by the total catchment area of the basin, Atot (m2). This fraction is what we refer to as “downstreamness” (Van Oel et al. Citation2011), Dx (%):
The downstreamness of a function on the basin is defined as the downstreamness-weighted integral of that function divided by its regular integral. For a function defined at a discrete set of locations in the basin, the downstreamness is similarly defined as the downstreamness-weighted sum of the function divided by the regular sum. Equations (2) and (3), respectively, define the downstreamness of storage capacity (DSC, %) and of stored volume (DSV, %):
where n is the number of locations in the catchment for which Dx, SCx and SVx are determined.
The values of DSC and DSV are defined relative to the downstreamness of the outlet of the catchment, which by definition is 100% (see Equation (1)). Thus, DSC and DSV can range from 0 to 100%. By comparing DSC to DSV we can determine the distribution of stored volumes over the storage facilities (capacity) in the reservoir network. DSC and DSV vary over time: DSC might change due to developments in capacity, while DSV is dependent on changes in relative inflows and outflows.
To evaluate the effect of a reservoir network on streamflow (and therefore hydrological drought) it is helpful to analyse where most water is stored in a catchment. If reservoir filling rates are equal for all reservoirs, DSV equals DSC. However, upstream filling rates may be relatively low (DSV > DSC) or downstream filling rates may be lower on average than upstream filling rates (DSV < DSC). In the latter case, relatively large volumes of water will remain at upstream locations. This means that downstream flow will be lower than it would have been in the absence of upstream reservoirs (or if upstream reservoirs released more water). schematically depicts these three situations.
Figure 2. Schematic depiction of three situations of reservoir filling rates for a river basin with two reservoirs: (a) if the filling rates are equal the downstreamness of the stored volume (DSV) equals the downstreamness of storage capacity (DSC); (b) if the filling rate of the upstream reservoir is greater than that of the downstream reservoir, DSV is less than DSC; and (c) if the filling rate of the upstream reservoir is less than that in the downstream reservoir DSV is greater than DSC.
To determine how the reservoir network has affected hydrological drought, we compared the stored volumes in the main surface water reservoirs to annual streamflow at different locations in the catchment (). Specifically, we compared the stored volumes at the end of the wet season (on 1 July) to the annual streamflow for that same year (1 January to 31 December) over the course of multi-year droughts.
2.3 Case study
Northeastern Brazil is a semi-arid region with a history of recurrent water stress (Guerra and Guerra Citation1980, Gaiser et al. Citation2003). This is due to both rainfall variability and human activities. Annual precipitation, though concentrated from January to June, is highly uneven, both temporally and spatially (De Nys et al. Citation2016). In the case study area, reservoirs of various sizes are so numerous (thousands) as to have a significant effect on basin hydrology (Van Oel et al. Citation2008, De Araújo and Piedra Citation2009). The reservoirs included in the analysis serve to overcome periods of water shortage due to both intra-annual (seasonal) and inter-annual variations and drought. The larger reservoirs, which are located relatively towards the downstream parts of the catchment area, are used to overcome periods of inter-annual drought. The cumulative storage capacity of these reservoirs is considerable, with the capacity of the large reservoirs alone more than three times greater than the average annual runoff. This has compromised the hydrological functioning of the basin (Malveira et al. Citation2011, Mamede et al. Citation2012). Water agencies monitor stored volumes in the largest reservoirs, producing data on changes over time. For this study, we used monitoring data for the catchment area of the gauging station at Morada Nova (a sub-catchment of the Jaguaribe basin in Ceará) ().
We identified meteorological drought using precipitation time series data at the level of the entire catchment (upstream of Morada Nova). Using Thiessen polygons, we interpolated monthly SPI values from multiple rain gauging stations for the 37 years from January 1979 to June 2016 (FUNCEME Citation2016). Hydrological drought in the catchment was identified using 12-month SSI values for the Morada Nova gauging station produced by the same procedure as described above for the SPI (NDMC Citation2017). The same time periods and probability distributions (gamma) were used for SSI and SPI. With regard to the SSI values, the gamma probability distribution indicated relatively good performance for low runoff values (Shukla and Wood Citation2008).
3 Results
3.1 Detecting meteorological and hydrological drought
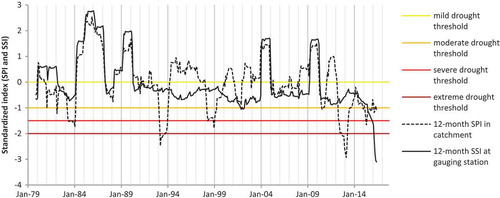
shows the development of meteorological drought (defined by a running 12-month SPI for the catchment) and hydrological drought (defined by running 12-month SSI at the Morada Nova gauging station) from December 1979 to June 2016. The figure shows substantial deviation between the SPI and SSI values. This is due particularly to the presence and operation of the reservoir network in the catchment. In some periods of meteorological drought, hydrological drought was alleviated, that is, it was delayed or did not materialize. However, periods of meteorological drought were sometimes followed by extended periods of hydrological drought. Furthermore, recovery from hydrological drought seemed to take much longer than recovery from meteorological drought. From 1992 to 2004, two periods of severe to extreme meteorological drought – the extreme drought from May 1992 to April 1994 and the severe drought from February 1998 to January 2000 – alternated with periods with fair amounts of rainfall. However, throughout this entire period, a mild to moderate hydrological drought persisted without any relief. A deviating pattern is also observed for the most recent drought period. Here, the hydrological drought is “extreme”, exceeding even the intensity of the preceding (or rather “ongoing”) meteorological drought. For this area, which is so strongly affected by human influences, it is not surprising that the SPI and SSI do not correlate, as also reported by Barker et al. (Citation2016) and Shukla and Wood (Citation2008).
Figure 3. Temporal evolution of drought for the catchment upstream of the Morada Nova gauging station. SPI is based on a spatially averaged time series of monthly rainfall values for the entire catchment area. SSI values are based on a time series of streamflow observations for the Morada Nova gauging station.
3.2 Meteorological and hydrological drought compared (Step 1)
One way of representing human-modified or human-induced drought is to compare SPI and SSI values directly for drought events over a period of time. We did this for the periods 1990–1996, 1997–2003 and 2011–2016 (). For the first two periods, years with low SPI values and low SSI values were followed by years with higher SPI and yet even lower SSI values.
Figure 4. Drought development in the Morada Nova catchment for three multi-year droughts: (a) 1992–1996, (b) 1998–2003 and (c) 2012–2016. Periods with low values for both SPI and SSI are followed by periods with higher SPI and low SSI. SPI values refer to the 12-month SPI and SSI values refer to the 12-month SSI, both for the month of June (end of wet season).
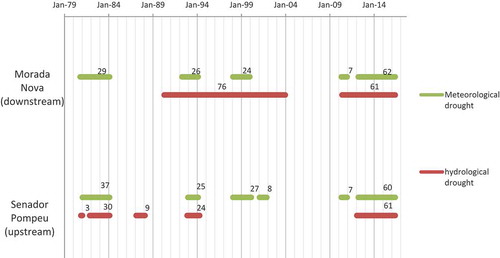
and show that, for the catchment as a whole, hydrological droughts lasted longer than meteorological droughts during the study period. Moreover, the magnitudes of individual droughts were larger for the catchment as a whole. At the upstream gauging station, durations and magnitudes of hydrological droughts (12-month SSI values) were very similar to those of meteorological droughts (12-month SPI values, see ). On one occasion, a hydrological drought started before a meteorological drought (Morada Nova, 1990). This could be due to human influences in anticipation of the upcoming dry period. Also, a hydrological drought was identified upstream without a clear preceding meteorological drought (Senador Pompeu, 1987–1988), suggesting a human-induced drought.
Table 1. Drought indicators for gauging stations: SPI and SSI. Drought magnitude (DM) is the summation of SPI (or SSI) for all months of the drought.
Figure 5. Occurrence of meteorological and hydrological drought in the catchment of the Morada Nova gauging station for the 1979–2016 period.
3.3 Effect of the reservoir network on hydrological drought (Step 2)
We analysed changes in recorded reservoir volumes at the 16 monitored reservoirs (for their locations, see ). For the catchment of the Morada Nova gauging station, meteorological drought (e.g. in 1998–1999) led to a drop in reservoir volumes (). Then, when it started raining again (moderately, in 2000 and 2001), reservoir volumes stabilized at a low level. However, this situation coincided with a drop in the DSV (labelled 2 in ). This means that most of the water stored in the basin was stored in reservoirs located at relatively upstream locations (see ). In fact, the large reservoir located farthest downstream almost ran empty (1–2% of capacity filled). The effect of this imbalance was a human-modified drought (or extended hydrological drought) that continued until 2003. During this period it was not possible to generate the same level of streamflow as during the meteorological drought (1998–1999) because of the relatively low volumes in the reservoir farthest downstream. This sequence of events is reflected in the hysteresis shown in ). Ultimately, a flood in early 2004 () restored the balance. Between 2004 and 2014, DSV and DSC were at about the same level (55–65%, ), because of the rainy years 2008, 2009 and 2011 (). However, from 2014 onwards a drop in DSV was again observed (labelled 3 in ). This drop was even more articulated than the preceding one. It is very possible that an extended period of hydrological drought will follow, unless a significant flood occurs, like the one in 2004.
Figure 6. Downstreamness of the surface water storage capacity (DSC, solid grey line) and stored volume (DSV, solid black line) in the catchment of the Morada Nova gauging station as it developed over the 1986–2016 period. The slight decrease of the DSC and the increase in reservoir capacity are explained by an increase in reservoir capacity in areas located relatively upstream. Periods of interest are labelled 1, 2 and 3. During periods 1 and 2, meteorological droughts (low SPI and low SSI) were followed by a period of merely hydrological drought (low SSI), which coincided with drops in DSV. It is expected that the same may occur in the recent period of drought (period 3; low SPI, low SSI, low DSV).
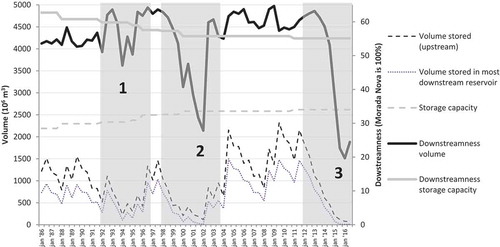
Figure 7. Two years after the meteorological drought had ended reservoir volume levels reached a low (1 January 2002). The level is particularly low in the largest reservoir located farthest downstream. This stored water volume distribution caused the human-modified hydrological drought at the outlet of the catchment to extend well beyond the meteorological drought and to last until the flood of 2004. During the same period, no hydrological drought occurred at the gauging station of Senador Pompeu, though the magnitude of the meteorological drought was worse there (see ).
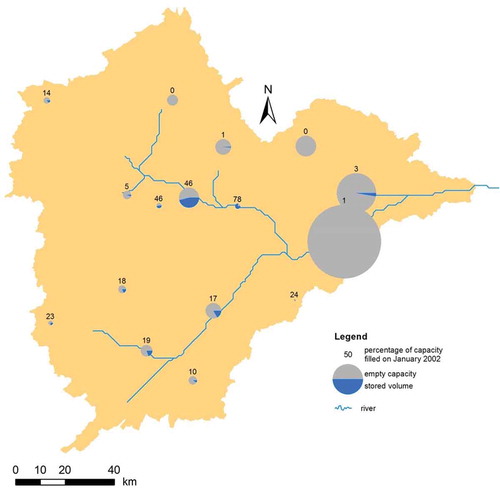
Figure 8. Drought development in the Morada Nova catchment for three multi-year droughts (a) 1992–1996, (b) 1998–2003 and (c) 2012–2016. Discharges (1 January–31 December) at the Morada Nova station and the stored volumes at 1 July in the upstream catchment. Upstream storage capacity during the study period increased by 14% from 133 mm (in 1990) to 152 mm (in 2016).
For three periods (1992–1996, 1998–2003 and 2012–2016), we compared the annual discharges (1 January to 31 December) at the Morada Nova gauging station to upstream stored volumes at the end of the rainy season (on 1 July that same year) (). When the total stored volume fell by a certain degree (~50 mm), reductions in both discharge and stored volumes were observed during meteorological drought, while increases in stored volumes coincided with increased discharge. However, hysteresis was evident in the evolution of discharge following periods of meteorological drought. Even though upstream stored volumes “recovered” after meteorological drought, discharge increases did not keep pace. The periods 1992–1996 and 1998–2003 show such hysteresis. For the drought period extending to the end of our data series (2016) a similar pattern may be expected, unless a flood event takes place. Floods are often reported as a sudden termination of drought (Parry et al. Citation2016).
4 Discussion
The SPI is a widely used indicator for meteorological drought (SPI; McKee et al. Citation1993). It is much harder to find tools for determining human influences on the prolongation of hydrological drought. A reservoir network, for example, could impact the distribution of surface water throughout a catchment. One way to explore anthropogenic drought, or human-modified or human-induced drought (Van Loon et al. Citation2016b), is to compare SPI and SSI values over time. Depending on the physiological characteristics of an area, such as natural and artificial water storage capacity and seasonal weather variation, SPI and SSI are likely to be strongly correlated for particular accumulation periods (Barker et al. Citation2016). To determine a feasible accumulation period for both SPI and SSI, streamflow data can be “naturalized”, that is, relevant human influences factored out (e.g. Van Loon and Van Lanen Citation2013). The current study took a different approach. Our study did not directly quantify human influences based on the correlation between SPI and SSI. Instead, we compared temporal differences between SPI and SSI values and linked these to changes in stored surface water volumes. This produced relevant indicators without requiring naturalized flow. In our case study, low volumes of stored water in combination with low DSV () yielded SSI values that were considerably lower than SPI values (1994–1996, 2000, 2002–2003), based on accumulation periods of 12 months (). This indicates that, after a meteorological drought ends, the human-modified hydrological drought can actually worsen, due to storage of surface water in upstream reservoirs.
In the case study area, the analysis period (1979–2016) was marked by growing population and increasing water demand. Concurrently, substantial investments were made in reservoir capacity, which increased by 19% from 1986 to 2016 (). Though such changes likely affected streamflow, our method of determining SSI did not consider these developments. Using the observed streamflow data may have produced relatively higher SSI values for the earlier years and lower values for the later years. Moreover, hydrological drought in the earlier years may be underexposed, due to the severity of the later hydrological droughts (the SSI shows deviations from normal within the dataset). For instance, a hydrological drought at Morada Nova may have been identified in the early 1980s if the last two decades (i.e. 1996–2016) had not been included (). Non-stationarity, which is a common characteristic of human-affected systems, complicates comparisons between SSI values for different (nested) catchments and between SSI and SPI values (the latter are not affected, unless climate change occurred).
Whereas drought indicators, such as SPI, represent anomalies in fluxes, the related concept of water scarcity indicates an imbalance between water supply (or availability) and water demand. Water scarcity can be expressed in levels of water stress, for instance, considering the quantity of water available per capita (Falkenmark Citation1989) or actual withdrawals (Raskin et al. Citation1996). A related concept is river basin closure (Molle et al. Citation2010). River basin closure is defined as an anthropogenic process occurring when the development of infrastructure with a potential demand for water outstrips basin resources and ecosystem resilience (Molle et al. Citation2010). River basin closure has both a spatial and a temporal component, and its effects are exacerbated by drought (Van Oel et al. Citation2011). Although we did not analyse water demand directly, the present study underlines the potential for strong variation in the balance between water availability and demand in a river basin, across spatial and temporal scales. Implications of overbuilding go beyond construction and operation of large-scale infrastructure, especially for water regulation. Yet this study considered only large-scale reservoirs, which limits our view. In reality, spatial variation in water storage capacity (DSV) could be much more articulated (skewed to upstream), since individual farmers build and manage huge numbers of small reservoirs for their irrigation needs, particularly during droughts (Mamede et al. Citation2012). The impacts of these structures on basin hydrology become even more pronounced during droughts (Krol et al. Citation2011). In this regard, the downstreamness concept could provide a tool for the comparison of centralized storage capacity (conventional large reservoirs and large inter-basin water transfers) and decentralized, distributed storage systems (Van der Zaag and Gupta Citation2008).
Our findings suggest that a long-term period of human-induced hydrological drought may persist in the study area. This may be overcome only by such extreme precipitation as is associated with flooding, which has been identified as a means of drought termination (Parry et al. Citation2016). Next to physical factors (groundwater deficits, dry soils), perverse incentives may play a role in the prolongation of drought. During periods of scarcity at the basin level, water use may increase (Van Oel et al. Citation2008) and investments may be made in additional storage capacity. Moreover, investments in modern irrigation technologies that prove unsustainable at the basin scale might still be profitable on a local scale (Berbel et al. Citation2014). Analogous to the “tragedy of the commons” (Hardin Citation1968), we may think of this as the “tragedy of the catchment”, in which local incentives spur depletion of basin resources downstream or even at the basin level. In such a catchment or basin, water resources become difficult to manage, due to the spatial distribution of human influences (Van Oel et al. Citation2009).
In human-modified systems, large variability can be demonstrated between different areas (sub-catchments), as shown in this paper (). The downstreamness concept depicts how the spatial distribution of stored water volumes evolves. It thus demonstrates how a reservoir network may influence hydrological drought. Such insights could inform policy makers’ deliberations when designing or reviewing drought and water policies. They could also support decision making on the operation of reservoir and irrigation infrastructure. Furthermore, greater understanding of the effect of reservoir networks on streamflow could improve estimates of water availability (over space and time) derived from climate and weather forecasts (e.g. for alerts of expected drought conditions and guidelines on infrastructure management). Findings from our application of the “downstreamness” concept clearly indicate that the present drought in the Morada Nova catchment could extend for many years to come. That is, unless a substantial flood (with an SPI well above average) restores the stored water balance and thus ends the hydrological drought (as in 2004). This information could be taken into account when interpreting medium-term (6–18 month) seasonal forecasts. To do so adequately, additional assessment tools are needed, building on the approach introduced in this paper.
To indicate the impact of a reservoir network on the spatial distribution of water resources (and hydrological drought) the storage network impact factor (SNIF) is proposed. The SNIF, obtained by dividing DSC by DSV, indicates the skewedness of stored water volumes towards upstream locations (DSV) relative to the locations of storage capacity (DSC). Peaks 1, 2 and 3 in would then produce SNIFs of 1.28 (60/47), 2.00 (56/28) and 2.75 (55/20), respectively. A SNIF > 1 denotes upstream filling rates higher than downstream filling rates. To develop the SNIF into a useful indicator for forecasting durations or magnitudes of ongoing droughts, further research is needed on relevant class limits. Also, a function depicting the relationship between SPI, SSI, DSV and DSC could be instrumental for exploring (or predicting) future drought evolution. However, based on the limited reach of the data used for the current study, such a generic function cannot yet be established. As a first step, based on the findings of this study, we present conceptual representations of the relationships between SPI, SSI, DSV, DSC, discharge and upstream storage ().
Figure 9. Conceptual representation of the relationship between drought indicators (SPI, SSI), DSV and DSC (left) and the relationship between upstream storage and downstream discharge (right). We found that recovery from drought is associated with a different pathway than the one associated with linear filling of the reservoirs across the basin (SNIF = 1).
5 Conclusions
Our integrated analysis of precipitation, streamflow and the evolution of the spatial distribution of stored surface water produced an advanced understanding of the effect of a reservoir network on hydrological drought. In our a case-study catchment, meteorological drought and recovery led to a spatially skewed distribution of stored volumes towards the upstream parts of the basin. In fact, hysteresis was observed in the relationship between stored volumes upstream of a gauging station and discharge at that gauging station for multi-year hydrological droughts. As a result, streamflow downstream in the basin was affected for time periods extending well beyond the duration of meteorological droughts. Specifically, we observed a continuation of drought in the form of human-modified hydrological drought.
We applied the downstreamness concept for drought diagnosis. The approach yielded a spatiotemporally explicit assessment of drought and traced the progression from meteorological drought to human-modified hydrological drought in the case-study basin. This advanced our understanding of the effects of anthropogenic processes on drought, thus supporting strategic water (and drought) management.
The downstreamness concept alongside our comparison of meteorological drought (SPI) and human-modified hydrological drought (SSI) represents a mixed qualitative and quantitative method and responds to the urgent need for advanced hydrological research to comprehend interactions between humans and water (Montanari et al. Citation2013, McMillan et al. Citation2016). The approach proposed here contributes to advance socio-hydrological models that consider feedbacks between society and the water cycle, including hydroclimatic extremes (Van Loon et al. Citation2016b, Srinivasan et al. Citation2017). In our study, the downstreamness concept produced greater understanding of human influences, that is, the effect of storage in a network of reservoirs, on human-modified drought. The concept could also be applied to water demand, use and (transient) water transfers between catchments.
Acknowledgements
The study is a contribution to the “Panta Rhei” initiative of the International Association of Hydrological Sciences (IAHS), the UNESCO IHP-VII Programme (Euro-FRIEND-Water project) and the EU H2020 ANYWHERE project (Enhancing Emergency Management and Response to Extreme Weather and Climate Events, no. 700099). All data (precipitation, streamflow and reservoir storage) were obtained from the Organization for Meteorology and Water Resources of Ceará, Brazil (FUNCEME Citation2016).
Disclosure statement
No potential conflict of interest was reported by the authors.
References
- Barker, L.J., et al., 2016. From meteorological to hydrological drought using standardised indicators. Hydrology and Earth System Sciences, 20 (6), 2483–2505. doi:10.5194/hess-20-2483-2016
- Berbel, J., et al., 2014. Literature review on rebound effect of water saving measures and analysis of a Spanish case study. Water Resources Management, 29 (3), 663–678. doi:10.1007/s11269-014-0839-0
- De Araújo, J.C. and Piedra, J.I.G., 2009. Comparative hydrology: analysis of a semiarid and a humid tropical watershed. Hydrological Processes, 23 (8), 1169–1178. doi:10.1002/hyp.v23:8
- De Nys, E., Engle, N.L., and Magalhães, A.R., 2016. Drought in Brazil: proactive management and policy. Boca Raton, FL: CRC Press.
- Falkenmark, M., 1989. The massive water scarcity now threatening Africa – why isn’t it being addressed? Ambio, 18 (2), 112–118.
- FUNCEME, 2016. Portal Hidrológico do Ceará [dataset]. Dataset by Fundação Cearense de Meteorologia e Recursos Hídricos (FUNCEME) and Companhia de Gestão dos Recursos Hídricos (COGERH). Available from: http://www.hidro.ce.gov.br/ [Accessed 1 Dec 2016].
- Gaiser, T., et al., eds., 2003. Global change and regional impacts: water availability and vulnerability of ecosystems and society in the semi-arid northeast of Brazil. Berlin, Germany: Springer.
- Guerra, P. and Guerra, T., 1980. Seccas contra as seccas. Mossoro, Brazil: Escola Superior de Agricultura de Mossoró, Collection Mossoroense, No. 29.
- Hagman, G., Beer, H., and Svenska RöDa, K., 1984. Prevention better than cure: report on human and environmental disasters in the Third World. Stockholm: Swedish Red Cross.
- Hardin, G., 1968. The tragedy of the commons. Science, 162, 1243–1248. doi:10.1126/science.162.3859.1243
- He, X., et al., 2017. Intensification of hydrological drought in California by human water management. Geophysical Research Letters. doi:10.1002/2016gl071665
- Krol, M.S., et al., 2011. Sustainability of small reservoirs and large scale water availability under current conditions and climate change. Water Resources Management, 25 (12), 3017–3026. doi:10.1007/s11269-011-9787-0
- López-Moreno, J.I., et al., 2009. Dam effects on droughts magnitude and duration in a transboundary basin: the lower river tagus, pain and Portugal. Water Resources Research, 45 (2). doi:10.1029/2008wr007198
- Malveira, V.T.C., Araújo, J.C.D., and Güntner, A., 2011. Hydrological impact of a high-density reservoir network in semiarid Northeastern Brazil. Journal of Hydrologic Engineering, 17 (1), 109–117. doi:10.1061/(ASCE)HE.1943-5584.0000404
- Mamede, G.L., et al., 2012. Overspill avalanching in a dense reservoir network. Proceedings of the National Academy of Sciences of the United States of America, 109 (19), 7191–7195.
- Marcos-Garcia, P., Lopez-Nicolas, A., and Pulido-Velazquez, M., 2017. Combined use of relative drought indices to analyze climate change impact on meteorological and hydrological droughts in a Mediterranean basin. Journal of Hydrology, 554, 292–305. doi:10.1016/j.jhydrol.2017.09.028
- McKee, T.B., Doesken, N.J., and Kleist, J., 1993. The relationship of drought frequency and duration to time scales. In: 8th Conference on Applied Climatology, 17–22 January 1993, Anaheim, CA. Boston, MA: American Meteorological Society, 179–184.
- McMillan, H., et al., 2016. Panta Rhei 2013–2015: global perspectives on hydrology, society and change. Hydrological Sciences Journal, 1–18. doi:10.1080/02626667.2016.1159308
- Mishra, A.K. and Singh, V.P., 2010. A review of drought concepts. Journal of Hydrology, 391 (1–2), 202–216. doi:10.1016/j.jhydrol.2010.07.012
- Molle, F., Wester, P., and Hirsch, P., 2010. River basin closure: processes, implications and responses. Agricultural Water Management, 97 (4), 569–577. doi:10.1016/j.agwat.2009.01.004
- Montanari, A., et al., 2013. “Panta Rhei-Everything Flows”: change in hydrology and society – The IAHS Scientific Decade 2013–2022. Hydrological Sciences Journal, 58 (6), 1256–1275. doi:10.1080/02626667.2013.809088
- NDMC, 2017. Downloadable SPI program. Nebraska-Lincoln, USA: National Drought Mitigation Center. Available from: http://drought.unl.edu/MonitoringTools/DownloadableSPIProgram.aspx.
- Parry, S., et al., 2016. A systematic assessment of drought termination in the United Kingdom. Hydrology and Earth System Sciences, 20 (10), 4265–4281. doi:10.5194/hess-20-4265-2016
- Peters, E., et al., 2003. Propagation of drought through groundwater – A new approach using linear reservoir theory. Hydrological Processes, 17 (15), 3023–3040. doi:10.1002/hyp.1274
- Rad, A.M., et al., 2017. Integrated meteorological and hydrological drought model: a management tool for proactive water resources planning of semi-arid regions. Advances in Water Resources, 107, 336–353. doi:10.1016/j.advwatres.2017.07.007
- Rangecroft, S., et al., 2016. Multi-method assess ment of reservoir effects on hydrological droughts in an arid region. Earth System Dynamics Discussions, 2016, 1–32. doi:10.5194/esd-2016-57
- Raskin, P.D., Hansen, E., and Margolis, R.M., 1996. Water and sustainability: global patterns and long-range problems. Natural Resources Forum, 20 (1), 1–15. doi:10.1111/narf.1996.20.issue-1
- Shukla, S. and Wood, A.W., 2008. Use of a standardized runoff index for characterizing hydrologic drought. Geophysical Research Letters, 35 (2). doi:10.1029/2007gl032487
- Srinivasan, V., et al., 2017. Prediction in a socio-hydrological world. Hydrological Sciences Journal, 62 (3), 338–345. doi:10.1080/02626667.2016.1253844
- Tallaksen, L. and Lanen, H.A.J.V., 2004. Hydrological drought. Processes and estimation methods for streamflow and groundwater. Amsterdam: Elsevier.
- Van der Zaag, P. and Gupta, J., 2008. Scale issues in the governance of water storage projects. Water Resources Research, 44 (10). doi:10.1029/2007WR006364
- Van Loon, A.F., et al., 2016a. Drought in the Anthropocene. Nature Geoscience, 9 (2), 89–91. doi:10.1038/ngeo2646
- Van Loon, A.F., et al., 2016b. Drought in a human-modified world: reframing drought definitions, understanding, and analysis approaches. Hydrology and Earth System Sciences, 20 (9), 3631–3650. doi:10.5194/hess-20-3631-2016
- Van Loon, A.F. and Van Lanen, H.A.J., 2012. A process-based typology of hydrological drought. Hydrology and Earth System Sciences, 16 (7), 1915–1946. doi:10.5194/hess-16-1915-2012
- Van Loon, A.F. and Van Lanen, H.A.J., 2013. Making the distinction between water scarcity and drought using an observation-modeling framework. Water Resources Research, 49 (3), 1483–1502.
- Van Loon, A.F. and Van Lanen, H.A.J., 2015. Testing the observation-modelling framework to distinguish between hydrological drought and water scarcity in case studies around Europe. European Water, (49), 65–75.
- Van Oel, P.R., et al., 2008. The impact of upstream water abstractions on reservoir yield: the case of the Oros Reservoir in Brazil. Hydrological Sciences Journal–Journal Des Sciences Hydrologiques, 53 (4), 857–867. doi:10.1623/hysj.53.4.857
- Van Oel, P.R., Krol, M.S., and Hoekstra, A.Y., 2009. A river basin as a common-pool resource: a case study for the Jaguaribe basin in the semi-arid Northeast of Brazil. International Journal of River Basin Management, 7 (4), 345–353. doi:10.1080/15715124.2009.9635393
- Van Oel, P.R., Krol, M.S., and Hoekstra, A.Y., 2011. Downstreamness: a concept to analyze basin closure. Journal of Water Resources Planning and Management, 137 (5), 404–411. doi:10.1061/(ASCE)WR.1943-5452.0000127
- Wanders, N. and Wada, Y., 2015. Human and climate impacts on the 21st century hydrological drought. Journal of Hydrology, 526, 208–220. doi:10.1016/j.jhydrol.2014.10.047
- WCD, 2000. Dams and development: a new framework for decision making. London, UK: Earthscan Publications Ltd.
- Wilhite, D.A., 2000. Drought: a global assessment. London: Routledge.
- World Meteorological Organization (WMO), 2012. Standardized precipitation index user guide. Geneva, Switzerland: WMO.