
ABSTRACT
Streamflow modelling results from the GR4H and PDM hydrological models were evaluated in two Australian sub-catchments, using (1) calibration to streamflow and (2) joint-calibration to streamflow and soil moisture. Soil moisture storage in the models was evaluated against soil moisture observations from field measurements. The PDM had the best performance in terms of both streamflow and soil moisture estimations during the calibration period, but was outperformed by GR4H during validation. It was also shown that the soil moisture estimation was improved significantly by joint-calibration for the case where streamflow and soil moisture estimations were poor. In other cases, addition of the soil moisture constraint did not degrade the results. Consequently, it is recommended that GR4H be used, in preference to the PDM, in the foothills of the Murrumbidgee catchment or other Australian catchments with semi-arid to sub-humid climate, and that soil moisture data be used in the calibration process.
Editor R. WoodsAssociate editor N. Verhoest
1 Introduction
Rainfall–runoff models are used extensively in streamflow predictions. The performance of the models is highly dependent on the model structure (Beven Citation1989), parameter values (Moradkhani et al. Citation2005), forcing data, and the initial conditions (Grayson and Blöschl Citation2000). Soil moisture plays a major role in the hydrological behaviour of a catchment, particularly for operational flood modelling. Several studies have observed that surface runoff is a threshold process controlled by catchment wetness conditions, where runoff coefficients increase when soil moisture thresholds are exceeded (Western and Grayson Citation1998, Latron and Gallart Citation2008). In many instances, the condition of soil moisture stores in rainfall–runoff models is the principal factor in determining whether incident rainfall infiltrates into the soil, or becomes surface runoff. Better initialization of soil moisture variables is expected to lead to better partitioning of rainfall between infiltration and surface runoff and as a result more accurate simulation of flood events (Brocca et al. Citation2012). The runoff coefficient is low on hillslopes, due to high infiltration losses, where topographic properties have a considerable influence on the hydrological processes (Puigdefabregas et al. Citation1998). Depending on the storm intensity and duration, when the soil reaches a condition that precipitation intensity exceeds the infiltration capacity of the soil, infiltration excess runoff is generated. When the hillslope area switches to this wet condition, the lateral hydraulic conductivity increases substantially and subsurface lateral flow becomes dominant (Meyles et al. Citation2003). Conversely, foothills near the stream have the potential to saturate rapidly, even during small rainfall events, resulting in a saturation excess runoff (Penna et al. Citation2011).
Available hydrological models for streamflow prediction range from simple conceptual lumped models to comprehensive physically-based distributed models. Conceptual models, which adopt simplified representations of the major physical processes of the hydrological cycles, have been most effective in flood forecasting (Aubert et al. Citation2003). These models represent catchments using several conceptual storages, with parameters controlling store sizes and rates of outflow. Typically, one of these conceptual storages describes that partition of incident rainfall between infiltration and surface runoff and therefore can be considered to represent soil moisture. Most conceptual models can be used on an event-based or continuous simulation basis (Massari et al. Citation2014). Operational flood forecasting of the Australian Bureau of Meteorology (BoM) has been based on the Unified River Basin Simulator (URBS; Carroll, Citation1994), which is a conceptual event-based model. However, the BoM is moving to a continuous modelling system over Australia using the Short-Term Water Information Forecasting Tool (SWIFT; Pagano et al. Citation2010), which is a modelling framework that includes the widely used PDM, GR4H, SimHYD and SAC-SMA hydrological model options.
The literature abounds in studies that investigated how to improve streamflow simulation performance using different model structures (Chiew et al. Citation1993, Refsgaard and Knudsen Citation1996, Yew Gan et al. Citation1997, Perrin et al. Citation2001, Dye and Croke Citation2003, Vaze et al., Citation2010, Citation2011, Brocca et al. Citation2011), refinement of forcing data (Andréassian et al. Citation2001, Vaze et al. Citation2011), parameter estimation methods (Conti et al. Citation2002, Kay et al. Citation2006, Goswami and O’Connor Citation2007, Gibbs et al. Citation2008, Zakermoshfegh et al. Citation2008, Vaze et al. Citation2010, Abushandi and Merkel Citation2011, Dakhlaoui et al. Citation2012), and different types of observations such as evapotranspiration or leaf area index in the calibration process (Zhang et al. Citation2009, Citation2011). However, there has been no specific investigation on evaluating the soil moisture that is simulated in these rainfall–runoff models.
Specifically in Australia, Chiew et al. (Citation1993) compared five different models including simple and complex conceptual rainfall–runoff models in eight Australian catchments, and concluded that the complex conceptual model (MODHYDROLOG; Chiew and McMahon, Citation1991) was the best for simulating high and low daily flows, while the simple model (SFB; Boughton Citation1984) was adequate for estimating monthly and annual flows in wetter catchments. Vaze et al. (Citation2010) compared SAC-SMA, GR4J, IHACRES, SIMHYD, AWBM and SMARG models for 232 catchments in southeastern Australia and found that the SACRAMENTO and GR4J outperformed others in simulating the daily runoff series in both calibration and nearest-neighbour regionalization. Some studies have also been investigating the impact of rainfall accuracy on flow predictions (Andréassian et al. Citation2001, Vaze et al. Citation2011). Vaze et al. (Citation2011) investigated improvement in performance of conceptual rainfall–runoff models (SACRAMENTO, IHACRES, SIMHYD and SMARG) with improved spatial representation of rainfall in 240 catchments across Australia. Zhang et al. (Citation2009) investigated use of the MODIS-based remote sensing evapotranspiration product in a modified SIMHYD model as a daily conceptual rainfall–runoff model in southeastern Australia. They showed that calibration against both observed streamflow and evapotranspiration resulted in better streamflow forecasts when compared to calibration against the observed streamflow data alone. Zhang et al. (Citation2011) investigated the effect of incorporating NOAA leaf area index time series and land cover type data into a modified SIMHYD model on daily runoff and soil moisture estimation in 470 catchments in Australia; however, there was no evaluation of the soil moisture prediction skill.
A limited number of studies have sought to take advantage of soil moisture observations when calibrating hydrological models in Europe (Parajka et al. Citation2006, Citation2009, Sutanudjaja et al. Citation2014, Wanders et al. Citation2014, Silvestro et al. Citation2015), but they have typically not evaluated the derived root-zone soil moisture estimates. Parajka et al. (Citation2006) investigated the value of using satellite-derived root-zone soil moisture data in a semi-distributed conceptual single-layer model (HBV; Lindstrom Citation1997) by direct insertion of the data rather than calibration of the modelled soil moisture state. Parajka et al. (Citation2009) used both runoff and satellite-based topsoil moisture data in Austria to calibrate the HBV dual-layer model by minimizing a multi-objective function, and showed that use of both runoff and soil moisture data provided more robust parameters than using either of these observational data alone in calibration. Wanders et al. (Citation2014) utilized satellite-based surface soil moisture data from AMSR-E, ASCAT and SMOS in a synthetic experiment rather than a real study to calibrate the LISFLOOD physically-based model using a dual EnKF approach, demonstrating that calibration to both discharge and soil moisture data resulted in a reduction by 10–30% in RMSE for streamflow simulations.
Silvestro et al. (Citation2015) used soil moisture data from the European Organization for the Exploitation of Meteorological Satellites (EUMETSAT) in Italy to calibrate the Continuum distributed hydrological model, and found that use of both streamflow and satellite soil moisture data additionally constrained the independent parameters in the calibration process and improved the model representation of hydrological processes. In addition, Sutadujaja et al. (Citation2014) explored the use of discharge observations and SCAT/ERS-derived soil moisture data for calibration of a coupled groundwater–land surface model and found that the joint-calibration was successful in discharge, soil moisture and groundwater head predictions, with acceptable accuracy when they were evaluated against the observed data. In Australia, only Wooldridge et al. (Citation2003) jointly calibrated the variable infiltration capacity (VIC; Liang et al. Citation1994) model, a physically-based surface energy and water balance model rather than a conceptual rainfall–runoff model, using a combination of streamflow, ground-based soil moisture and evapotranspiration observations. They showed that streamflow predictability was similar to the single streamflow calibrated model, but that soil moisture prediction was considerably more consistent with the observations for the jointly calibrated model; inclusion of evapotranspiration in the joint-calibration was unsuccessful.
Most of the past research has focused on the effects of model structure, parameter estimation and forcing data on hydrological modelling, while limited studies have evaluated the skill of soil moisture prediction from rainfall–runoff models. Only one study investigated the benefits of ground-based soil moisture data for calibration and evaluation of hydrological models (Wooldridge et al. Citation2003). All other studies (Parajka et al. Citation2006, Citation2009, Sutanudjaja et al. Citation2014, Wanders et al. Citation2014, Silvestro et al. Citation2015) used only remotely sensed soil moisture observations in the calibration without any reference to in situ soil moisture for evaluation of the modelled and remote sensing datasets. With remotely sensed soil moisture only representing the top few centimetres of soil, there is much work needed to demonstrate the importance of accurate soil moisture representation in hydrological models. Investigating the accuracy of soil moisture predictions is also important for application of model data assimilation, since the success of data assimilation relies on unbiased model state prediction, which is largely dependent on the accuracy of model physics and parameter estimation (Moradkhani et al. Citation2005, Kumar et al. Citation2009, Chen et al. Citation2011). Data assimilation is one of the most advanced approaches used in recent years to align model predictions with observations (Pauwels et al. Citation2002, Vrugt et al. Citation2005, Chen et al. Citation2011).
Consequently, this paper evaluates the impact of using soil moisture observations in rainfall–runoff model calibration for improving streamflow modelling within the Murrumbidgee catchment in Australia. A joint-calibration that used both soil moisture and streamflow observations in the parameter optimization was applied and compared with results from calibration to streamflow alone in two sub-catchments, with semi-arid to sub-humid climatic condition, and using two different lumped conceptual models. Continuous streamflow modelling results were assessed for their ability to accurately represent the soil moisture and its impact on the streamflow, by comparing the simulated soil moisture with field observations from a dense monitoring network.
2 Study area and data
The focus of this study is the Murrumbidgee catchment in southeastern Australia. The total size of the Murrumbidgee catchment is 84 000 km2, with elevations ranging from 50 to 2200 m a.s.l., and it represents 8.2% of the total area of the Murray Darling Basin (MDB) in southeastern Australia. The land use in the Murrumbidgee catchment includes dryland and irrigated agriculture, native vegetation, plantation forests and urban areas (CSIRO Citation2008). The flow in the Murrumbidgee catchment is highly regulated to support irrigated agriculture. Therefore, to avoid modelling the effect of regulations, the streamflow model performance was assessed in two sub-catchments within the unregulated area: the upper Kyeamba Creek and Adelong Creek sub-catchments ().
Figure 1. Location of operational raingauges, OzNet monitoring sites, streamgauges and the two focus sub-catchments (Kyeamba and Adelong) in the Murrumbidgee catchment that are used in this study.
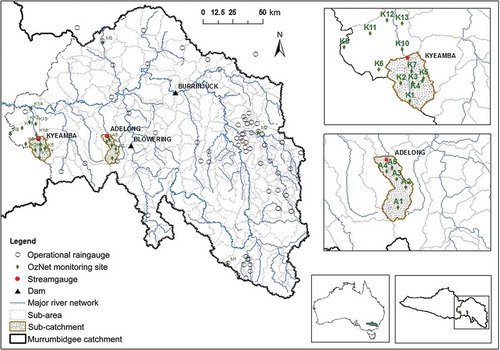
The Upper Kyeamba Creek and Adelong Creek are in topographically different locations in the mid-Murrumbidgee catchment, with approximate areas of 190 and 157 km2, respectively. The elevation ranges from 300 to 600 m a.s.l. in the Kyeamba area, and from 300 to 1000 m a.s.l. in the Adelong area. The average slopes in these sub-catchments are about 0.67 and 1.12%, respectively. The land use in both areas is dominated by dryland grazing, but native forest is also present in the Adelong sub-catchment (Green et al. Citation2011). Over a 10-year period from 2003 to 2012, average annual rainfall was 641 mm year−1 for the Upper Kyeamba Creek sub-catchment and 846 mm year−1 for the Adelong Creek sub-catchment, with average flows of 35 mm year−1 (total flow of 66 × 106 m3) and 137 mm year−1 (total flow of 215 × 106 m3), respectively. Average values of annual potential evapotranspiration (PET) in the sub-catchments for the corresponding period are 1430 mm year−1 (P/PET = 0.45) and 1380 mm year−1 (P/PET = 0.61), respectively. Semi-arid catchments are defined as having P/PET between 0.2 and 0.5 (Wheater et al. Citation2007), so the Kyeamba sub-catchment can be identified as having characteristics close to semi-arid.
These two sub-catchments were selected based on the availability of streamflow and ground-based soil moisture observations. Several OzNet monitoring sites (http://www.oznet.org.au; Smith et al. Citation2012) are located in the Kyeamba (K1, K2, K3, K4, K5 and K7) and Adelong sub-catchments (A1, A2, A3, A4 and A5), with soil moisture and rainfall observations spanning the period of interest. The OzNet monitoring sites, operational raingauges and streamgauges are shown in . At the OzNet sites, rainfall observations are available with 6 minutes temporal resolution for six sites over the Upper Kyeamba and five sites in Adelong Creek. The data have been aggregated to hourly time steps to be used in this study. After comparing the cumulative rainfall plots of different OzNet sites for each sub-catchment, the most representative rainfall site from January 2007 to December 2010 was selected for each sub-catchment, being K7 for Kyeamba and A4 for Adelong.
Operational real-time data, which are used for flood forecasting, are also available at hourly time steps (see ). However, it is expected that the OzNet rainfall data are more likely to be closer to the sub-catchment true rainfall than operational real-time data. This is because the OzNet data are available from multiple sites within the sub-catchment, while the operational gauges are sparsely located and often far away from the sub-catchments. Thus, the OzNet rainfall data during January 2007 to December 2010 were used for the calibration period, as representing the best available data. Nevertheless, the OzNet data are not continuously available for all sites during January 2011 to December 2012, meaning that OzNet rainfall data for the validation period are not as good as the data used during the calibration period. In addition, there are no available OzNet rainfall data in other sub-catchments in the Murrumbidgee catchment. Therefore, operational rainfall data were also used here, with the aim of demonstrating the impact on broader application. The different rainfall datasets used include: OzNet rainfall data from 2011 to 2012, operational rainfall from 2007 to 2010, and operational rainfall data from 2011 to 2012. The validation with operational data in 2007–2010 has been done to investigate how the difference between OzNet and operational data would affect the validation results in 2011–2012.
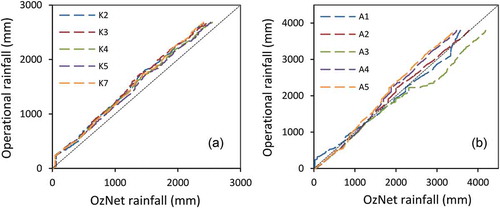
For this work, the operational data have been interpolated into all sub-areas, including the Upper Kyeamba and Adelong sub-catchments, in the study area (see ) and used on hourly time steps. To have an overview of the difference between OzNet data and the operational data, cumulative rainfall observations from the OzNet sites were compared with cumulative operational rainfall for each sub-catchment during 2007 to 2010, as shown in . In , except for the big difference in the early stages in the Kyeamba data, all K sites showed good agreement with operational data, with correlation coefficients from 0.47 to 0.5, while among A sites, A2 was closer to the operational data than other A sites within the Adelong sub-catchment, with correlation coefficients from 0.42 to 0.54.
Figure 2. Cumulative rainfall from OzNet sites in the (a) Kyeamba and (b) Adelong sub-catchments compared with cumulative interpolated operational rainfall in the sub-catchment. Comparison is for the period 2007–2010.
Sub-catchment average soil wetness data were derived from OzNet sites for the application of soil moisture observations in the modelling of these two areas. Volumetric soil moisture data were available at either 20- or 30-min time intervals for three soil layers, being 0–30, 30–60 and 60–90 cm depths. The data were collected by Campbell Scientific probes (CS615 or CS616) for the six K sites in Upper Kyeamba and the five A sites in Adelong. The average volumetric soil moisture over an equivalent depth of the soil as that used in the model was first calculated for each OzNet site using the data for these three depths (0–30, 30–60 and 60–90 cm). These values were then aggregated to hourly time steps to be used for soil wetness estimation. The details of the approach used for estimation of the sub-catchment average soil wetness are given in Section 4.2.
Average monthly PET data were derived from the gridded Australian Water Availability Project dataset (AWAP; Raupach et al. Citation2009) interpolated to the study sub-catchments. The real-time streamflow observations for the 6-year period 2007–2012 were obtained from the New South Wales Office of Water (http://www.water.nsw.gov.au/realtime-data/default.aspx) for streamgauges at the sub-catchment outlets.
3 Description of rainfall–runoff models
The continuous conceptual rainfall–runoff models selected for this study are GR4H (Génie Rural 4 paramètres Horaire; Mathevet Citation2005) and PDM (Probability Distributed Model; Moore Citation2007). These models were implemented in the SWIFT modelling framework, which is designed to support operational flood forecasting in Australia (Pagano et al. Citation2010). These two models were selected as they are soil moisture accounting (SMA) models, which are often used for operational flood forecasting (Leahy et al. Citation2008). In addition, these two models were selected among the hydrological models included in SWIFT, for testing in the study catchment, to investigate their applicability to flood forecasting of Australian catchments. The two models transform rainfall and potential evaporation input to streamflow at the catchment outlet. In this study, the models were applied at hourly time steps in a lumped configuration for each sub-catchment separately, with unique rainfall and potential evaporation over each sub-catchment. The lumped modelling approach adopted here is suitable for the small- to medium-sized catchments used in this work (Blackie and Eeles Citation1985).
The GR4H model is derived from the GR4J model (Perrin et al. Citation2003), which is a daily lumped model with four parameters. The GR4H structure is similar to GR4J, but with several adjustments to make the model more efficient at time steps shorter than one day (Bennett et al. Citation2014). GR4H consists of a production SMA store and a routing store. Two unit hydrographs are used to simulate the time lag between rainfall and streamflow. The four model parameters are: the maximum capacity of the production store (x1), a groundwater exchange coefficient (x2), the maximum capacity of the routing store (x3), and the time base of the unit hydrograph (x4) (see )). The rainfall (P) and potential evaporation (PE) are subtracted after interception to estimate the net rainfall (Pn) or evapotranspiration (En). In ), if P ≥ E, then Pn = P − E and En = 0; otherwise Pn = 0 and En = E − P. In the case that Pn ≠ 0, the infiltration to the production store (Ps) is defined by a function of level S in the production store. Perrin et al. (Citation2003) tested the GR4J model in 429 river basins with climates ranging from semi-arid to temperate and tropical humid, and showed that the results of the model were very satisfying compared to other models of the same type, such as IHACRES, HBV, SMAR and TOPMODEL. In addition, based on the study by Vaze et al. (Citation2010), GR4J had similar or better performance compared to other models (SACRAMENTO, IHACRES, SIMHYDE, AWBM and SMARG) in 232 catchments located throughout southeastern Australia.
Figure 3. Structure of the (a) GR4H and (b) PDM models.
The PDM has eight parameters and partitions the rainfall into direct runoff, soil moisture storage (S1) and groundwater recharge, as shown in ). The model assumes that different points in the catchment have different storage capacity, with spatial variation of the capacity over the catchment described by a probability distribution. In this study, a Pareto distribution, which is the most widely used distribution in practice, was used. The PDM used here employs a cascade of two linear reservoirs (S21 and S22) to route surface flows, and a nonlinear storage (S3) to route groundwater, with a standard recharge function. The effective rainfall is equal to the soil moisture excess calculated at each time step, and the evaporation rate is assumed equal to the potential evaporation multiplied by the relative saturation of the catchment. This model has been widely used for both operational and design flow prediction purposes in the UK and Belgium (Moore Citation1999, Cabus Citation2008, Pechlivanidis et al. Citation2010).
4 Methods
4.1 Estimation of sub-catchment average observed and modelled soil wetness
Modelled soil wetness (SWsim, %) at each time step was estimated from the conceptual soil water store of the model using:
where SMsim,i is the simulated soil moisture (mm) at the ith time step and Smax is the soil water storage (mm) in the model, being the maximum capacity of the production store in GR4H (Cmax) or the average of point soil moisture storage capacities over the catchment in PDM (Smax), since the PDM storage capacity is spatially varied over the catchment. For the Pareto distribution used in PDM in this study, the average of point storage capacities was calculated by (Moore Citation2007):
where Cminrat is the ratio of Cmin to Cmax. Equation (1) is based on the assumption that the model soil moisture will reach the maximum storage capacity at least once during the 6-year study period. This means that it is assumed that Smax represents the actual upper bound of catchment soil moisture content. For PDM, it was assumed that all spatially distributed stores have reached the maximum capacities, meaning that on average the catchment soil moisture content reaches the maximum value.
The observed soil wetness used in this study is the average of OzNet soil wetness over the monitoring sites for each sub-catchment, where the soil wetness (%) for each site has been calculated as:
where θi is the average volumetric soil moisture (m3 m−3) at the ith time step, and θmin and θmax are the minimum and maximum of the volumetric soil moisture (m3 m−3) at each OzNet site for an equivalent soil depth, as implied by the size of the conceptual soil water store in the model, defined by:
Equation (3) effectively scales the soil moisture observation at each time step to a value between 0 and 100, representing the degree of saturation of a soil column with equivalent soil depth. Volumetric soil moisture data (θ) were available over the soil layers (0–30, 30–60 and 60–90 cm) for each of the six K sites in the Upper Kyeamba sub-catchment, and the five A sites in the Adelong sub-catchment (shown in ). The average of the volumetric soil moisture over the equivalent depth of the soil was calculated for each site using the available data for these three different depths. The θmin and θmax were obtained from 6 years of soil moisture record (2007–2012) for each site separately, taking into account the variations of soil moisture over the catchment during this long period. The average of the soil wetness was then calculated over different sites for each of the sub-catchments. Since all sites were not operating continuously for 2011–2012, the average soil wetness was taken from different stations (two or three stations) rather than all sites within the sub-catchment in these instances. After calibration of the models, the model soil wetness was assessed against soil wetness observations. The difference between observed and modelled soil wetness is presented as the root mean square error (RMSE) and mean error (ME) for the calibration and validation periods. The mean error is taken as the average of differences over the calibration or validation period. This comparison gives a view of the accuracy of the models in estimation of the antecedent soil moisture prior to a runoff event.
4.2 Calibration and validation of hydrological models
The hydrological models were first calibrated to streamflow observations at the Kyeamba and Adelong sub-catchment outlets using hourly data for the period 2007–2010. The models were also calibrated jointly to streamflow and soil moisture observations as a joint-calibration in both sub-catchments, to additionally achieve the best match between observed and modelled soil moisture. The shuffled complex evolution algorithm (SCE; Duan et al. Citation1994) was used to automatically calibrate the parameters by minimizing an objective function.
The adopted objective function for calibrating to streamflow only (SF-calibration) is the mean squared error (MSE) of simulated streamflow:
where Qobs,i and Qsim,i are the observed and simulated streamflow, respectively, at the ith time step, and n is the number of time steps available for calibration. This objective function was adopted because it is sensitive to error in high flows, which are more important for flood modelling than low flows.
The objective function adopted to calibrate the model jointly to streamflow and soil moisture observations (joint-calibration) is also based on the average sum of squared errors:
where SWobs,i and SWsim,i are the observed and simulated soil wetness, respectively, at the ith time step, and is the average of soil wetness observations over the entire calibration period (see next section for soil wetness estimations). To allow for scale differences between the streamflow and soil moisture simulation errors, the sums of square errors for each component are normalized by the variance of the corresponding observations.
In this study, there were limitations in terms of temporal availability of the soil wetness data during the calibration and/or validation periods. There were insufficient data recorded for K1, K2, K5, K7, A2, A4 and A5 over the validation period. Moreover, A3 did not have any data records for January to May 2011 and there were no data available from A4 during both calibration and validation periods. Therefore, considering the limited data availability, the average-based soil moisture observations created the most complete record of data to be used in joint-calibration. However, to investigate the impact of spatial variability of soil moisture on model calibration, the models were also jointly calibrated to streamflow and soil wetness observations from single stations. This allows for investigating whether the calibration to spatially averaged soil moisture hinders taking into account the influence of soil moisture heterogeneity on hydrological responses. As a further investigation, the most representative station within the sub-catchment was identified based on the correlation coefficients between the soil wetness observations from each station. The station that showed the highest correlation coefficients with other stations was selected as the most representative within the sub-catchment. Both models were then jointly calibrated to soil wetness observations from the representative stations, to understand how the joint-calibration to the representative station affects the hydrological modelling results as compared to joint-calibration to the observations from a single station or average soil wetness data over the sub-catchment.
The model performance for streamflow modelling in the calibration and validation periods was assessed using the Nash-Sutcliffe efficiency (NSE; Nash and Sutcliffe Citation1970) coefficient based on observed and simulated streamflow as:
where NSE ranges from −∞ to 1. An efficiency of 1 represents a perfect match of simulated flow to the observed data.
5 Results
5.1 Evaluation of streamflow predictions
A warm-up period during which the state variable of the model evolves from 0 (default value) to an appropriate value was used for the calibration to avoid the effect of initialization on the calibration results. After calibration, the initial state value at the end of the simulation during calibration period was used as the model initialization for the validation. All parameters were optimized for both models through the calibration procedure. The optimized values for the parameters of the GR4H and PDM models are presented in . For PDM, Cmax is the maximum soil moisture storage capacity (mm), and b is the exponent of the Pareto distribution controlling the degree of spatial variability of storage capacity. After joint-calibration, the model maximum capacity changed dramatically in GR4H and slightly in PDM (x1 and Cmax, respectively) in both study areas, compared to SF-calibration alone (see ). The change in this parameter shows that, with a small change in the calibration skill, the joint-calibration has adjusted the soil moisture parameter in a way that is more consistent with soil moisture observations. The groundwater exchange coefficient (x2) in GR4H changed especially in the Kyeamba sub-catchment after joint-calibration, while other parameters (x3 and x4) did not change significantly. For PDM, the groundwater recharge time constant parameter (kg) varied dramatically for both sub-catchments and the actual evaporation function exponent (be) changed for the Adelong sub-catchment, while there was no significant change in other parameters (excluding Cmax and Kg) after joint-calibration.
Table 1. Optimized parameters for GR4H and PDM for calibration to streamflow (SF-cali.) and joint-calibration with normalized soil moisture (Joint-cali.) in the Kyeamba and Adelong sub-catchments.
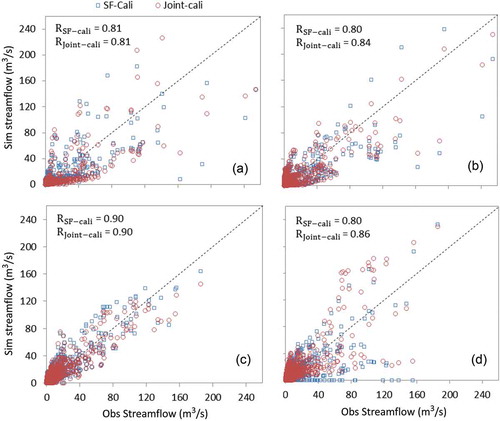
In order to contextualize the modelling results, the observed rainfall, observed and simulated streamflow, and the NSE scores for the calibration and validation periods of the two models for the Kyeamba and Adelong sub-catchments are illustrated in and , respectively. In these figures, the results for calibration to only streamflow (SF-calibration) (,) and ,)) are compared with the results for calibration to both streamflow and soil moisture (joint-calibration) (,) and ,)). The validation results in these figures are from operational rainfall data. The scatter plots of the observed and simulated streamflow and the correlation coefficient values are also shown in . Based on the correlation values, the streamflow prediction skill of PDM was improved slightly after joint-calibration as compared to SF-calibration results, while there is no change in the correlations for GR4H.
Figure 4. Observed OzNet (calibration period) and operational (validation period) rainfall, and observed and simulated streamflow for calibration to streamflow from (a) GR4H and (b) PDM, and calibration to both streamflow and soil moisture from (c) GR4H and (d) PDM, for the Upper Kyeamba sub-catchment.
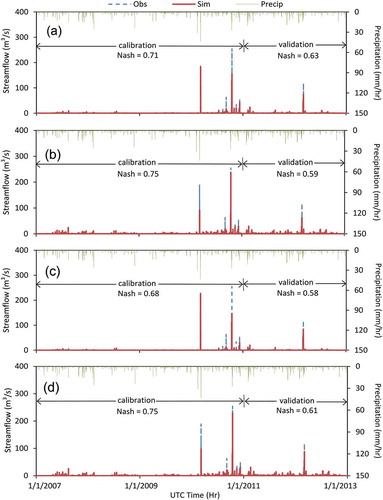
Figure 5. Same as , but for the Adelong Creek sub-catchment.
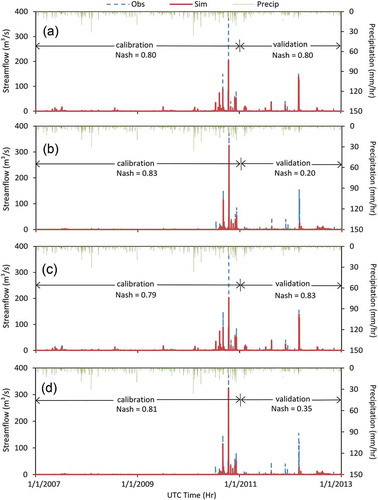
Figure 6. Scatter plots of observed and simulated streamflow from calibration to streamflow alone (SF-cali) and joint-calibration (Joint-cali) to streamflow and average soil wetness observations for (a and c) GR4H and (b and d) PDM in the (a and b) Kyeamba and (c and d) Adelong sub-catchments.
presents in more detail the NSE scores for calibration in the period 2007–2010 (Cal.), validation using OzNet rainfall data in 2011–2012 (Val.1), and operational rainfall data in 2007–2010 (Val.2) and 2011–2012 (Val.3). In , the RMSE between observed and simulated soil wetness is also presented in the second column for calibration and validation (Val.3). It is clear from that calibration NSE of PDM is better than GR4H for both calibration schemes in both study sub-catchments, but the validation skill score for GR4H is mostly better than for PDM for both sub-catchments. There are big differences between the NSE scores in calibration and validation with operational rainfall data (Val.2) due to the lower spatial resolution of the operational raingauges compared to the OzNet sites. However, there was no significant difference between the validation skill scores when using OzNet and operational rainfall data in 2011–2012 (Val.1 and Val.3) for the Kyeamba sub-catchment, and the scores for Val.3 were even better than Val.1 for the Adelong sub-catchment. Because the same validation scores were achieved from OzNet and operational rainfall data in 2011–2012 for Kyeamba (Val.1 and Val.3) and better skill was obtained in validation from operational data for the Adelong area (Val.3), it is assumed that use of operational rainfall data with low spatial resolution should not adversely affect the modelling results. Thus, in the following we focus on the results from using operational rainfall data (Val.3) for both sub-catchments for the validation period.
Table 2. NSE scores of observed and simulated streamflow modelling and RMSE (%) of observed and simulated soil wetness from calibration to streamflow alone (SF-cali.), and calibration to both streamflow and soil moisture (Joint-cali.) in the Kyeamba (K) and Adelong (A) sub-catchments for GR4H and PDM. The NSE scores are shown for calibration with OzNet rainfall (2007–2010, Cal.), validation with OzNet rainfall (2011–2012, Val.1), validation with operational rainfall (2007–2010, Val.2 and 2011–2012, Val.3); the RMSE results are shown for Cal. and Val.3.
After joint-calibration in the Kyeamba area, the NSE scores of the GR4H models in both calibration and validation (Val.3) decreased, from 0.71 to 0.68 and from 0.63 to 0.58, respectively. In this sub-catchment, the PDM skill during the calibration period did not change (0.75 for both calibration schemes), while it showed slightly increased skill scores in the validation (Val.3), increasing from 0.59 to 0.61. In the Adelong sub-catchment, the skill score during the calibration decreased slightly, from 0.80 to 0.79 in GR4H and from 0.83 to 0.81 in PDM, while the Val.3 score increased slightly (from 0.80 to 0.83) for GR4H and significantly (from 0.2 to 0.35) for PDM after joint-calibration. Therefore, a small degradation was seen in the calibration scores when using soil moisture in addition to streamflow, but apart from GR4H in the upper Kyeamba sub-catchment, the validation scores improved after joint-calibration, especially in cases with very low skill (e.g. PDM for the Adelong sub-catchment). This result indicates that overall the soil moisture constraint in the calibration procedure improved the model skill in streamflow prediction over the whole validation period.
The degradation in the calibration and validation skills of the GR4H model for the Kyeamba sub-catchment, and also the degradation in skills of both models for the calibration in the Adelong sub-catchment after joint-calibration, should be investigated in more detail for specific events to see how the performance of the models changes after joint-calibration.
5.2 Evaluation of hydrological models in soil moisture estimations
and depict soil wetness estimation in the models, evaluated against the average of the soil wetness observations from OzNet sites during the calibration period for the Kyeamba and Adelong sub-catchments, respectively. Similar plots in and illustrate how the soil moisture was simulated for the validation period 2011–2012 (Val.3). In these figures, RMSE and ME between soil wetness observations and model soil wetness estimations are shown after using the parameters from SF-calibration and joint-calibration. The comparison allows for investigation of the difference in the soil moisture simulation before and after joint-calibration in the models. In GR4H, for both sub-catchments, the model total saturation was not achieved in either the calibration or validation period, with the maximum water level in the storages for SF-calibration and joint-calibration being 204 and 161 mm, respectively, in Kyeamba and 105 and 154 mm, respectively, in Adelong. Therefore, to be consistent with the observations, which were scaled to 0–100, the simulated soil wetness shown in , (a), 9(a) and 10(a) for GR4H was calculated by scaling the modelled soil water level to a value between 0 and 100 using the maximum and minimum values of modelled soil water storage obtained from the entire 6-year study period. It should also be mentioned that, because the observed sub-catchment soil wetness was the average of sites, the maximum soil wetness result shown is a value that is slightly smaller than 100%. Likewise, the minimum soil wetness did not reach zero as the minimum saturation did not occur at the same time for all sites in the sub-catchment. For joint-calibration, the models were initialized with the soil wetness observations at the beginning of the calibration as shown in and , but the results indicate that the initialization had no impact on the model skill during the following time intervals.
Figure 7. Observed and simulated soil wetness for (a) GR4H and (b) PDM for the calibration period in the Upper Kyeamba sub-catchment; calibration is to streamflow alone (SF-cali) and to streamflow and soil moisture jointly (Joint-cali). OzNet rainfall data are used for the calibration.
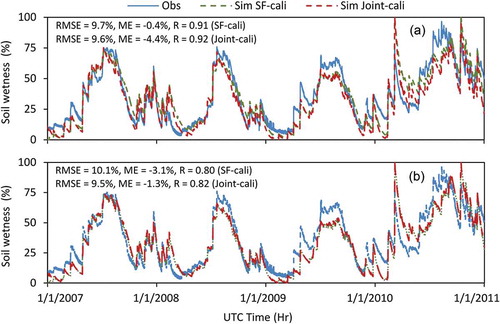
Figure 8. Same as , but for the Adelong Creek sub-catchment.
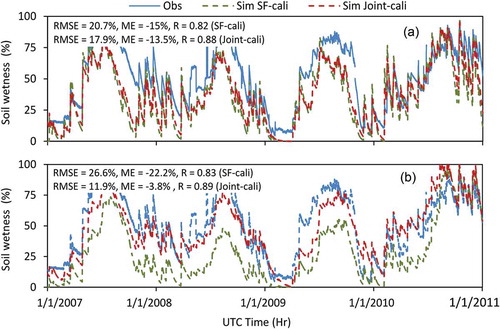
Figure 9. Observed and simulated soil wetness for (a) GR4H and (b) PDM for the validation period in the Upper Kyeamba sub-catchment; calibration is to streamflow alone (SF-cali) and to streamflow and soil moisture jointly (Joint-cali). Operational rainfall data are used for the validation.
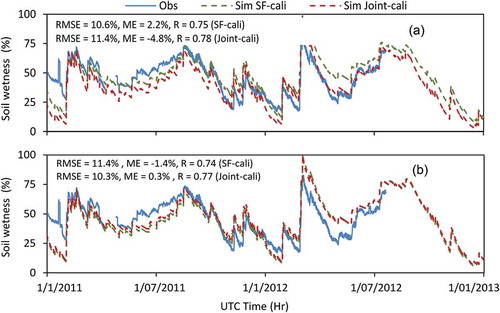
Figure 10. Same as , but for the Adelong Creek sub-catchment.
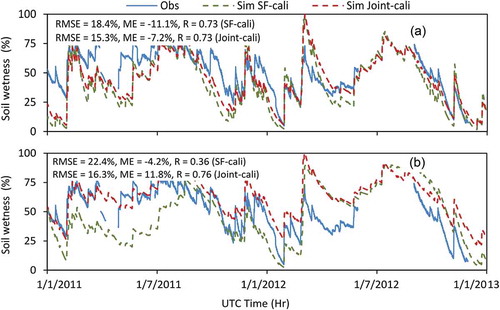
As seen in and , the RMSE and ME mostly decreased after joint-calibration, when compared to SF-calibration alone, but there were still differences between the simulations and observations. In these figures, it is clearly understood that both models can estimate the variation of observed soil wetness through time in both sub-catchments. However, apart from some periods, the models mostly underestimated the soil moisture and could not reach the high value of saturation during the wet periods. Moreover, ) and (b) shows that both models underestimated soil wetness in both calibration approaches in Kyeamba, with approximately the same RMSE, 9.7 and 9.6% in GR4H and 10.1 and 9.5% in PDM for SF-calibration and joint-calibration, respectively. The ME increased from −0.4 to −4.4% in GR4H after joint-calibration while the error decreased from −3.1 to −1.3% in PDM. ,) shows that in the Adelong area, apart from some periods in 2010, both models underestimated soil moisture for SF-calibration with a much higher RMSE and ME seen in PDM in SF-calibration (26.6 and 22.2%, respectively) compared to RMSE (20.7%) and ME (−15%) for GR4H. However, after joint-calibration, the errors in PDM declined significantly, to 11.9% (RMSE) and −3.8% (ME), which are much lower than the RMSE and ME for GR4H (17.9 and −13.5%, respectively). This improvement in the modelled soil wetness is clear in ). From the results in and , it is seen that there was only a small change in the soil moisture simulations after joint-calibration where the model already had relatively good performance in streamflow modelling (e.g. the GR4H model in both sub-catchments and PDM in the Kyeamba area). However, in the Adelong sub-catchment, the errors between the modelled and observed soil wetness improved significantly in PDM, which had the worst skill in streamflow and soil wetness estimations in SF-calibration.
In and , there were no significant changes in RMSE errors in the soil moisture simulations compared to the observations after joint-calibration for Kyeamba (10.6 and 11.4% in GR4H, and 11.4 and 10.3% in PDM), whereas the errors decreased from 18.4 to 15.3% in GR4H and from 22.4 to 16.3% in PDM for the Adelong sub-catchment. The ME degraded slightly from 2.2 to −4.8% in GR4H, while it improved slightly from −1.4 to 0.3% in PDM in the Kyeamba sub-catchment. In the Adelong area, ME improved from −11.1 to −7.2% in GR4H, while it degraded from −4.2 to 11.8% in PDM after joint-calibration. Moreover, it is clear from ,) that in Kyeamba there is no significant change in the soil wetness simulations after joint-calibration in both models, with better soil moisture simulations seen in the GR4H after joint-calibration.
From ), apart from some points, there was no significant change in the Adelong sub-catchment in the soil moisture simulations for GR4H. However, PDM showed some improvements in soil moisture simulation in mid-2011, but the huge differences in early 2012 were not reduced after joint-calibration. Here, it should be highlighted that the catchment average soil moisture observations for the period 2011–2012 had lower accuracy compared to the calibration period, as there were less continuous data available for the sites for the validation period. Therefore, it was expected that the observed soil wetness average over the sub-catchments had lower accuracy, and thus the differences between observations and simulations being higher in the validation than the calibration period is no surprise. In –, the correlation coefficients between observed and simulated soil wetness were improved, with the highest improvement seen for PDM in the Adelong sub-catchment, where it increased from 0.36 to 0.76 over the validation period.
5.3 Further evaluation of the streamflow modelling
There were some big runoff events in 2010 and 2012 in the Murrumbidgee catchment resulting in floods. Here, the focus is on the streamflow and soil moisture predictions in the two focus sub-catchments during these periods. To evaluate the model streamflow and soil moisture prediction skill, compares observed flow and soil wetness in the Kyeamba sub-catchment with simulated flow and soil wetness using parameters from SF-calibration and joint-calibration for the two events, October 2010 (calibration) and March 2012 (validation). The same plots are presented in for the Adelong sub-catchment.
Figure 11. Comparison of observed and simulated streamflow and soil wetness from (a) and (b) GR4H and (c) and (d) PDM for a calibration event (left) using OzNet rainfall data, and a validation event (right) using operational rainfall data, after calibration to only streamflow (SF-cali) and calibration to both streamflow and soil moisture (Joint-cali) in the Upper Kyeamba Creek sub-catchment.
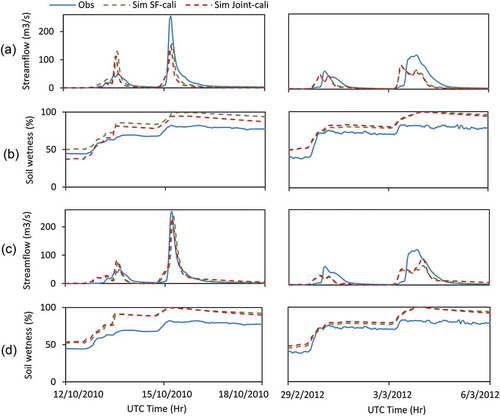
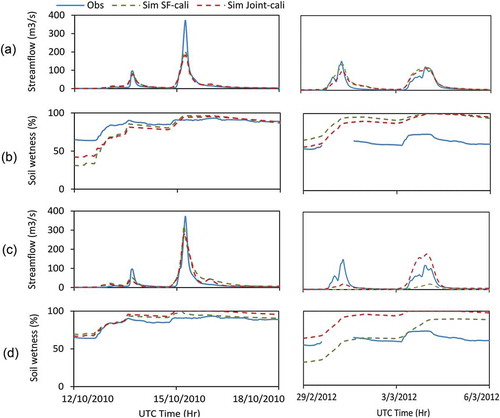
Figure 12. Same as , but for the Adelong Creek sub-catchment.
In ,), there were small differences in streamflow simulation in October 2010 (calibration) between SF-calibration and joint-calibration for the Kyeamba area. However, in March 2012 (validation), the magnitude of the peak flows between the two calibration approaches was not very different in GR4H, but was slightly improved in PDM for the second flow in this sub-catchment. GR4H had better shape in flow for the second flow but with a bigger timing error than PDM. Therefore, despite the small degradations from GR4H in Cal.1 and Val.3 scores in , the performance of GR4H did not change significantly after joint-calibration.
,) shows that there was a small degradation in flow simulations in October 2010 in the Adelong area for both models after joint-calibration compared to SF-calibration alone. In March 2012, GR4H underestimated the first peak flow after joint-calibration, while it was well predicted using parameters from SF-calibration. However, there was no change in the second peak flow prediction. PDM strongly underestimated both peak flows in 2012 for SF-calibration, while it performed slightly better in the first event and overestimated the second peak flow. As shown in and (d), PDM showed 100% saturation for both calibration approaches in Kyeamba and for joint-calibration in the Adelong area. GR4H did not reach 100% saturation for joint-calibration in Kyeamba and for both calibration schemes in the Adelong area in October 2010, as seen in and (b).
The difference between the streamflow prediction skill of each model was investigated for the different events in October 2010, and February and March 2012. presents the model streamflow prediction errors compared to observed peak flow, rainfall accumulation (rainfall amount relative to the duration), observed peak flow, and modelled pre-event soil wetness including both calibration schemes in Kyeamba and Adelong. The peak observed flows have been considered as low flow (<100 m3 s−1), medium flow (100–199 m3 s−1) and high flow (200–400 m3 s−1).
Table 3. Summary of streamflow prediction errors (%) from GR4H and PDM, rainfall amount relative to duration (mm h−1), modelled pre-event soil wetness (%), and observed peak flow (m3 s−1) for the events in October 2010, and February and March 2012 in Kyeamba (K) and Adelong (A).
It can be seen from that PDM had better streamflow prediction skill for high peak flows (200–400 m3 s−1) with streamflow prediction errors of 5–25%, while GR4H predicted observed high flows with 40–50% errors. Conversely, GR4H had better performance for low and medium flows (60–99 and 100–199 m3 s−1) with 10–25% and 0–35% errors, respectively, when the rainfall accumulation was between 2 and 3.1 mm h−1. In contrast, both models greatly over-predicted the low streamflow event (50 m3 s−1) in October 2010 in the Kyeamba sub-catchment, when the rainfall accumulation was relatively high (3.5 mm h−1). This is because the models were not capable of predicting high rainfall intensity events. It was also found that PDM predicted medium events (100–199 m3 s−1) with errors between 25 and 50% when the pre-event soil wetness was between 70 and 100%, while the model prediction errors increased to 70–100% for the medium events when the pre-event soil wetness was low (30–65%). Consequently, PDM tended to predict high flows with better skill than GR4H, while the GR4H model tended to have better performance for low to medium peak flows.
5.4 Evaluation of the impact of soil moisture spatial variability on joint-calibration
The NSE scores of streamflow simulations from joint-calibration to streamflow and soil wetness observations from different stations are compared to calibration to streamflow alone, and joint-calibration to average soil wetness, in . All evaluation scores obtained for each station here were calculated for the duration when the data for the station were available over the calibration/validation periods. In , the NSE scores did not change significantly for joint-calibration to single stations, with an improved score only observed for PDM in the Adelong sub-catchment, when compared to calibration to streamflow and joint-calibration to average soil wetness observations. Moreover, shows that RMSE and R did not change significantly for K5 and K7 for either model in Kyeamba, with the scores mostly degraded when calibrating to single stations in comparison to average-based joint-calibration. However, shows that A2, A3 and A5 resulted in similar or slightly better RMSE and R than other calibration results. Consequently, given the marginal changes observed in streamflow prediction skill after joint-calibration to soil wetness from single stations, and the limited temporal availability of the soil moisture data at single stations, the joint-calibration based on average soil wetness observations was adopted for the hydrological model calibration and evaluation of this work. Among the stations, based on the correlation coefficient values between the soil wetness observations from different stations, K5 and A2 were estimated to be the most representative stations for the soil moisture spatial variability in Kyeamba and Adelong, respectively. It was also shown that joint-calibration to the representative station (K5 and A2) produced acceptable NSE results, suggesting that the representative station captured the important dynamics of the soil wetness, thus yielding correct hydrological responses in the catchment.
Table 4. Comparison of NSE for streamflow modelling in the Kyeamba and Adelong sub-catchments after calibration to streamflow alone (SF-cali), after joint-calibration to streamflow and soil wetness from each station (K1, K2, K3, K4, K5 and K7; A1, A2, A3, A4 and A5), and after joint-calibration streamflow and average soil wetness observation (Ave) for the calibration (Cal.) and validation (Val.) periods. The NSE scores are not shown for the stations where no sufficient soil wetness data were available over the validation period.
Figure 13. RMSE and the correlation coefficient (R) between observed and simulated soil wetness from (a) and (c) GR4H and (b) and (d) PDM after calibration to streamflow alone for the calibration (SF-cali (Cal)) and validation (SF-cali (Val)) periods and after joint-calibration to streamflow and soil wetness observations from each station (K1, K2, K3, K5 and K7) or average soil wetness (Ave) for calibration (Joint-cali (Cal)) and validation periods (Joint-cali (Val)) in the Kyeamba sub-catchment. The scores are not shown for the stations where no sufficient soil wetness data were available over the validation period.
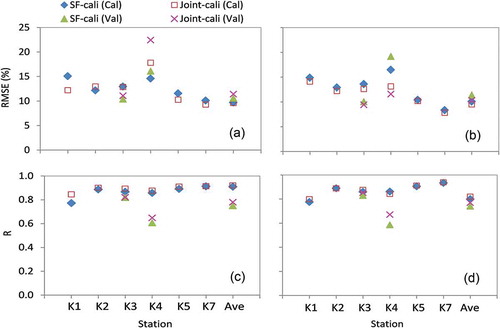
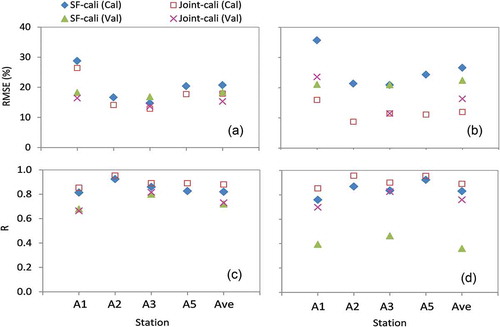
Figure 14. Same as , but for soil wetness observations from each station (A1, A2, A3 and A5) or average soil wetness (Ave) in the Adelong sub-catchment. The scores are not shown for A4 and other stations where no sufficient soil wetness data were available over the calibration or validation period.
6 Discussion
In this study, the NSE scores of streamflow modelling were different between the sub-catchments for both models. This indicates that the streamflow modelling performance depends on the characteristics of the area, such as annual rainfall amounts and average flows, which were found to be different between the sub-catchments (see Section 2). The climatic conditions are also quite different in the Kyeamba and Adelong sub-catchments, with semi-arid and sub-humid climate, respectively. Infiltration-excess runoff is dominant in semi-arid catchments, while saturation-excess runoff is dominant in humid catchments. Moreover, high antecedent precipitation conditions in semi-arid areas can lead to saturation excess runoff generation in wetter periods as a result of reduced infiltration capacity. Hence, streamflow prediction skill is expected to be hindered in semi-arid catchments due to the complex hydrological processes and increased nonlinearity of catchment response to rainfall (Camacho Suarez et al. Citation2015, Huang et al. Citation2016). In this study, GR4H resulted in better streamflow prediction in the Adelong area, having more humid conditions compared to Kyeamba, despite the streamflow prediction performance being acceptable in the Kyeamba sub-catchment for both GR4H and PDM, with calibration and validation NSE scores mostly greater than 0.60.
The streamflow modelling skills were also different between GR4H and PDM for a specific sub-catchment. It was found that PDM tended to predict high flows better than GR4H, while GR4H had better performance for low to medium peak flows. The different performance between the models, especially in the Adelong sub-catchment, can be associated to the structure of the models and the hydrological processes they use for soil moisture estimation. For example, GR4H did not reach the maximum water storage capacity at all, while the catchment average soil moisture storage was saturated for PDM during some periods. In addition, a bucket is considered to represent the soil moisture storage in the GR4H model, while in PDM a continuous distribution of stores with different soil moisture capacity is used for surface runoff production. Furthermore, PDM utilizes recursive equations for representing surface and subsurface storage, meaning that fluxes occur continuously throughout time. This is in contrast to most of the other models (e.g. GR4H and SIMHYD), which employ a sequence of fluxes and water flows instantaneously between stores.
In addition, both GR4H and PDM had similar soil moisture prediction skills in the Kyeamba sub-catchment when jointly calibrated to both streamflow and soil moisture observations. In the Adelong sub-catchment, the results showed that PDM had slightly better estimation of soil moisture than GR4H after joint-calibration. In this sub-catchment, PDM with more parameters also had better streamflow prediction skill in both calibration methods. However, PDM was outperformed in streamflow prediction over the validation period by GR4H in most cases, despite the latter having a simple structure and fewer parameters. Consequently, of these two models, GR4H is recommended for use in the foothills of the Murrumbidgee catchment or other similar Australian catchments with semi-arid to sub-humid climate, due to the better performance than PDM in streamflow and soil moisture predictions.
There were no significant changes in the streamflow prediction efficiency for both models in Kyeamba and for the GR4H model in the Adelong sub-catchment after joint-calibration, as compared to calibration to SF-calibration. Conversely, obvious improvements were seen in soil moisture prediction skill. The lack of improvements in streamflow predictions does not deny the effectiveness of the joint-calibration method for more accurate estimation of the models’ parameters. Indeed, the simulation with parameters obtained from joint-calibration was much more consistent with the real condition in the catchment in terms of the soil storage. Significant improvements in both streamflow and soil moisture predictions were seen in PDM after joint-calibration in Adelong, as compared to SF-calibration. It can be inferred from the results of this study that joint-calibration to streamflow and soil moisture yields a better streamflow prediction where the model cannot fit to streamflow observations through the calibration to streamflow alone, due to the uncertainties in rainfall input or streamflow observations. This result has not been observed in past studies (Parajka et al. Citation2009, Sutanudjaja et al. Citation2014, Silvestro et al. Citation2015) indicating improved soil moisture prediction efficiency alone with no changes in runoff prediction skills.
It is important to recognize that possible uncertainties in the observational data, including streamflow, rainfall and soil moisture observations, will have an influence on the modelling skill scores and the errors in the calibration and validation period. While the joint-calibration scheme buffers the uncertainties in the rainfall and streamflow observations in the calibration, this could also bring some other uncertainties into the modelling due to errors in the soil wetness observation estimations. For example, the average of the volumetric soil moisture has been used over an effective depth. However, this is based on some assumptions regarding the effective depth and the porosity of the soil. Furthermore, investigations on the accuracy of the soil moisture observations from the field measurements are required for application of this calibration method, as the estimated soil wetness observations are very sensitive to changes in the volumetric soil moisture data.
7 Conclusion
This study showed the results of streamflow and soil moisture estimation from two rainfall–runoff models with different structures. The GR4H and PDM models were calibrated and validated in two sub-catchments located in the Murrumbidgee catchment in southeastern Australia. The models have a single soil moisture storage over the catchment using four and eight parameters, respectively. Two calibration methods were used and evaluated. For the first calibration method, the objective function was based on minimizing only the difference between observed and modelled streamflow. This is the most commonly used method in calibration of hydrological models. In the second calibration scheme, the difference between observed and simulated soil wetness was coupled with streamflow differences to account for the effect of accuracy of soil storage simulation in the modelling. Soil moisture estimated with and without joint-calibration in the models was evaluated against soil moisture observations from field measurements. The performance of the models in flow estimation mostly did not change significantly after joint-calibration in the calibration period. However, in the validation, PDM had much better predictions of the flows, especially in the sub-catchment where it had low streamflow prediction skill from the initial calibration. While it was shown that PDM had better streamflow and soil moisture estimations over the joint-calibration period, it was outperformed by the GR4H model over the validation period. Consequently, it is recommended that the GR4H model be used in preference to PDM in the foothills of the Murrumbidgee catchment or other sub-humid to semi-arid catchments in Australia, and those soil moisture data should be used in the calibration process.
Acknowledgements
The authors express their thanks to David Enever and Prasantha Hapuarachchi from the Bureau of Metrology for their comments made on the modelling and for providing the node-link information and observational rainfall and streamflow data for the study area. The cooperation of Melbourne University and Monash University in providing the observational rainfall and soil moisture data from the field measurements is also acknowledged.
Disclosure statement
No potential conflict of interest was reported by the authors.
Additional information
Funding
Related Research Data
References
- Abushandi, E.H. and Merkel, B.J., 2011. Application of IHACRES rainfall–runoff model to the wadi Dhuliel arid catchment, Jordan. Journal of Water and Climate Change, 2, 56–71. doi:10.2166/wcc.2011.048
- Andréassian, V., et al., 2001. Impact of imperfect rainfall knowledge on the efficiency and the parameters of watershed models. Journal of Hydrology, 250, 206–223. doi:10.1016/S0022-1694(01)00437-1
- Aubert, D., Loumagne, C., and Oudin, L., 2003. Sequential assimilation of soil moisture and streamflow data in a conceptual rainfall–runoff model. Journal of Hydrology, 280, 145–161. doi:10.1016/S0022-1694(03)00229-4
- Bennett, J.C., et al., 2014. A System for Continuous Hydrological Ensemble Forecasting (SCHEF) to lead times of 9days. Journal of Hydrology, 519, 2832–2846. doi:10.1016/j.jhydrol.2014.08.010
- Beven, K., 1989. Changing ideas in hydrology - the case of physically-based models. Journal of Hydrology, 105, 157–172. doi:10.1016/0022-1694(89)90101-7
- Blackie, J.R. and Eeles, C.W.O., 1985. LUMPED CATCHMENT MODELS. Chichester, Engl: John Wiley & Sons.
- Boughton, W.C., 1984. A simple model for estimating the water yield of ungauged catchments. Australia: Transactions of the Institution of Engineers, Civil Engineering, CE26, 83–88.
- Brocca, L., et al., 2012. Assimilation of surface- and root-zone ASCAT soil moisture products into rainfall–runoff modeling. IEEE Transactions on Geoscience and Remote Sensing, 50, 2542–2555. doi:10.1109/TGRS.2011.2177468
- Brocca, L., Melone, F., and Moramarco, T., 2011. Distributed rainfall–runoff modelling for flood frequency estimation and flood forecasting. Hydrological Processes, 25, 2801–2813. doi:10.1002/hyp.v25.18
- Cabus, P., 2008. River flow prediction through rainfall–runoff modelling with a probability-distributed model (PDM) in Flanders, Belgium. Agricultural Water Management, 95, 859–868. doi:10.1016/j.agwat.2008.02.013
- Camacho Suarez, V.V., et al., 2015. Understanding runoff processes in a semi-arid environment through isotope and hydrochemical hydrograph separations. Hydrology and Earth System Sciences, 19, 4183–4199. doi:10.5194/hess-19-4183-2015
- Carroll, D.G., 1994. Aspects of the URBS runoff routing model. In: Proceedings of the Water Down Under Conference. 1994 Part 3 (of 3), Adelaide, Australia. IE Aust, 169–176.
- Chen, F., et al., 2011. Improving hydrologic predictions of a catchment model via assimilation of surface soil moisture. Advances in Water Resources, 34, 526–536. doi:10.1016/j.advwatres.2011.01.011
- Chiew, F.H.S., Stewardson, M.J., and Mcmahon, T.A., 1993. Comparison of six rainfall–runoff modelling approaches. Journal of Hydrology, 147, 1–36. doi:10.1016/0022-1694(93)90073-I
- Chiew, F.H.S. and McMahon, T.A., 1991. Improved modelling of the groundwater processes in HYDROLOG. In: International Hydrology and Water Resources Symposium. 1991 Part 2 (of 3), 2–4 October, Perth, Australia. IE Aust, 492–497.
- Conti, M., Ferrante, M., and Savi, F. A genetic algorithm to calibrate the rainfall–runoff model of Tiber catchment. ASM 2002 IASTED International Conference on Applied Simulation and Modeling, 25-28 June 2002, 2002 Anaheim, CA, USA. ACTA Press, 524–529.
- CSIRO, 2008. Water availability in the Murrumbidgee: a report to the Australian Government from the CSIRO Murray-Darling Basin sustainable yields project, Australia: CSIRO, 155.
- Dakhlaoui, H., Bargaoui, Z., and Bárdossy, A., 2012. Toward a more efficient calibration schema for HBV rainfall–runoff model. Journal of Hydrology, 444–445, 161–179. doi:10.1016/j.jhydrol.2012.04.015
- Duan, Q., Sorooshian, S., and Gupta, V.K., 1994. Optimal use of the SCE-UA global optimization method for calibrating watershed models. Journal of Hydrology, 158, 265–284. doi:10.1016/0022-1694(94)90057-4
- Dye, P.J. and Croke, B.F.W., 2003. Evaluation of streamflow predictions by the IHACRES rainfall–runoff model in two South African catchments. Environmental Modelling & Software, 18, 705–712. doi:10.1016/S1364-8152(03)00072-0
- Gibbs, M.S., Dandy, G.C., and Maier, H.R. Calibration of rainfall runoff models in ungauged catchments: regionalization relationships for a rainfall runoff model. World Environmental and Water Resources Congress 2008: Ahupua’a, May 12, 2008 - May 16, 2008, 2008 Honolulu, HI, USA. American Society of Civil Engineers, Environmental and Water Resources Institute of ASCE.
- Goswami, M. and O’Connor, K.M., 2007. Comparative assessment of six automatic optimization techniques for calibration of a conceptual rainfall–runoff model. Hydrological Sciences Journal, 52, 432–449. doi:10.1623/hysj.52.3.432
- Grayson, R. and Blöschl, G., 2000. Spatial modelling of catchment dynamics. In: R. Grayson and G. Blöschl, eds. Spatial patterns in catchment hydrology: observations and modelling. Cambridge, UK: Cambridge University Press, 51–81.
- Green, D., et al., 2011. Water resources and management overview: murrumbidgee catchment. Sydney: NSW Office of Water.
- Huang, P., et al., 2016. Spatial combination modeling framework of saturation-excess and infiltration-excess runoff for semihumid watersheds. Advances in Meteorology, 2016, 15. doi:10.1155/2016/5173984
- Kay, A.L., et al., 2006. A comparison of three approaches to spatial generalization of rainfall–runoff models. Hydrological Processes, 20, 3953–3973. doi:10.1002/(ISSN)1099-1085
- Kumar, S.V., et al., 2009. Role of subsurface physics in the assimilation of surface soil moisture observations. Journal of Hydrometeorology, 10, 1534–1547. doi:10.1175/2009JHM1134.1
- Latron, J. and Gallart, F., 2008. Runoff generation processes in a small Mediterranean research catchment (Vallcebre, Eastern Pyrenees). Journal of Hydrology, 358, 206–220. doi:10.1016/j.jhydrol.2008.06.014
- Leahy, C., Baddiley, P., and Sooriyakumaran, S., 2008. Comparison of Two Continuous Soil Moisture Accounting Models for Flood Forecasting. International Conference on Water Resources and Environment Research, Engineers Australia, Causal Productions, Modbury, Adelaide, Australia, 341–352.
- Liang, X., et al., 1994. A simple hydrologically based model of land surface water and energy fluxes for general circulation models. Journal of Geophysical Research: Atmospheres, 99, 14415–14428. doi:10.1029/94JD00483
- Lindström, G., 1997. A simple automatic calibration routine for the HBV model. Hydrology Research, 28, 153–168. doi:10.2166/nh.1997.0009
- Massari, C., et al., 2014. Using globally available soil moisture indicators for flood modelling in Mediterranean catchments. Hydrology Earth Systems Sciences, 18, 839–853. doi:10.5194/hess-18-839-2014
- Mathevet, T., 2005. Which rainfall–runoff model at the hourly time-step? Empirical development and intercomparison of rainfall–runoff models on a large sample of watersheds. Thesis (PhD), ENGREF, Paris, France. (in French).
- Meyles, E., et al., 2003. Runoff generation in relation to soil moisture patterns in a small Dartmoor catchment, Southwest England. Hydrological Processes, 17, 251–264. doi:10.1002/(ISSN)1099-1085
- Moore, R.J., 1999. Real-time flood forecasting systems: perspectives and prospects. In: R. Casale and C. Margottini, eds. Floods and landslides: integrated risk assessment. Berlin: Springer Berlin Heidelberg.
- Moore, R.J., 2007. The PDM rainfall–runoff model. Hydrology and Earth System Sciences, 11, 483–499. doi:10.5194/hess-11-483-2007
- Moradkhani, H., et al., 2005. Dual state-parameter estimation of hydrological models using ensemble Kalman filter. Advances in Water Resources, 28, 135–147. doi:10.1016/j.advwatres.2004.09.002
- Nash, J.E. and Sutcliffe, J.V., 1970. River flow forecasting through conceptual models part I — A discussion of principles. Journal of Hydrology, 10, 282–290. doi:10.1016/0022-1694(70)90255-6
- Pagano, T.C., et al., 2010. Continuous rainfall–runoff model comparison and short-term daily streamflow forecast skill evaluation. CSIRO: Water for a Healthy Country National Research Flagship Technical Report.
- Parajka, J., et al., 2006. Assimilating scatterometer soil moisture data into conceptual hydrologic models at the regional scale. Hydrology and Earth System Sciences, 10, 353–368. doi:10.5194/hess-10-353-2006
- Parajka, J., et al., 2009. Matching ERS scatterometer based soil moisture patterns with simulations of a conceptual dual layer hydrologic model over Austria. Hydrology and Earth System Sciences, 13, 259–271. doi:10.5194/hess-13-259-2009
- Pauwels, V.R.N., et al., 2002. Improvement of TOPLATS-based discharge predictions through assimilation of ERS-based remotely sensed soil moisture values. Hydrological Processes, 16, 995–1013. doi:10.1002/hyp.315
- Pechlivanidis, I.G., Mcintyre, N.R., and Wheater, H.S., 2010. Calibration of the semi-distributed PDM rainfall–runoff model in the Upper Lee catchment, UK. Journal of Hydrology, 386, 198–209. doi:10.1016/j.jhydrol.2010.03.022
- Penna, D., et al., 2011. The influence of soil moisture on threshold runoff generation processes in an alpine headwater catchment. Hydrology and Earth System Sciences, 15, 689–702. doi:10.5194/hess-15-689-2011
- Perrin, C., Michel, C., and Andréassian, V., 2001. Does a large number of parameters enhance model performance? Comparative assessment of common catchment model structures on 429 catchments. Journal of Hydrology, 242, 275–301. doi:10.1016/S0022-1694(00)00393-0
- Perrin, C., Michel, C., and Andréassian, V., 2003. Improvement of a parsimonious model for streamflow simulation. Journal of Hydrology, 279, 275–289. doi:10.1016/S0022-1694(03)00225-7
- Puigdefabregas, J., et al., 1998. Differential responses of hillslope and channel elements to rainfall events in a semi-arid area. Geomorphology, 23, 337–351. doi:10.1016/S0169-555X(98)00014-2
- Raupach, M.R., et al., 2009. Australian Water Availability Project (AWAP), CSIRO marine and atmospheric research component: final report for phase 3. CAWCR Technical Report No. 013. Melbourne, Australia: Centre for Australian Weather and Climate Research (Bureau of Meteorology and CSIRO), 67.
- Refsgaard, J.C. and Knudsen, J., 1996. Operational validation and intercomparison of different types of hydrological models. Water Resources Research, 32, 2189–2202. doi:10.1029/96WR00896
- Silvestro, F., et al., 2015. Uncertainty reduction and parameter estimation of a distributed hydrological model with ground and remote-sensing data. Hydrology and Earth System Sciences, 19, 1727–1751. doi:10.5194/hess-19-1727-2015
- Smith, A.B., et al., 2012. The murrumbidgee soil moisture monitoring network data set. Water Resources Research, 48, W07701.
- Sutanudjaja, E.H., et al., 2014. Calibrating a large-extent high-resolution coupled groundwater-land surface model using soil moisture and discharge data. Water Resources Research, 50, 687–705. doi:10.1002/wrcr.v50.1
- Vaze, J., et al., 2010. Rainfall–runoff modelling across southeast Australia: datasets, models and results. Australasian Journal of Water Resources, 14, 101–116. doi:10.1080/13241583.2011.11465379
- Vaze, J., et al., 2011. Conceptual rainfall–runoff model performance with different spatial rainfall inputs. Journal of Hydrometeorology, 12, 1100–1112. doi:10.1175/2011JHM1340.1
- Vrugt, J.A., et al., 2005. Improved treatment of uncertainty in hydrologic modeling: combining the strengths of global optimization and data assimilation. Water Resources Research, 41, 1–17. doi:10.1029/2004WR003059
- Wanders, N., et al., 2014. The benefits of using remotely sensed soil moisture in parameter identification of large-scale hydrological models. Water Resources Research, 50, 6874–6891. doi:10.1002/wrcr.v50.8
- Western, A.W. and Grayson, R.B., 1998. The Tarrawarra Data Set: soil moisture patterns, soil characteristics, and hydrological flux measurements. Water Resources Research, 34, 2765–2768. doi:10.1029/98WR01833
- Wheater, H., Sorooshian, S., and Sharma, K.D., 2007. Hydrological modelling in arid and semi-arid areas, ISBN9780521869188. Cambridge: Cambridge University Press.
- Wooldridge, S.A., Kalma, J.D., and Walker, J.P., 2003. Importance of soil moisture measurements for inferring parameters in hydrologic models of low-yielding ephemeral catchments. Environmental Modelling & Software, 18, 35–48. doi:10.1016/S1364-8152(02)00038-5
- Yew Gan, T., Dlamini, E.M., and Biftu, G.F., 1997. Effects of model complexity and structure, data quality, and objective functions on hydrologic modeling. Journal of Hydrology, 192, 81–103. doi:10.1016/S0022-1694(96)03114-9
- Zakermoshfegh, M., Neyshabouri, S.A.A.S., and Lucas, C., 2008. Automatic calibration of lumped conceptual rainfall–runoff model using particle swarm optimization. Journal of Applied Sciences, 8, 3703–3708.
- Zhang, Y., et al., 2009. Use of remotely sensed actual evapotranspiration to improve rainfall–runoff modeling in Southeast Australia. Journal of Hydrometeorology, 10, 969–980. doi:10.1175/2009JHM1061.1
- Zhang, Y.Q., et al. Incorporating vegetation time series to improve rainfall–runoff model predictions in gauged and ungauged catchments. 19th International Congress on Modelling and Simulation - Sustaining Our Future: Understanding and Living with Uncertainty, MODSIM2011, 12–16 December, 2011 Perth, WA, Australia. Modelling and Simulation Society, 3455–3461.