
 ?Mathematical formulae have been encoded as MathML and are displayed in this HTML version using MathJax in order to improve their display. Uncheck the box to turn MathJax off. This feature requires Javascript. Click on a formula to zoom.
ABSTRACT
Soil infiltration processes were evaluated under field conditions by double-ring infiltrometers with different underlying surfaces in permafrost regions of the Tibetan Plateau. The results show that initial infiltration rates, stable soil infiltration rates and cumulative soil infiltration are strongly dependent on the underlying surface types, with the highest initial and stable soil infiltration rates in the alpine desert steppe, and the lowest in alpine meadow. The effects of soil moisture and texture on infiltration processes were also assessed. Within the same underlying surfaces, the values of infiltration parameters increased with the amount of vegetation cover, while soil moisture and soil infiltration rates displayed opposing trends, with fitting slopes of −0.03 and −0.01 for the initial and stable soil infiltration rates, respectively. The accuracies of the five models in simulating soil infiltration rates and seven models in predicting cumulative infiltration rates were evaluated against data generated from field experiments at four sites. Based on a comparative analysis, the Horton model provided the most complete understanding of the underlying surface effects on soil infiltration processes. Altogether, these findings show that different underlying surfaces can alter soil infiltration processes. This study provides a useful reference for understanding the parameterization of land surface processes for simulating changes in hydrological processes under global warming conditions in the permafrost region on the Tibetan Plateau.
Editor R. Woods Associate editor F. Tauro
1 Introduction
Global warming over the past several decades has significantly altered the water cycle processes and ecological environment on the Tibetan Plateau (Yao et al. Citation2013). The hydrological system on the Tibetan Plateau is very fragile and sensitive (Zhang et al. Citation2004). Soil water infiltration is an important process in surface and subsurface hydrology, and it serves as a key parameter in hydrological process simulations (Fox et al. Citation1997, Xi et al. Citation2008, Bagarello et al. Citation2014). Soil water infiltration also plays an important role in the transformation of precipitation, surface water, soil water content, and groundwater through the atmosphere–soil interface (Li and Fan Citation2006). Soil infiltration performance is directly related to vegetation conditions, water conservation and utilization (Kao and Hunt Citation1996, Argyrokastritis and Kerkides Citation2003, Martinez-Hernandez et al. Citation2017, Rodrigo Comino et al. Citation2017). Further infiltration research is needed to better understand surface runoff, prediction and control of soil erosion, as well as the role of vegetation growth (Li et al. Citation2009, Dohnal et al. Citation2016, Rodrigo Comino et al. Citation2017).
Underlying surfaces can have a considerable influence on soil infiltration processes, as they change soil parameters, which include soil organic matter, physical and chemical properties, and the vegetation root system (Ren Citation2002, Liu et al. Citation2007). With the development of global warming, it is difficult for alpine vegetation to adapt to such an intense climate change environment over the short term, and the occurrence of several degradation phenomena (Zhou and Zhang Citation1995) results in a decline in the alpine grassland water-regulating function and wetland ecological systems (Wang et al. Citation2006). Prior research has focused on surface hydrological processes in alpine systems, water cycles in the permafrost region, and the relationships between permafrost–vegetation–soil moisture coupling and global warming (Ren Citation2013). However, little is known about the soil water infiltration process for different vegetation types in the permafrost region (Li et al. Citation2009). Permafrost degradation changes vegetation coverage, biomass, and the richness of species (Wang et al. Citation2006, Citation2012), and it also leads to changes in the predominant ecosystem type (Wang et al. Citation2006). Thus, soil moisture infiltration characteristics under different vegetation types require examination (Feng et al. Citation2018). Such studies will provide insights into the practical significance of ecological recovery, as well as protection for permafrost regions.
Permafrost on the Tibetan Plateau is highly sensitivity to climate change (Zhao et al. Citation2004, Cheng and Wu Citation2007, Hu et al. Citation2015). As a result of human activity and global climate change, the permafrost temperature has risen, leading to the underground ice melting and an increase in the active layer thickness (Lin et al. Citation2009, Karlsson et al. Citation2012, Wu and Niu Citation2013, Qin et al. Citation2016). The soil infiltration process can vary significantly among different underlying surfaces, particularly in shallow soil (Wang et al. Citation2011b). The Tibetan Plateau is a typical arid and semi-arid region, and the hydrological characteristics are particularly important variables because they strongly influence other hydrological processes, which collectively help in maintaining sufficient water supplies and stability in alpine grassland ecosystems (Wang et al. Citation2006). However, very few studies have investigated soil hydrological process variations in such areas. Therefore, an infiltration model that can accurately predict infiltration is required to estimate runoff generation time and assist with planning for improved vegetation protection and management of water resources (Mirzaee et al. Citation2014). There are several available methods used to compute infiltration processes (Mishra et al. Citation1999, Parhi et al. Citation2007, Wang et al. Citation2014, Di Prima et al. Citation2016, Alagna et al. Citation2018). Soil infiltration process simulations and the effects of different underlying surfaces on soil infiltration processes in the permafrost regions on the Tibetan Plateau require further investigation. The objectives of the present study were to: (i) analyse the effects of different underlying surfaces types on soil infiltration processes; (ii) compare different model simulation results and assess their accuracies in predicting soil infiltration rate and cumulative infiltration; and (iii) determine the applicability of these methods in the permafrost regions on the Tibetan Plateau.
2 Materials and methods
2.1 Study area
The data used here were collected at the Xidatan (XDT), Tedaqiao (QTB06), Wudaoliang (QTB07) and Kekexili (QT01) sites in September 2015 in the permafrost regions on the Tibetan Plateau (). A railway and a highway cross the study area. There are three major alpine vegetation types in the study area, which include alpine meadow (at XDT: AM1 and at QT01: AM2), alpine desert steppe (QTB06: ADS) and alpine steppe (QTB07: AS) (). The dominant plant species is Kobresia pygmaea in the alpine meadow at the XDT and QT01 sites, Carex moorcroftii and Stipa purpurea in the alpine desert steppe at the QTB06 site, and Elymus nutans and Littledalea racemosa in the alpine steppe at the QTB07 site. The main geographical characteristics and soil physical properties at 10–20 cm depth at the four sites are shown in and .
Figure 1. Location of the study sites on the Tibetan Plateau in China.
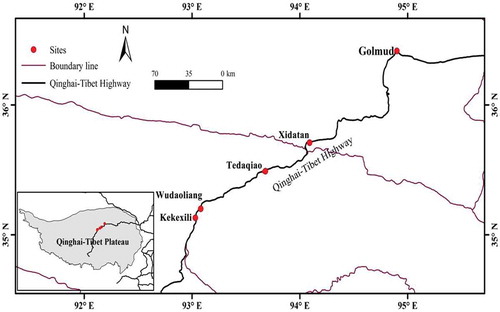
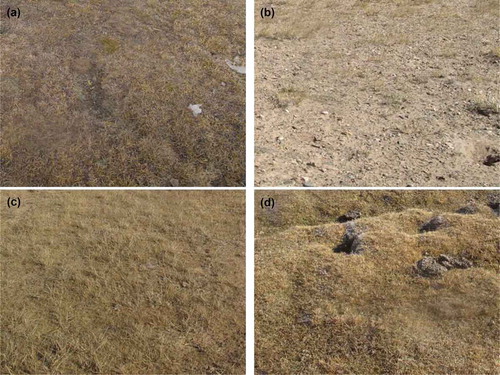
Figure 2. Surface vegetation cover at the four monitoring sites: (a) alpine meadow (XDT: AM1); (b) alpine desert steppe (QTB06: ADS); (c) alpine steppe (QTB07: AS); and (d) alpine meadow (QT01: AM2).
2.2 Methods
2.2.1 Field experiments
In September 2014, samples were obtained from each site at 10–20 cm depth. First, three replicate samples were obtained using a 100-mL metal ring at each depth interval and weighed immediately before being store in aluminium boxes. Second, the antecedent soil moisture content was determined through heating in an oven at 105 ± 2°C. Simultaneously, the collected soil samples were dried and tested to obtain the physical parameters. Then, soil samples were sieved through a 2-mm sieve to homogenize them, and roots and rock fragments were removed to measure soil texture. Soil particle size distributions were analysed with a SEDIMAT 4-12 analyser (Hu et al. Citation2017, Tian et al. Citation2018). The infiltration data for different vegetation characteristics were obtained using the double-ring method, which consists of a measuring cylinder placed concentrically inside a second, open-ended buffer cylinder (Reynolds et al. Citation2002), and device testing was completed using an improved Marriotte tube and circular concentric double rings (Wang et al. Citation2014). The Marriotte tube was 180 cm high with a 25.7 cm inner diameter and an outer ring with a 64.0 cm diameter. The water level in the inner ring was maintained using the Marriott tube, and to ensure one-dimensional flow in the inner ring infiltration, the water level in the outer ring was adjusted manually to match that of the inner ring. The supply water content was measured using a calibration pipe, which hung in the outer ring of the Marriott tube (Wang et al. Citation2014). Infiltration experiments were conducted until the infiltration rate reached a constant value for each underlying surface tested. The required time for each infiltration experiment was 120 min. Since roots were mainly concentrated in the top 0–20 cm of soil, the root biomass in the topsoil (0–10 cm) represented 65.6% of the root biomass in the Tibetan Plateau, which affected the soil infiltration processes (Li et al. Citation2011). In this study, infiltration experiments were conducted in the 10–20 cm soil layer. Prior to measuring the surface soil infiltration processes, we excavated the top 10 cm of soil before installing the infiltrometer.
2.2.2 Soil infiltration rate model
To study the soil infiltration processes and changes over time, researchers have established many infiltration models, such as the Kostiakov model (Kostiakov Citation1932) and the general empirical model (Jiang and Huang Citation1986). In this study, these models are used to simulate the characteristics of soil infiltration processes with different underlying surfaces in the permafrost region on the Tibetan Plateau, as well as to test their applicability and accuracy.
For the Kostiakov model (KM), the infiltration equation general form given by Kostiakov is as follows (Kostiakov Citation1932):
where f(t) is the soil infiltration rate (mm min−1), t is time (min), and a and b are model parameters obtained through test fitting.
The general empirical model (GM), which was developed by Jiang and Huang (Citation1986), is expressed mathematically as:
where a, b and n are model parameters obtained through test fitting, and the other parameters are the same as Equation (1).
The Horton model (HM) was developed by Horton (Citation1941) and the infiltration equation is:
where fc is the stable state value of the infiltration rate, f0 is the initial state value of the infiltration rate, k is the infiltration decay factor, and other parameters are the same as Equation (1).
The Mezencev model (MM) was developed to overcome the limitations of Kostiakov’s equation for a longer time period. Mezencev proposed the following equation to modify Equations (1) and (2), in which infiltration is estimated as (Philip Citation1957, Ravi et al. Citation1998):
where a and b are the test fitting model parameters, and fc is the stable state value of the infiltration rate.
2.2.3 Soil cumulative infiltration model
The Philip model (PH) is an infinite-series solution to solve the nonlinear partial differential Richards equation, which describes transient fluid flow in a porous medium and was developed by Philip (Citation1957). For cumulative infiltration, the general form of the PH model is expressed in powers of the square root of time, as follows:
where S is the sorptivity [L T−1/2] and A is a parameter with dimensions of the saturated hydraulic conductivity [L T−1], which are the model parameters of the test fitting.
The Swartzendruber model (SW) provides a series solution that holds for small, intermediate and large time frames, and was developed by Swartzendruber (Citation1987):
where fc is the final infiltration rate (mm/min), and a, b and c are empirical constants.
The Horton model (HO) is a three-parameter, semi-empirical infiltration model developed by Horton (Citation1940) and is expressed as:
where the parameters c, m and a must be evaluated using observed infiltration data.
The Kostiakov model (KO) is a simple and general form of the infiltration model presented by Kostiakov (Citation1932) and is expressed as:
where and
are constants that are evaluated using the observed infiltration data. The main limitation for using the KO model is that it does not describe the infiltration well with a time increase.
The modified Kostiakov model (MK) was developed by Smith (Citation1972), who modified the original KO model by adding the ultimate infiltration capacity () term, and is expressed as:
where is the final infiltration rate (mm/min), and
and
are the same as
and
in the KO model.
The revised modified Kostiakov model (RMK) was recently developed by Parhi et al. (Citation2007), who revised the MK model and obtained a four-parameter model as follows:
where ,
,
and
are parameters to be empirically determined, using measured infiltration data.
The SCS model is an empirically developed approach to the water infiltration process (Jury et al. Citation1991), which is calculated as follows:
where a and b are constants and are evaluated using the observed infiltration data.
The relationship between the observed and simulated soil infiltration processes was analysed using three statistical parameters, including the correlation coefficient (R2), root mean square error (RMSE) and mean absolute error (MAE), which are expressed as follows:
where S is the number of samples, is the observed value, and y(t) (t = 1, 2, …, S) is the simulated value.
3 Results
3.1 Variations in soil infiltration processes
3.1.1 Variations in soil initial infiltration rates with different underlying surfaces
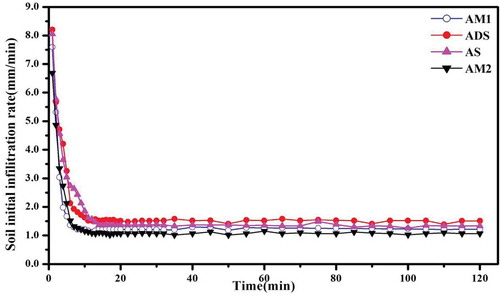
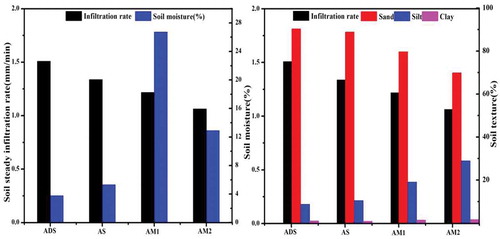
The variations in soil initial infiltration rates for different underlying surfaces are shown in . The lowest soil initial infiltration rate measured is AM2 (6.68 mm/min), and the highest is ADS (8.20 mm/min). The relationship between the soil moisture and initial soil infiltration rate is the same as the soil organic matter except AM1, which is due to the soil texture. The soil initial infiltration rate is affected by the soil texture. The sand content had the largest value at ADS, and the soil initial infiltration rate is also the largest at ADS. In contrast, the sand content is the lowest at AM2, and the soil initial infiltration rate is also at the minimum value at AM2 (). The initial infiltration rate, stable infiltration rate, time required to reach stable state, and shape of the infiltration process curve vary with the different underlying surfaces, which are shown in . The soil infiltration rates decline sharply in the first 7 min at AM1, and then they decline slowly from 8 to 13 min, and plateau after 13 min. The curve for AM2 displays a similar trend, whereas at ADS and AS, the initial soil infiltration rates are relatively less variable. The results indicate that there is a significant difference between soils with different underlying surfaces.
Figure 3. Variation of soil initial infiltration rate, and soil moisture and soil texture for different underlying surfaces: alpine meadow (AM1: XDT and AM2: QT01) alpine desert steppe (ADS: QTB06) and alpine steppe (AS: QTB07).
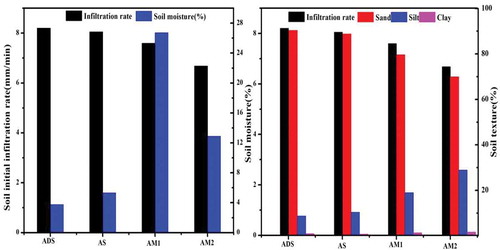
Figure 4. Soil initial infiltration processes for different underlying surfaces: alpine meadow (AM1: XDT and AM2: QT01), alpine desert steppe (ADS: QTB06) and alpine steppe (AS: QTB07).
3.1.2 Variations in stable soil infiltration rates with different underlying surfaces
As shown in , the stable soil infiltration rates range from 1.10 to 1.60 mm/min, reach a minimum value of 1.06 mm/min at AM2 and a maximum value of 1.51 mm/min at ADS, and a value of 1.34 mm/min at AS, which indicates that the soil infiltration rates at AS are larger than those at AM1 and AM2. The soil moisture characteristics and stable soil infiltration rate are the same as the soil initial infiltration rate, the soil moisture is smaller and the soil stable infiltration rate is larger. The soil stable infiltration rate is also influenced by the soil texture of different underlying surfaces. The soil textural differences result in different soil stable infiltration rates, such as AM1 and AM2, which have the same vegetation type, but the soil stable infiltration rate at AM1 is larger than at AM2.
Figure 5. Variation of soil steady infiltration rate, and soil moisture and soil texture for different underlying surfaces: alpine meadow (AM1: XDT and AM2: QT01), alpine desert steppe (ADS: QTB06) and alpine steppe (AS: QTB07).
3.1.3 Variations in cumulative soil infiltration with different underlying surfaces
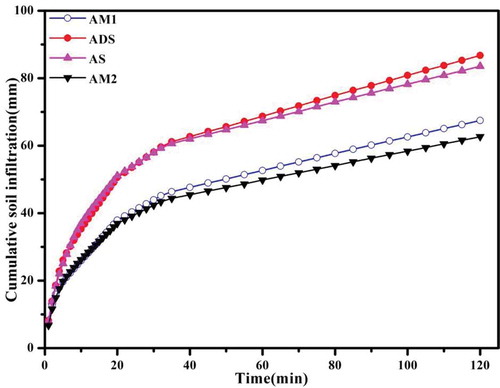
The cumulative soil infiltration is measured after 120 min and the results show significant differences between the sites, with values ranging from 62.65 to 86.75 mm (). The soil cumulative infiltration rate gradually increases at 10 cm, increases rapidly at first and then gradually after 20 min. The soil cumulative infiltration is the lowest at AM2 and the largest at ADS, which is similar to the stable soil infiltration rates. The soil cumulative infiltration values are fairly similar at both AM2 and AM1, as well as ADS and AS. These results also indicate that the cumulative soil infiltration rate is influenced by different underlying surfaces.
Figure 6. Variation of cumulative soil infiltration for different underlying surfaces: alpine meadow (AM1: XDT and AM2: QT01), alpine desert steppe (ADS: QTB06) and alpine steppe (AS: QTB07).
3.2 Analysis simulations of soil infiltration processes
3.2.1 Simulation of the soil infiltration rate
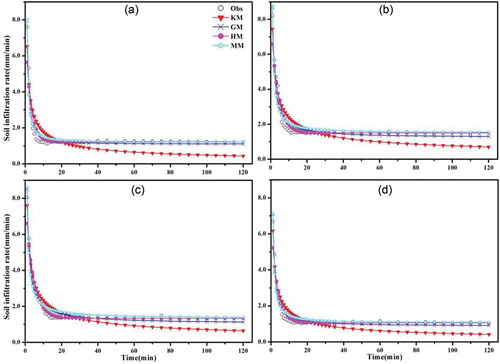
Soil infiltration rates were simulated using the models KM, GM, HM and MM (Section 2.2.2) ( and ). To evaluate the effects of different models on soil infiltration processes with different underlying surfaces, a statistical analysis using the determination coefficient (R2) of regression, RMSE and MAE was performed and the results are presented in . The results show that the Horton model (HM) accurately simulates the initial soil infiltration and stable soil processes at all sites except AM1. Overall, the HM can be used to accurately simulate initial soil infiltration rate and stable infiltration rate, with average R2, RMSE and MAE values of 0.957, 0.305 mm/min, and 0.137 mm/min, respectively, at all four sites. The general empirical model (GM) also provides accurate results, with average R2, RMSE and MAE values of 0.947, 0.276 mm/min, and 0.205 mm/min, respectively. The Mezencev model (MM) slightly overestimates the initial soil infiltration rate, whereas the Kostiakov model (KM) overestimates the initial soil infiltration rate, and both models underestimate and overestimate the stable soil infiltration rates at all sites. Overall, the HM generates the most accurate predictions of soil infiltration processes with different underlying surfaces in permafrost regions of the Tibetan Plateau. The results simulated by the GM are the most acceptable of all models.
Table 1. Geographical characteristic of the four monitoring sites.
Table 2. Soil physical properties of the four monitoring sites.
Table 3. Soil infiltration rate model parameters of the four monitoring sites.
Table 4. Performance of different models for fitted soil infiltration rate against the observations at different sites. R2: standard error of the estimate; RMSE: root mean square error; MAE: mean absolute error. KM: Kostiakov model; GM: general empirical model; HM: Horton model; and MM: Mezencev model.
Figure 7. Comparison between measured and fitted soil infiltration rate for different underlying surfaces: (a) alpine meadow (AM1: XDT); (b) alpine desert steppe (ADS: QTB06); (c) alpine steppe (AS: QTB07); and (d) alpine meadow (AM2: QT01). KM: Kostiakov model, GM: General empirical model, HM: Horton model, MM: Mezencev model.
3.2.2 Simulation of cumulative infiltration
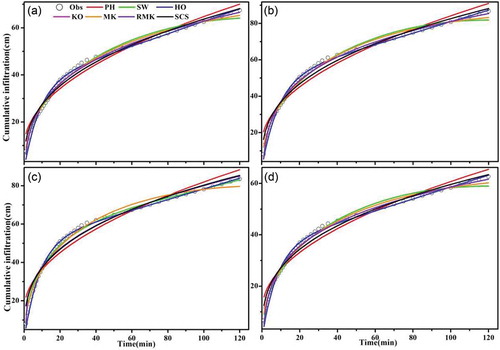
The statistical parameters for the cumulative infiltration models are presented in . According to the R2, RMSE and MAE, the HO and MK models most accurately describe the cumulative infiltration, whereas the SW, RMK, KO and SCS models are less accurate. Altogether, these findings indicate that the infiltration is best described by the HO model for different vegetation types on the Tibetan Plateau. The simulated cumulative infiltration results are compared with the measured data for each site (). The R2, RMSE and MAE are in the ranges 0.939–0.998, 1.046–4.848 mm/min, and 0.75–4.012 mm/min, respectively, among all soils and models ( and ). The cumulative infiltration is well described by the HO model (average R2, RMSE and MAE: 0.996, 1.418 mm/min and 1.009 mm/min, respectively). The highest R2 values are associated with the MK, RMK and SW models. The simulation results from the MK model are close to those of the HO model (average R2, RMSE and MAE: 0.993, 1.644 mm/min and 1.384 mm/min, respectively). The results of the RMK and SW models are basically consistent. The results from the KO and SCS models are similar (average R2, RMSE and MAE: 0.981, 2.712 mm/min and 2.760 mm/min, and 0.982, 2.223 mm/min and 2.257 mm/min, respectively). The PH model yields the lowest mean R2 of 0.956, and the largest RMSE and MAE values of 4.025 mm/min and 3.315 mm/min, respectively.
Table 5. Performance of different models for fitted soil cumulative infiltration against the observations at different sites. PH: Philip model; SW: Swartzendruber model; HO: Horton model; KO: Kostiakov model; MK: modified Kostiakov model; RMK: revised MK model; SCS: SCS model.
Figure 8. Comparison between the measured and fitted soil cumulative infiltration under underlying surfaces: (a) alpine meadow (AM1: XDT); (b) alpine desert steppe (ADS: QTB06); (c) alpine steppe (AS: QTB07); and (d) alpine meadow (AM2: QT01). PH: Philip model, SW: Swartzendruber model, HO: Horton model, KO: Kostiakov model, MK: modified Kostiakov model, RMK: Revised MK model, SCS: SCS model.
4 Discussion
In this study, the results indicate that the soil moisture and texture impact on soil initial infiltration rates, stable soil infiltration rates and cumulative soil infiltration processes at the AM1, ADS, AS and AM2 sites in the permafrost region on the Tibetan Plateau. The results indicate that the soil sand content gradually increases from the alpine meadow to alpine desert steppe and, simultaneously, the infiltration rate also increases gradually, due to the high permeability of the sand soil at ADS and AS and smaller soil infiltration capacity of loamy soil at AM2 (Wang et al. Citation2014), which is in contrast to the soil moisture. In addition, the main plant roots of the higher vegetation coverage areas were mainly concentrated in the 0–20-cm layer and showed a slight disturbance of the soil structure with different underlying surfaces and soil organic matter, which is mainly distributed in shallow soil (Li et al. Citation2011). Higher vegetation coverage and plant diversity enhance the diversity of plant root types, and thus the stability of the soil structure is increased (Pohl et al. Citation2009, Cerda et al. Citation2018a, Citation2018b). Meanwhile, roots were fairly small in size below a soil depth of 10 cm, and the roots acted to promote the inhibitory action of the topsoil; thus, the stable soil infiltration rates gradually declined from the alpine desert steppe to the alpine meadow. The influence of roots lowered the soil hydraulic conductivity, and the variation in stable soil infiltration rates was determined by the properties of the soil types and roots (Wang et al. Citation2014).
Soil infiltration capacity was also controlled by the soil texture in different regions (Mirzaee et al. Citation2014, Ren et al. Citation2016). The soil initial infiltration rates, stable soil infiltration rates and cumulative soil infiltration were the largest for the sand soil at ADS and AS, followed by the loamy sand soil at AM1, and sandy loam soil at AM2. The soil texture affected the soil water movement and hydraulic conductivity by acting on the surface energy of the soil particles, as well as the size and distribution of the soil pores and other factors (Xi et al. Citation2008, Wang et al. Citation2014). Snow deposition is uneven, and the snow is likely to sublimate, redistribute and partly influence the mass and spatial distribution of snow storage available for infiltration, as well as the spatial distribution of depths and permeability of the soil (Cuo et al. Citation2013, Lundberg et al. Citation2016). Of particular importance is the melt season, which is when snowmelt and evaporation occur simultaneously; however, this occurs in different parts of the region. The presence of permafrost increases the complexities of land surface hydrological processes through its effects on hydrology, such as contrasting thermal and water regimes in the permafrost region on the Tibetan Plateau (Zhang et al. Citation2003). The soil infiltration processes are also influenced by others factors, such as the physical and chemical properties of soil (Zeng et al. Citation2013), root gravimetric density (Mahe et al. Citation2005, Liu et al. Citation2013), freeze–thaw processes (Hu et al. Citation2015, Huang et al. Citation2016) and a thermokarst lake (Wang et al. Citation2014). In addition, a number of other factors can affect the results when measuring infiltration, such as the systematic error due to the lateral divergence of the flow below the infiltrometer (Soil Survey Staff Citation2009). Otherwise, when soil loses vegetation cover protection, the intensity of water erosion, freeze–thaw stress, and wind increases, which thus undermines the stability of the ecosystem (Wang et al. Citation2011b), in turn affecting the change of soil characteristics in the permafrost regions on the Tibetan Plateau. Therefore, soil hydrological properties often vary in time and space.
The results of the soil infiltration rate models indicate that the HM and GM models were the most acceptable compared to the other models, and the HM model obtained the best results. Prior research has shown that the HM model is specifically adept at generating more accurate results compared to other models for the effects of soil infiltration processes in cold alpine meadows (Wang et al. Citation2014). Based on the results of the cumulative infiltration statistics given in , the Horton model gave the best results, with a higher R2 value and lower RMSE and MAE values, and the PH model obtained the worst results among all models. These modelling results are consistent with the findings of Dashtaki et al. (Citation2009) that the Horton model performed better than the Kostiakov and Philip models. However, their results also revealed that the RMK model showed a better performance than the MK and Kostiakov models (Parhi et al. Citation2007, Mirzaee et al. Citation2014), which is inconsistent with the results of the current study. Different models provided different simulation results, because the soil infiltration processes are strongly influenced by precipitation, different cover conditions, soil properties, and other factors. These models are also complicated by hydrological processes coupled with a multi-factor effect in the permafrost region on the Tibetan Plateau (Wang et al. Citation2011b).
The changes in vegetation cover had a great influence on the water cycle processes with different underlying surfaces, and the thermal and hydraulic properties of the active layer in the permafrost region (Wang et al. Citation2012). Vegetation has a relatively high albedo and capacity for water retention and may have considerable impacts on heat–moisture regimes in permafrost (Chang et al. Citation2012). As the vegetation cover decreases, the soil water circulation in the active layer increases, which results in an enhanced response to water temperature across the soil profile (Wang et al. Citation2006). Meanwhile, the response of the labile soil organic matter fractions in these high-altitude permafrost soils to climate change has also been shown to depend strongly on underlying surfaces, as well as soil moisture and temperature (Shang et al. Citation2016). Soil infiltration processes control vegetation growth in the permafrost region and influence soil moisture and groundwater, as well as the interflow transformation and underground runoff (Wang et al. Citation2010). There is an interdependent relationship between vegetation and permafrost, and the synergic effects of climate change and permafrost variations are the major drivers of vegetation degradation on the Qinghai-Tibet Plateau (Wang et al. 2011, Chang et al. Citation2012). Under different temperature rise scenarios, ecosystems will change. For example, the alpine meadow ecosystems located in the low mountain and plain areas will likely undergo significant degradation over the next 50 years (Wang et al. Citation2006). The degradation of vegetation is likely to have a significant impact on hydrological and permafrost characteristics (Wang et al. Citation2010). This study provides insights into the effects of underlying surfaces on infiltration processes and expands the understanding of soil moisture movement through different vegetation covers in the permafrost regions on the Tibetan Plateau, as well as the variations in the hydrological processes related to global warming and changes in ecosystem environments.
5 Conclusions
The soil infiltration process characteristics under different underlying surfaces and the accuracies of different infiltration models were comprehensively evaluated in the permafrost region on the Tibetan Plateau. The initial and stable soil infiltration rate was mainly controlled by vegetation type, vegetation cover and soil parameters. The soil infiltration rates of AM1 were similar to those of AM2. The initial soil infiltration rates, stable soil infiltration rates, and cumulative soil infiltration of ADS were larger than those of AS. The results show that the infiltration processes of different underlying surfaces are different because of the variations in vegetation type, soil texture and soil moisture. Several soil infiltration models were evaluated against the field data for different underlying surfaces. Together, the results of this study indicate that the Horton model generated the most accurate results. This study provides a useful tool for understanding the variation in hydrological processes among the different underlying surfaces in the permafrost regions on the Tibetan Plateau. Further studies are needed to explore the hydraulic parameters, such as hydraulic conductivity, for different underlying surfaces in permafrost regions.
Disclosure statement
No potential conflict of interest was reported by the authors.
Additional information
Funding
References
- Alagna, V., et al., 2018. The Impact of the age of vines on soil hydraulic conductivity in vineyards in Eastern Spain. Water, 10 (1), 1–11.
- Argyrokastritis, I. and Kerkides, P., 2003. A note to the variable sorptivity infiltration equation. Water Resources Management, 17 (2), 133–145. doi:10.1023/A:1023663223269.
- Bagarello, V., et al., 2014. Soil hydraulic properties determined by infiltration experiments and different heights of water pouring. Geoderma, 213, 492–501. doi:10.1016/j.geoderma.2013.08.032.
- Cerda, A., et al., 2018a. Hydrological and erosional impact and farmer’s perception on catch crops and weeds in citrus organic farming in Canyoles river watershed, Eastern Spain. Agriculture Ecosystems & Environment, 258, 49–58. doi:10.1016/j.agee.2018.02.015.
- Cerda, A., et al., 2018b. Long-term impact of rainfed agricultural land abandonment on soil erosion in the Western Mediterranean basin. Progress in Physical Geography, 42 (2), 202–219. doi:10.1177/0309133318758521.
- Chang, X.L., et al., 2012. Influences of vegetation on permafrost: a review. Acta Ecologica Sinica, 32 (24), 7981–7990. doi:10.5846/stxb201202120181.
- Cheng, G.D. and Wu, T.H., 2007. Responses of permafrost to climate change and their environmental significance, Qinghai-Tibet Plateau. Journal of Geophysical Research-Earth Surface, 112 (F2), 1–10. doi:10.1029/2006JF000631.
- Cuo, L., et al., 2013. The impacts of climate change and land cover/use transition on the hydrology in the upper yellow river basin, China. Journal of Hydrology, 502, 37–52. doi:10.1016/j.jhydrol.2013.08.003.
- Dashtaki, S.G., et al., 2009. Site-dependence performance of infiltration models. Water Resources Management, 23 (13), 2777–2790. doi:10.1007/s11269-009-9408-3.
- Di Prima, S., et al., 2016. Testing a new automated single ring infiltrometer for Beerkan infiltration experiments. Geoderma, 262, 20–34. doi:10.1016/j.geoderma.2015.08.006.
- Dohnal, M., et al., 2016. Interpretation of ponded infiltration data using numerical experiments. Journal of Hydrology and Hydromechanics, 64 (3), 289–299. doi:10.1515/johh-2016-0020.
- Feng, T.J., et al., 2018. Assessment of the impact of different vegetation patterns on soil erosion processes on semiarid loess slopes. Earth Surface Processes and Landforms, in press. doi:10.1002/esp.4361.
- Fox, D.M., Bryan, R.B., and Price, A.G., 1997. The influence of slope angle on final infiltration rate for interrill conditions. Geoderma, 80 (1–2), 181–194. doi:10.1016/S0016-7061(97)00075-X.
- Horton, R.E., 1940. Approach toward a physical interpretation of infiltration capacity. Soil Science Society of America Journal, 5, 339–417. doi:10.2136/sssaj1941.036159950005000C0075x.
- Horton, R.E., 1941. An approach toward a physical interpretation of infiltration-capacity. Soil Science Society of America Journal, 5 (C), 399–417. doi:10.2136/sssaj1941.036159950005000C0075x.
- Hu, G.J., et al., 2015. Modeling permafrost properties in the Qinghai-Xizang (Tibet) Plateau. Science China Earth Sciences, 58 (12), 2309–2326. doi:10.1007/s11430-015-5197-0.
- Hu, G.J., et al., 2017. Comparison of the thermal conductivity parameterizations for a freeze-thaw algorithm with a multi-layered soil in permafrost regions. Catena, 156, 244–251. doi:10.1016/j.catena.2017.04.011.
- Huang, M., et al., 2016. Characterizing the spatial variability of the hydraulic conductivity of reclamation soils using air permeability. Geoderma, 262, 285–293. doi:10.1016/j.geoderma.2015.08.014.
- Jiang, D.S. and Huang, G.J., 1986. Study on the filtration rate of soils on the loess plateau of China. Acta Pedofil. Sinica, 23, 299–304.
- Jury, W.A., Gardner, W.R., and Gardner, W.H. 1991. Soil physics. 5th ed. New York: John Wiley & Sons.
- Kao, C.S. and Hunt, J.R., 1996. Prediction of Wetting Front Movement During One‐Dimensional Infiltration into Soils. Water Resources Research, 32 (1), 55–64. doi:10.1029/95WR02974.
- Karlsson, J.M., Lyon, S.W., and Destouni, G., 2012. Thermokarst lake, hydrological flow and water balance indicators of permafrost change in Western Siberia. Journal of Hydrology, 464, 459–466. doi:10.1016/j.jhydrol.2012.07.037.
- Kostiakov, A.N., 1932. On the dynamics of the coefficient of water-percolation in soils and on the necessity for studying it from a dynamic point of view for purposes of amelioration. Trans, 6, 17–21.
- Li, C.J., et al., 2009. Infiltration Characteristics and Its Environmental Factors in the Fenghuoshan Basin. Bulletin of Soil and Water Conservation, 29 (6), 16–19.
- Li, X.J., et al., 2011. Root biomass distribution in alpine ecosystems of the northern Tibetan Plateau. Environmental Earth Sciences, 64 (7), 1911–1919. doi:10.1007/s12665-011-1004-1.
- Li, X.Z. and Fan, G.S., 2006. Influence of organic matter content on infiltration capacity and parameter in field soils. Nongye Gongcheng Xuebao(Transactions of the Chinese Society of Agricultural Engineering), 22 (3), 188–190.
- Lin, Z.J., et al., 2009. The effect of embankment construction on permafrost in the Tibetan Plateau. Journal of Glaciology and Geocryology, 31 (6), 1127–1136.
- Liu, D.P., et al., 2007. Soil infiltration characteristics under main vegetation types in Anji County of Zhejiang Province. Chinese Journal of Applied Ecology, 18 (3), 493–498.
- Liu, H., Zhao, W., and He, Z., 2013. Self-organized vegetation patterning effects on surface soil hydraulic conductivity: a case study in the Qilian Mountains, China. Geoderma, 192, 362–367. doi:10.1016/j.geoderma.2012.08.008.
- Lundberg, A., et al., 2016. Snow and frost: implications for spatiotemporal infiltration patterns - a review. Hydrological Processes, 30 (8), 1230–1250. doi:10.1002/hyp.10703.
- Mahe, G., et al., 2005. The impact of land use change on soil water holding capacity and river flow modelling in the Nakambe River, Burkina-Faso. Journal of Hydrology, 300 (1–4), 33–43. doi:10.1016/j.jhydrol.2004.04.028.
- Martinez-Hernandez, C., Rodrigo-Comino, J., and Romero-Diaz, A., 2017. Impact of lithology and soil properties on abandoned dryland terraces during the early stages of soil erosion by water in south-east Spain. Hydrological Processes, 31 (17), 3095–3109. doi:10.1002/hyp.11251.
- Mirzaee, S., et al., 2014. Evaluation of infiltration models with different numbers of fitting parameters in different soil texture classes. Archives of Agronomy and Soil Science, 60 (5), 681–693. doi:10.1080/03650340.2013.823477.
- Mishra, S.K., Kumar, S.R., and Singh, V.P., 1999. Calibration and validation of a general infiltration model. Hydrological Processes, 13 (11), 1691–1718. doi:10.1002/(ISSN)1099-1085.
- Parhi, P.K., Mishra, S., and Singh, R., 2007. A modification to kostiakov and modified kostiakov infiltration models. Water Resources Management, 21 (11), 1973–1989. doi:10.1007/s11269-006-9140-1.
- Philip, J.R., 1957. The theory of infiltration: 4. Sorptivity and algebraic infiltration equations. Soil Science, 84, 257–264. doi:10.1097/00010694-195709000-00010.
- Pohl, M., et al., 2009. Higher plant diversity enhances soil stability in disturbed alpine ecosystems. Plant and Soil, 324 (1–2), 91–102. doi:10.1007/s11104-009-9906-3.
- Qin, Y.H., et al., 2016. Using ERA-Interim reanalysis dataset to assess the changes of ground surface freezing and thawing condition on the Qinghai-Tibet Plateau. Environmental Earth Sciences, 75 (9), 1–13. doi:10.1007/s12665-016-5633-2.
- Ravi, V., Williams, J.R., and Ouyang, Y., 1998. Estimation of infiltration rate in the vadose zone: compilation of simple mathematical models. Technical Report. Washington, DC: USEPA. EPA/600/R-97-128a.
- Ren, G., 2002. Permeability of soils under different forest vegetation in Eastern Liaoning Mountain Region. Rural Eco-Environment, 18 (4), 1–4.
- Ren, J.W., 2013. Updating assessment results of global cryospheric change from SPM of IPCC WGI Fifth Assessment Report. Journal of Glaciology and Geocryology, 35 (5), 1065–1067.
- Ren, Z.P., et al., 2016. Soil hydraulic conductivity as affected by vegetation restoration age on the Loess Plateau, China. Journal of Arid Land, 8 (4), 546–555. doi:10.1007/s40333-016-0010-2.
- Reynolds, W., Elrick, D., and Youngs, E., 2002. Ring or cylinder infiltrometers (vadose zone). Methods of Soil Analysis. Part, 4, 818–826.
- Rodrigo Comino, J., et al., 2017. The impact of vineyard abandonment on soil properties and hydrological processes. Vadose Zone Journal, 16 (12), 2–7.
- Shang, W., et al., 2016. Seasonal variations in labile soil organic matter fractions in permafrost soils with different vegetation types in the central Qinghai-Tibet Plateau. Catena, 137, 670–678. doi:10.1016/j.catena.2015.07.012.
- Smith, R.E., 1972. The infiltration envelope: results from a theoretical infiltrometer. Journal of Hydrology, 17, 1–21. doi:10.1016/0022-1694(72)90063-7.
- Soil Survey Staff. 2009. Soil Survey Field and Laboratory Methods Manual, Soil Survey Investigations Report No. 51, Version 1.0. (ed Burt R). U.S. Department of Agriculture, Natural Resources Conservation Service, Lincoln, Nebraska.
- Swartzendruber, D. 1987. A quasi-solution of Richards equation for the downward infiltration of water into soil. Water Resources Research, 23, 809–817. doi:10.1029/WR023i005p00809.
- Tian, L.M., et al., 2018. Soil moisture and texture primarily control the soil nutrient stoichiometry across the Tibetan grassland. The Science of the Total Environment, 622-623, 192–202. doi:10.1016/j.scitotenv.2017.11.331.
- Wang, G.X., et al., 2006. Impacts of permafrost changes on alpine ecosystem in Qinghai-Tibet Plateau. Science in China Series D-Earth Sciences, 49 (11), 1156–1169. doi:10.1007/s11430-006-1156-0.
- Wang, G.X., et al., 2006. Synergistic effect of vegetation and air temperature changes on soil water content in alpine frost meadow soil in the permafrost region of Qinghai-Tibet. Hydrological Processes, 22 (17), 3310–3320. doi:10.1002/hyp.6913.
- Wang, G.X., et al., 2011a. Climate changes and its impact on tundra ecosystem in Qinghai-Tibet Plateau, China. Climatic Change, 106 (3), 463–482. doi:10.1007/s10584-010-9952-0.
- Wang, G.X., Liu, G.S., and Li, C.J., 2012. Effects of changes in alpine grassland vegetation cover on hillslope hydrological processes in a permafrost watershed. Journal of Hydrology, 444, 22–33.
- Wang, Y.B., et al., 2010. The impact of vegetation degeneration on hydrology features of alpine soil. Journal of Glaciology and Geocryology, 32 (5), 989–998.
- Wang, Y.B., et al., 2011b. Study on the impact of vegetation degeneration to hydrology characteristic of the Alpine soil. Sciences Cold Arid Reg, 3, 0233–0242.
- Wang, Y.B., et al., 2014. Effect of a thermokarst lake on soil physical properties and infiltration processes in the permafrost region of the Qinghai-Tibet Plateau, China. Science China Earth Sciences, 57 (10), 2357–2365. doi:10.1007/s11430-014-4906-4.
- Wu, Q.B. and Niu, F.J., 2013. Permafrost changes and engineering stability in Qinghai-Xizang Plateau. Chinese Science Bulletin, 58 (10), 1079–1094. doi:10.1007/s11434-012-5587-z.
- Xi, H.Y., et al., 2008. Permeability characteristics of soils and their dependence on soil conditions in Ejina Oasis. Journal of Glaciology and Geocryology, 30 (6), 976–982.
- Yao, T.D., et al., 2013. Cryospheric changes and their impacts on regional water cycle and ecological conditions in the Qinghai-Tibetan Plateau. Chinese Journal Natural, 35 (3), 179–186.
- Zeng, C., et al., 2013. Impact of alpine meadow degradation on soil hydraulic properties over the Qinghai-Tibetan Plateau. Journal of Hydrology, 478, 148–156. doi:10.1016/j.jhydrol.2012.11.058.
- Zhang, S.F., et al., 2004. Study on the changes of water cycle and its impacts in the source region of the Yellow River. Science in China Series E: Technological Sciences, 47 (1), 142–151. doi:10.1360/04ez0012.
- Zhang, Y.S., Ohata, T., and Kadota, T., 2003. Land-surface hydrological processes in the permafrost region of the eastern Tibetan Plateau. Journal of Hydrology, 283 (1–4), 41–56. doi:10.1016/S0022-1694(03)00240-3.
- Zhao, L., et al., 2004. Changes of climate and seasonally frozen ground over the past 30 years in Qinghai–xizang (Tibetan) Plateau, China. Global and Planetary Change, 43 (1–2), 19–31. doi:10.1016/j.gloplacha.2004.02.003.
- Zhou, G.S. and Zhang, X.S., 1995. Study on climate-vegetation classification for global change in China. Acta Botanica Sinica, 38 (1), 8–17.