
 ?Mathematical formulae have been encoded as MathML and are displayed in this HTML version using MathJax in order to improve their display. Uncheck the box to turn MathJax off. This feature requires Javascript. Click on a formula to zoom.
ABSTRACT
Guidelines for the design of infiltration trenches of rectangular cross-section are compared. Four concepts of infiltration into a native soil from linear soakaways of rectangular cross-section are discussed. The results of calculations using analytical equations are compared with numerical two-dimensional (2D) simulations using HYDRUS computer code and field measurements. Satisfactory agreement is achieved for Kozeny’s concept of infiltration and the free-surface approach, applied to a trench in a highly saturated sandy loam. Theoretical solutions, neglecting matric potential, suggest that the mean infiltration rate along the wetted perimeter of a rectangular trench varies in the range 1.0 to 1.5 of the value of saturated hydraulic conductivity.
Editor R. Woods Associate editor E. Rozos
1 Introduction
Rectangular infiltration trenches are commonly used for disposal of storm water and treated effluent from small wastewater treatment plants. They are filled with crushed stone (rock) material to stabilize their walls and sometimes have a perforated pipe for delivering water to the full trench length. Recently, plastic infiltration boxes of high porosity (ε = 0.92–0.96) have been used instead of natural filling media. Infiltration trenches are elements of green infrastructure, including the aspect known as low-impact development controls of storm water, which is increasingly popular due to the growing awareness by designers and society of extreme phenomena, intensified recently by climate change. The trenches suppress quick surface runoff, improve quality of the infiltrated water, and increase groundwater levels (Shamseldin Citation2010, ARC Citation2016). It has been found that such systems can not only be more sustainable and environmentally friendly than traditional urban drainage but also constructed and exploited at lower cost (Argue Citation2013). A crucial role when designing infiltration systems is played by hydraulic design, utilizing hydrological input data. A general review of design guidelines for storm water management in selected countries is provided in Scholes and Revitt (Citation2008).
The problem of water balance for infiltration trenches or swales is not new, but there are still many sources of uncertainty during its theoretical and practical solution (Nieć and Spychała Citation2014). The most uncertain parameter is the native soil infiltration rate, both within a given soakaway and in its catchment. The rate depends on many factors, mainly the soil texture and its saturation. Nagy et al. (Citation2013) confirmed the well-known fact that the saturated hydraulic conductivity of fine-grained soils could vary by 2–3 orders of magnitude. Various methodologies have been developed to measure the saturated hydraulic conductivity of soil, but none is perfect; probably the best are field testing methods. It is good practice to conduct a field test by excavating a trial pit of sufficient size to represent a section of the designed soakaway (BRE Citation2003). For estimation of surface infiltration in a catchment an adapted double-ring infiltrometer can be used (Ruggenthaler et al. Citation2016).
The complexity of the problem of estimation of water balance elements is related to the randomness of input data (rainfall), surface runoff, infiltration into saturated and unsaturated soils, changes in soil properties with time (e.g. due to clogging), the influence of groundwater level and subsurface runoff, etc. A problem that is rarely encountered in other hydrological studies involves the infiltration rate distribution along the wetted infiltration area, which is crucial for estimation of the filling and emptying time of soakaways.
From the hydraulic point of view the problem seems to be simpler, as it is limited to infiltration and seepage. The first practical and theoretical solutions were developed for estimation of seepage losses from channels in permeable soils (Vedernikov Citation1934).
The purpose of this paper is to discuss infiltration concepts, and compare existing and our own analytical solutions of the water balance equations for infiltration trenches with a numerical model and empirical data.
2 Previous studies and design guidelines
There are many design guidelines for infiltration trenches depending on their purpose. Cederwall and Eriksson (Citation1977) developed a rain-envelope method, which was later introduced into various design guidelines of soakaways for storm water retention and disposal. It is a graphical method based on drawing cumulative rain curves, corresponding to different return periods; the discharge volume delivered to a soakaway is a linear function of the time from the rain commencement, if the rainfall intensity is assumed to be constant. The required volume of the storage can then be determined as the maximum volume difference between the cumulative rain curve and the cumulative infiltration line. According to the German guidelines DWA-A 138E (DWA (Deutsche Vereinigung für Wasserwirtschaft, Abwasser und Abfall Citation2005), the equation of water volume balance over rainfall duration can be expressed in the form:
where V is storage volume in a soakaway (trench or swale) (m3); Vin and Vout are inflow and outflow water volumes (m3); Fs is a surcharge factor (Fs = 1.1–1.2 depending on the degree of risk); dr is rainfall duration (min); i is rainfall intensity (dm3 s−1 ha−1); Aimp is catchment area reduced to an impervious area (m2); As is percolation (infiltration) surface area (m2); and Kns denotes the coefficient of unsaturated hydraulic conductivity (m s−1).
Equation (1) is recommended for small catchments (Aimp < 15As), so time of concentration can be ignored. For the sake of simplicity, in the DWA guidelines (DWA Citation2005) Kns = 0.5Ks; such an arbitrary assumption ignores an enhanced total head gradient (Iz ≫ 1) in unsaturated soils. However, pebbles or large grains of gravel may also reduce the area of infiltration to a finer native soil (Radcliffe et al. Citation2005). For dimensioning purposes the relevant design rainfall duration dr is initially unknown. The DWA recommends repeating the solution of the water balance in Equation (1) for several storms to find the maximum storage volume Vmax.
The British guidelines for design of soakaways (BRE (Building Research Establishment) Citation2003) recommend calculating the storage volume V = Vmax similarly for a range of durations of 10-year design storms. Soil infiltration rate, determined by use of a trial pit in the field and the falling head permeability test, is taken instead of Kns. Due to clogging, the bottom area is excluded from the infiltration area As. Comparison of the German and British guidelines is presented in .
Table 1. Comparison of design criteria for infiltration trenches of rectangular cross-section. hmax: maximum water depth, H: separation between trench bottom and GW level.
The majority of empirical intensity–duration–frequency relationships for a specific return period can be expressed in the form (Koutsoyiannis et al. Citation1998):
where i is rainfall intensity [L T−1]; dr is rainfall duration [T]; ω is a coefficient dependent on rainfall frequency or return period; and ν, τ and η are constants.
A comprehensive review of design guidelines on soakaways is provided by Watkins (Citation1991), who distinguished three main design procedures and four different conceptual models of soakaway hydraulics. Design procedures were divided into the following types:
(a) specification of the soakaway volume required to store all the rainwater from a specific storm event, neglecting infiltration rate;
(b) conduction of a soakage (percolation) test to determine hydraulic conductivity and the required infiltration area; and
(c) utilization of a soakage test and saturated groundwater flow theory.
The simplest hydraulic model (Type I) assumes no infiltration into the native soil. Type II takes into account a uniform infiltration rate along the whole wetted perimeter (). Morel-Seytoux (Citation1964) claims that this model (with mean infiltration rate fc equal to saturated hydraulic conductivity Ks) was first introduced by J. Kozeny.
Figure 1. Rectangular cross-section of infiltration trench of width b and length L showing the infiltration concept of Type II at two phases: 1 – the left half (filling), and 2 – the right half (emptying).
That approach deals with saturated groundwater flow perpendicular to the soil surface and extending as far in length as the head acting on the soil surface at a hydraulic gradient equal to unity. The third model (Type III) is called the free-surface approach with a downsloping straight (Type IIIa) or curved (Type IIIb) phreatic line, separating saturated (flow) and unsaturated (no-flow) zones. The triangular graph illustrating the infiltration rate in , using the calculation procedure presented in Section 3, is in fact substituted by an equivalent rectangle.
Figure 2. Scheme showing the infiltration concept of Type IIIa and distribution of infiltration rate fc along the wetted perimeter of a rectangular trench.
More sophisticated solutions are applied in the approach of Type IIIb, e.g. Morel-Seytoux (Citation1964). Swamee and Chahar (Swamee et al. Citation2000, Swamee and Chahar Citation2015) applied and developed the theoretical approach after Vedernikov (Citation1934), using a hodograph method in combination with conformal mapping. Swamee et al. (Citation2000) found the following analytical solution for infiltration flow from a rectangular canal into a pervious layer underlain by an impermeable layer at infinite depth, or equivalently into a pervious layer underlain at a relatively great depth by a more pervious one, in the form:
where qc is infiltration flow per unit length of trench [L2 T−1]; Ks is saturated hydraulic conductivity of the native soil [L T−1]; h is water depth in the infiltration trench [L]; and Fc is a seepage function of trench geometry and boundary conditions [-].
Equation (3b) is applicable in the range 0 < b/h ≤ 1000, including the case where pervious native soil is underlain by a drainage layer at a vertical distance greater than 6–7 water depths (h) in the trench and the water table lies below the top of the drainage layer. Assuming that solutions for steady seepage flow can be applied for unsteady flow (quasi-steady approximation), the emptying time can be calculated numerically by solving the following integral:
shows the distribution of infiltration velocity w along the wetted internal surface of a rectangular trench at two time points. It should be noted that the infiltration velocity w is a function of water depth h and also of the distance along the wetted perimeter, while the infiltration rate fc, inserted in Equation (3a), is constant along the wetted perimeter for a given h at time point t (dotted line in ).
Figure 3. Distribution of infiltration velocity w and mean infiltration rates fc (Type IIIb).
Chahar (Citation2007) and Chahar et al. (Citation2012) presented solutions for seepage from infiltration trenches of trapezoidal and rectangular cross-sections as well as for time required to empty the trenches. However, numerical methods should be applied to integrate their sophisticated functions.
The last, most sophisticated approach (Type IV by Watkins) takes into account a two- or three-dimensional “bulb” of saturation in the vicinity of the soakaway and unsaturated zone outside, above groundwater level. An example of such an approach is shown in Section 4. One of the first numerical studies on infiltration from rectangular trenches for storm water control was performed by Duchene et al. (Citation1994). They examined infiltration rates with respect to time, constant depth of water in the trench, distance to the water table, native soil texture, clogging and antecedent moisture conditions. The numerical analysis showed that the infiltration rates calculated with simple models were conservative ones.
Akan (Citation2002) presented a design tool for sizing storm water infiltration trenches. The proposed procedure was based on the hydrological storage equation for an infiltration structure, coupled with the Green and Ampt infiltration equation. For the fill phase, the two equations were solved simultaneously using a numerical method. For the emptying phase, two ordinary differential equations were integrated numerically and analytically. Emptying time can be determined using a design chart and an algebraic equation. Akan took into account a sinusoidal inflow hydrograph but he ignored infiltration through the side walls of the trench.
Błażejewski and Murat-Błażejewska (Citation2003) provided analytical solutions of a routing problem for storm water flowing from a catchment to a detention basin through a sand filter into its bottom drainage in the form of a perforated pipe. They assumed a trapezoidal-shaped inflow hydrograph and impermeable walls of both the basin and the filter. The hydraulic gradient in the soil filter varied proportionally to the water depth in the rectangular detention basin. The main design criterion was a maximum ponded water depth in the detention basin. Calculations were carried out for a given rain recurrence interval for various rain durations and sand filter surface areas to reach the maximum permitted ponded depth in the detention basin.
3 Analytical solutions for infiltration concepts of Type II and Type IIIa
We consider a linear soakaway in the form of a parallelepiped (). The following assumptions have been made:
uniform distribution of rain in a given catchment area and in time;
relatively short time of concentration, and therefore a constant rate of supply of rain water Qd during rainfall duration dr;
groundwater table or bedrock lies deep enough not to interfere with the infiltration process; therefore the vertical hydraulic gradient is close to unity;
taking into account the worst scenario for designing, the matric suction is ignored; therefore the infiltration rate fc approaches the saturated hydraulic conductivity Ks of a homogeneous native soil;
constant infiltration rate fc into water-saturated soil through bottom, two side walls as well as front and rear walls (Type II infiltration concept, in Watkins 1993) or constant infiltration rate fc into water-saturated soil through bottom and decreasing, proportionally to the water depth h, infiltration through two side walls as well as front and rear walls (Type IIIa infiltration concept, in Watkins 1993).
The instantaneous water balance equation for a trench or swale can be written as:
where Qd and Qo are inflow and outflow discharge rates [L3 T−1]; V is storage volume [L3]; and t is time [T].
For the sake of clarity, filling and emptying times of a rectangular infiltration trench are first derived. Supposing a full bottom and half of the lateral infiltration area (Type IIIa conceptual model, Watkins 1993), as well as constant inflow rate Qd, Equation (5) takes the form:
where fc is the soil infiltration rate (final or equilibrium capacity) [L T−1]; b and L are trench width and length [L]; ε is porosity of the fill medium [-]; and h is water depth (h = 0 at the trench bottom) [L].
For a constant infiltration rate fc, after separation of variables and integrating over water depth from h = 0 to h = hmax, one may obtain a corresponding fill time:
or, for a two-dimensional (2D) scheme (excluding front and rear walls):
When tf = dr, then from Equation (8) the maximum water depth hmax in the infiltration trench can be expressed as:
where dr is in min, fc is in m s−1.
Many storm water guidelines (e.g. ARC Citation2016) recommend detaining water in a trench for 6–72 h to provide an appropriate pre-treatment before infiltration into the native soil. The British standard (BRE Citation2003) recommends emptying from full to half-volume within 24 h in readiness for subsequent storm inflow.
To assess the total detention time, one should also determine an emptying time (Creaco and Franchini Citation2012), e.g. expressed in the form (infiltration concept of Type IIIa):
or, for a 2D scheme:
and for the Type II infiltration concept
4 Numerical solution
To compare the analytical solutions presented above, a numerical 2D model was implemented in the HYDRUS 3D standard computer code (Šimůnek et al. Citation2012). It was assumed that outflow from a drained catchment Qd = 0.04 dm3 s−1 is disposed over 20 min (after a very short time of concentration) to an infiltration trench filled with gravel. The width and length of the trench were assumed as b = 0.3 m and L = 1.0 m, respectively (). Water flow under unsaturated conditions was calculated in the presented 2D model using the Richards equation (Šimůnek et al. Citation2012):
Figure 4. Sketch of the infiltration trench in the 2D numerical model.
where θ is the volumetric water content [L3 L−3]; t is time [T]; xi (i = 1, 2) are spatial coordinates [L], with x1 = x the horizontal coordinate and x2 = z the vertical one; K(H) is the unsaturated hydraulic conductivity function [L T−1]; KijA are components of a dimensionless anisotropy tensor KA; H is the pressure head [L]; and S is a sink term [T−1].
The unsaturated soil hydraulic properties, θ(H) and K(H) in Equation (11), are in general highly nonlinear functions of the pressure head (Šimůnek et al. Citation2012). The HYDRUS software also implements the soil hydraulic functions of van Genuchten (Šimůnek et al. Citation2003), who used a statistical pore size distribution model of Mualem to obtain a predictive equation for the unsaturated hydraulic conductivity function in terms of soil water retention parameters. The expressions are given by:
where p = 1 – n−1, n > 1; θs is saturated water content [-]; θr is residual water content of soil [-]; α, l, n, p are empirical parameters [L−1, -, -, -]; H is pressure head [L]; Se is effective saturation [-]; Ks is saturated hydraulic conductivity [L T−1]; and K(H) is unsaturated hydraulic conductivity [L T−1].
Our calculations were conducted for the trench dimensions shown in . At the trench bottom an observation point “0” was set. The calculations were made for the almost saturated and unsaturated sandy loam (with initial water content θ = 0.35 and θ = 0.2, respectively). Analyses of infiltration into the soil of porosity εs = 0.356 and seepage through the soil under the trench were performed. A boundary condition of the second type, q = 0 (no flow through the boundaries denoted by 2 in ), was assumed on the sides and surface of the analysed area. A boundary condition of the first type, defining the maximum moisture (θ = εs = 0.356) at the bottom of the aquifer (denoted by 1 in ), was assumed. Rainfall intensity i = 0.072 mm min−1 was taken as an average value for rain lasting 20 min (denoted by 3) and the boundary condition on the trench surface was set as atmospheric condition.
5 Field study
An infiltration trench of width 30 cm, depth 30 cm and length 300 cm was dug in sandy loam. It was filled with gravel up to 30 cm and soaked overnight with tap water from a hydrant. A perforated vertical tube of diameter 11 cm was inserted and equipped with a float to observe the course water level in time. Filling the trench with water at the discharge rate Qd = 0.12 dm3 s−1 lasted 20 min. Afterwards, the emptying time was measured at consecutive water level drops of 50 mm. The value of saturated hydraulic conductivity of the native soil was determined by three methods: field percolation test, laboratory falling head test and using the ROSETTA model (USDA Citation2017), which predicts the Ks value from soil textural fractions, bulk density and two water retention points. The field percolation test was conducted using an 80-mm-diameter perforated pipe. During the measurements the water level drop in time was recorded. Additionally, the saturated hydraulic conductivity was estimated in the laboratory using the falling head test in a steel pipe of inner diameter 25 mm. Furthermore, specimens of native soil from the trench were collected and grain size distribution was determined. Based on the percentage of the grain fractions and soil bulk density, its appropriate hydraulic parameters () were estimated using RETC software and the ROSETTA model.
Table 2. Physical parameters of soils in the infiltration trench.
6 Results
The results of our field studies and calculations are shown in . Soil infiltration rate fc in the infiltration models of Type II and Type IIIa was equalized to the saturated hydraulic conductivity Ks. The saturated hydraulic conductivity, estimated using different methods, took the following values:
field percolation test Ks = 5.26 × 10⁻⁶ m s−1
laboratory falling head test Ks = (1.02 ± 0.10) × 10−6 m s−1
ROSSETA model Ks = 4.60 × 10⁻⁶ m s−1
Figure 5. Comparison of results obtained using different infiltration concepts with field data.
For the purpose of calculations the value of Ks = 4.60 × 10⁻⁶ m s−1 was taken into account because the ROSETTA code, beside the saturated hydraulic conductivity, offers five pedotransfer functions (PTFs) of the hydraulic properties needed as input data to HYDRUS. The falling head test gave the lowest value, probably due to compaction of soil by the steel tube when sampling.
A comparison of the results obtained using different infiltration concepts (II–IV) shows that there are significant differences in both filling and emptying times ().
The maximum water depth in the infiltration trench, hmax = 0.30 m, calculated using Equation (9) is higher than its counterpart obtained by HYDRUS (0.29 m) due to retention in the unsaturated zone. For the same reason, a time lag (about 10 min) in the trench filling, caused by the travel time of rain water from the trench surface to its bottom through the trench fill medium of initial moisture θ = 0.10, can be observed in . The filling time up to 0.3 m at Qd = 0.04 dm3 s−1 calculated by Equation (8) is shorter than the measured 20 min, probably due to residual matric suction.
A comparison of results obtained using Equation (10c) with the field test results shows that the infiltration model Type II gave a better result than Type IIIa (Eq. 10b). It is also closer to the numerical solution obtained using HYDRUS (Type IV) with high initial saturation of the native soil (θ = 0.35) than to a similar solution for the initial moisture of the native soil (θ = 0.2). The infiltration model of Type IIIb shows relatively good agreement with the experiment as well as with the numerical solution obtained using HYDRUS for high initial saturation of the native soil (θ = 0.35). It can be seen that the emptying rate is higher during the first phase than in the second phase.
Calculations made by BRE (Citation2003) and DWA (Citation2005) guidelines both gave, for the same example, a maximum water depth in the trench equal to 0.44 m. This means that the safety margin in the trench depth is 47%. However, the emptying time to a half storage volume, calculated by BRE (Citation2003) and (Citation2005) guidelines, equal to 4.4 h, was almost three times (4.4/1.5 = 2.93) longer than the measured one. It is safe from a hydraulic point of view, but unacceptably overestimated when a certain minimum contact time is needed for improvement of the rain water quality. It should be noted that the agreement between the British and German guidelines is not so good when the trench width differs substantially from the maximum water depth in it.
7 Discussion
American storm water management manuals (e.g. ARC Citation2016) recommend a filling time of tf = 2 h for most applications and a retention time of up to 72 h, which requires relatively large infiltration trenches or swales, deeper and wider than those described in Section 4. Nevertheless, it seems that our design procedure can also be applied for such larger structures. European guidelines (BRE Citation2003, DWA Citation2005) describe a simple procedure for calculating the filling time instead of doing it arbitrarily. However, the European guidelines ignore the estimation of so-called water quality volume, required to remove a significant percentage of the total pollution load inherent in storm water runoff (Shamseldin Citation2010). For that purpose the above derived equations for both filling and emptying time can be used.
To calculate the maximum water depth in an infiltration trench during the filling phase of duration tf as done by Akan, one should use his graphs ( or 5 in Akan Citation2002) valid within the following ranges:
and
where Ks is hydraulic conductivity [m s−1]; tf is filling time [s]; R is capture volume per unit of horizontal surface area of the trench [m]; εs is soil porosity [-]; and Se is effective saturation [-].
Such limitations lead to the following initial values of parameters describing a native soil: Se < 0.80–0.85; the minimum effective saturation increases with the soil porosity, e.g. for εs = 0.4, Se ≈ 0.25.
Numerical simulations using HYDRUS software exhibited many limitations; e.g. it was impossible to set the initial moisture of gravel to less than 0.10. Problems with the estimation of gravel parameters were also reported by Finch et al. (Citation2008). They pointed out the following difficulties during modelling: (i) an unacceptably large difference in hydraulic properties between sandy loam and gravel; (ii) possible turbulent flow in gravel instead of laminar flow, assumed in the Richards equations; and (iii) a too steep moisture release curve, causing numerical instability. In their numerical model the initial values of moisture were θ = 0.10 for dry soil and θ = 0.20 for gravel and sandy loam.
In practice, it is important to estimate the hydraulic conductivity and/or infiltration rate using field test methods appropriate for a given native soil (Nieć and Spychała Citation2014). However, it should be noted that the credibility of these methods also depends on theoretical assumptions, simplifying real phenomena. The soil infiltration rate is, as a rule, higher than saturated hydraulic conductivity (sometimes called the coefficient of permeability). Therefore, using the latter in the estimation of fill time gives a safety margin, but may not in the case of emptying time.
It is worth noting that the fill medium in a soakaway should not be compacted because of the so-called masking effect of gravel embedded in finer native soils (Radcliffe et al. Citation2005). This is the reason why gravel systems are substituted by chamber systems, especially in the case of slowly permeable native soils. The impact of the masking effect on infiltration rate is still not well recognized.
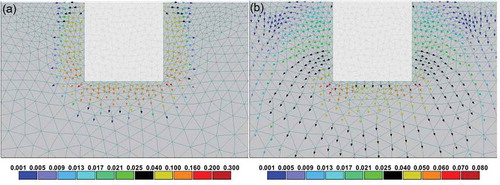
Distributions of the simulated water velocity vectors, shown in , imply that the infiltration concept of Type II is more applicable to unsaturated soils ()), whereas Type IIIb is more applicable to highly saturated soils ()).
Figure 6. Velocity distribution (cm min−1) at the end of water inflow to the trench at initial soil moisture: (a) θ = 0.2 and (b) θ = 0.35.
Rearranging Equations (3a) and (3b) one can obtain the following relationship:
This relationship is depicted as a curve in ; it can be seen that the mean infiltration rate along the wetted perimeter of the rectangular trench varies in the range 1.0 < fc/Ks < 1.5 and its maximum value of 1.483 is reached at a relative water depth h/b = 1.35.
Figure 7. Relative mean infiltration rates fc/Ks versus relative water depth h/b: according to DWA (Deutsche Vereinigung für Wasserwirtschaft, Abwasser und Abfall) (Citation2005). Dotted line: Iz = 1, dashed line: Type II, solid line: Type IIIb.
Equation (15) implies that walls infiltrate water more intensively than the trench bottom. The right-hand side of Equation (15), as a function of the water depth to width ratio, may be treated as a shape factor. Morel-Seytoux (Citation1964) postulated that, in the case of a rectangular trench, the left-hand side of Equation (15) should be greater than unity, but his attempt to characterize the seepage discharge only in terms of the wetted perimeter failed. Instead of the wetted perimeter he proposed the square root of the trench cross-sectional area √(b⋅ h).
Analytical solutions developed by Błażejewski and Murat-Błażejewska (Citation2003) for rectangular detention basins can easily be adapted to the case of drained infiltration trenches in slowly permeable and/or impervious native soils by introducing the porosity of the fill medium.
8 Conclusions
British and German guidelines to design infiltration trenches of rectangular cross-sections are conservative mostly due to the reduced infiltration surface area and infiltration rates. However, overestimated emptying time may be misleading for designers when a certain minimum contact time is needed for improvement of the rain water quality.
Kozeny’s concept of infiltration (Type II according to Watkins) and the free-surface approach (Type IIIb) have proved to be closer to reality, especially in the case of highly saturated fine graded native soils, than Type IIIa, which is the most conservative.
Theoretical solutions, neglecting matric potential, suggest that the mean infiltration rate (Type IIIb) along the wetted perimeter of the rectangular trench varies in the range 1.0 < fc/Ks < 1.5 and its maximum value of 1.483 should be observed at relative water depth h/b = 1.35.
Values of safety factors due to clogging by fine solid particles should be differentiated: higher for coarse-grained and lower for fine-grained native soils.
Due to the scarcity of field data on hydraulic performance of infiltration trenches there is a need for further field research.
Acknowledgements
The authors acknowledge Dr Michal Kozlowski from the Department of Soil Science and Land Reclamation (PULS) for his help in determining soil parameters required by the RETC software and ROSSETA model, as well as Associate Editor Dr Evangelos Rozos for his valuable comments and patience in correcting successive versions of the paper.
Disclosure statement
No potential conflict of interest was reported by the authors.
References
- Akan, A.O., 2002. Sizing stormwater infiltration structures. Journal of Hydraulic Engineering, ASCE, 128 (5), 534–537. doi:10.1061/(ASCE)0733-9429(2002)128:5(534)
- ARC (Atlanta Regional Commission), 2016. Georgia stormwater management manual [online]. Available from: http://atlantaregional.org/georgia-stormwater-management-manual/ [Accessed 9 June 2017].
- Argue, J.R., ed.. 2013. Water sensitive urban design: basic procedures for ‘source control’ of stormwater. Adelaide: AWA, University of South Australia.
- Błażejewski, R. and Murat-Błażejewska, S., 2003. Analytical solutions of a routing problem for stormwater in a detention basin. Hydrological Sciences Journal, 48 (4), 665–671. doi:10.1623/hysj.48.4.665.51413
- BRE (Building Research Establishment), 2003. Soakaway design. Digest 365. Watford, UK: BRE.
- Cederwall, K. and Eriksson, A., 1977. Dimensionering av infiltrationsmagasin enligt regnenvelopemetoden (in Swedish): design of infiltration storages using rain-envelope method. In: Proc. of Chalmers Tekniska Hoegeskola. Goeteborg: Chalmers Tekniska Hoegeskola, Vol. 25, 113–117.
- Chahar, R.B., 2007. Analysis of seepage from polygon chnnels. Journal of Hydraulic Engineering ASCE, 4, 451–460. doi:10.1061/(ASCE)0733-9429(2007)133:4(451)
- Chahar, R.B., Graillot, D., and Gaur, S., 2012. Storm-water management through infiltration trenches. Journal of Irrigation and Drainage Engineering, ASCE, 138, 274–281. doi:10.1061/(ASCE)IR.1943-4774.0000408
- Creaco, E. and Franchini, M., 2012. A dimensionless procedure for the design of infiltration trenches. Journal - American Water Works Association, 104, 501–509. doi:10.5942/jawwa.2012.104.0124
- Duchene, M., McBean, E.A., and Thomson, N.R., 1994. Modeling of infiltration from trenches for storm water control. Journal of Water Resources Planning and Management, 120, 276–293. doi:10.1061/(ASCE)0733-9496(1994)120:3(276)
- DWA (Deutsche Vereinigung für Wasserwirtschaft, Abwasser und Abfall), 2005. Standard DWA-A 138E. Planning, construction and operation of facilities for the percolation of precipitation water. Hennef: German Association for Water, Wastewater and Waste.
- Finch, S.D., Radcliffe, D.E., and West, L.T., 2008. Modeling trench sidewall and bottom flow in on-site wastewater systems. Lincoln, NE: Publ. from USDA-ARS/UNL Faculty. 474.
- Koutsoyiannis, D., Kozonis, D., and Manetas, A., 1998. A mathematical framework for studying rainfall intensity-duration-frequency relationships. Journal of Hydrology, 206, 118–135. doi:10.1016/S0022-1694(98)00097-3
- Morel-Seytoux, H.J., 1964. Domain variations in channel seepage flow. Journal of the Hydraulic Division. Proceedings of ASCE, 3, 55–79.
- Nagy, L., et al., 2013. Comparison of permeability testing methods. In: Proc. 18th Int. Conf. on Soil Mechanics and Geotech. Eng.. Paris: Presess des Ponts, 399–402.
- Nieć, J. and Spychała, M., 2014. Hydraulic conductivity estimation test impact on long-term acceptance rate and soil absorption system design. Water, 6, 2808–2820. doi:10.3390/w6092808
- Radcliffe, D.E., West, L.T., and Singer, J., 2005. Gravel effect on wastewater infiltration from septic system trenches. Soil Science Society of America Journal, 69, 1217–1224. doi:10.2136/sssaj2004.0302
- Ruggenthaler, R., et al., 2016. Investigating the impact of initial soil moisture conditions on total infiltration by using an adapted double-ring infiltrometer. Hydrological Sciences Journal, 61 (7), 1263–1279.
- Scholes, L. and Revitt, D.M., 2008. A design manual incorporating best practice guidelines for stormwater management options and treatment under extreme conditions. Project 018530 - SWITCH WP2.1. Middlesex: Middlesex University.
- Shamseldin, A.Y., 2010. Review of TP10 water quality volume estimation. Prepared by Auckland UniServices Ltd. for Auckland Regional Council[online]. Auckland Regional Council TR2010/066. Available from: http://knowledgeauckland.org.nz/assets/publications/TR2010-066-Review-of-TP10-water-quality-volume-estimation.pdf
- Šimůnek, J., Jarvis, N.J., and Van Genuchten, M.T., 2003. Review and comparison of models for describing nonequilibrium and preferential flow and transport in the vadose zone. Journal of Hydrology, 272, 14–35. doi:10.1016/S0022-1694(02)00252-4
- Šimůnek, J., van Genuchten, M.T., and Šejna, M., 2012. The HYDRUS software package for simulating the two- and three-dimensional movement of water, heat, and multiple solutes in variably-saturated porous media. Technical manual. Version 2.0. Prague: PC-Progress.
- Swamee, P.K. and Chahar, B.R., 2015. Design of Canals. Series: springer transactions in civil and environmental engineering. India: Springer.
- Swamee, P.K., Mishra, G.C., and Chahar, B.R., 2000. Design of minimum seepage loss canal sections. Journal of Irrigation and Drainage Engineering, 126, 28–32. doi:10.1061/(ASCE)0733-9437(2000)126:1(28)
- USDA (US Department of Agriculture). ROSETTA model. Available from: https://www.ars.usda.gov/pacific-west-area/riverside-ca/us-salinity-laboratory/docs/rosetta-model/ [Accessed 25 April 2017].
- Vedernikov, V.V., 1934. Seepage from Channels (in Russian). Gosstroiizdat, Moscow: Moscow-Leningrad.
- Watkins, D.C., 1991. The Hydraulic Design and Performance of Soakaways. Rep. SR 271, HR Wallingford, UK.