
 ?Mathematical formulae have been encoded as MathML and are displayed in this HTML version using MathJax in order to improve their display. Uncheck the box to turn MathJax off. This feature requires Javascript. Click on a formula to zoom.
ABSTRACT
Understanding potential evapotranspiration (PET) changes under climate change is of great importance for hydrological research. The trends of PET changes and their driving forces were investigated in the Lancang (LRB) and Yarlung Zangbo (YRB) river basins, southwest China, using diagnosis graphs and the Mann-Kendall test. Analysis of variance was applied to examine the contribution of different climatic variables to PET. The results show that: (i) there was a statistically significant increase in PET in the period of 1957–2015 in the LRB, while it showed a markedly decreasing trend in the YRB; (ii) PET in both basins is fairly sensitive to wind speed, relative humidity, solar radiation and maximum air temperature, and the interactions between wind speed and relative humidity are also important; and (iii) the increase in PET in the LRB is due mainly to the increase in maximum air temperature and decrease in relative humidity, while declines in wind speed and solar radiation are the main reasons for the decrease in PET in the YRB.
Editor R. Woods Associate editor J. Thompson
1 Introduction
Evapotranspiration, an important hydrological component, has significant impacts on the global water and energy cycle. Potential evapotranspiration (PET), defined as “the amount of water evaporated from surfaces not limited by the supply of water” (Gao et al. Citation1978), usually reflects the maximum possible evaporation or evaporation capacity, and plays a key role in evaluating the maximum water demand of the environment to maintain a water balance. PET is usually the basis for calculating actual evapotranspiration. It is widely used in the analysis of climate conditions, rational utilization of water resources, agricultural water management and many other fields.
The Fifth Assessment Report (AR5) of the Intergovernmental Panel on Climate Change (IPCC Citation2013) pointed out that the global mean air temperature had risen by about 0.85°C from 1880 to 2012, and consequently evapotranspiration was expected to increase. There has been an increasing trend in PET or pan evaporation (a physical and observational representation of PET) in some regions in the past several decades, for example, Iran (Kousari and Ahani Citation2012) and some parts of China (Gao et al. Citation2007). However, it has been observed that PET or pan evaporation has declined in many parts of the world, such as the USA (Abtew et al. Citation2011), Australia (Roderick and Farquhar Citation2004), New Zealand (Roderick and Farquhar Citation2005) and most parts of China (Gao et al. Citation2007, Liu et al. Citation2009, Xu et al. Citation2016). This inverse relationship has become known as the “pan evaporation paradox” (Brutsaert and Parlange Citation1998). In this study, the Mann-Kendall (MK) test with a trend-free pre-whitening (TFPW) procedure was used to analyse the trends of PET in the Lancang and Yarlung Zangbo river basins in southwest China, to evaluate whether the pan evaporation paradox exists in these two basins. Moreover, an innovative trend analysis method, named the diagnosis graph (DG), was used as a supplement to the TFPW-MK test to obtain more detailed information on trends of annual PET.
Changes in PET have close relationships with changes in climatic variables, including wind speed, solar radiation, air temperature and relative humidity. The main factors leading to the changes in PET seem to be various due to the differences in study areas, methods and study periods. For example, Zhang et al. (Citation2007) pointed out that the decrease in wind speed and solar radiation resulted in a decreasing trend in PET in the Tibetan Plateau in the period of 1966–2003. However, Chen et al. (Citation2006) indicated that changes in relative humidity played a supporting role affecting PET trends in the Tibetan Plateau in the period of 1961–2000, while changes in sunshine duration played an insignificant role. Li et al. (Citation2014) showed that decreasing wind speed was the dominating factor for the significant decrease in PET in southwest China in the period of 1961–2009. Earlier studies imply that changes in PET may not be due to changes of a single climatic variable, but to their integrated effects (Shi et al. Citation2017). In this study, analysis of variance (ANOVA), a global sensitivity analysis method, was adopted to determine the contributions of different climatic variables to PET, and to estimate the main causes of PET changes together with the changes in climatic variables.
Compared with previous studies (e.g. Chen et al. Citation2006, Zhang et al. Citation2007, Li et al. Citation2014), the novelty of this paper is that it focuses on the comparison of PET changes in the Lancang and Yarlung Zangbo river basins, and the reasons for these changes are explored and illustrated. Such comprehensive attribution analyses of PET changes under climate change have not been studied in these two basins so far. In addition, the DG method was applied in this study to verify and complement the trends detected by the MK tests, allowing the trend analysis results to be more detailed and reliable.
The aims of this study were: (1) to investigate trends of PET in the Lancang and Yarlung Zangbo river basins by the TFPW-MK test and the DG method, which will have important implications for water resources management in these two basins; (2) to examine the sensitivity of PET to climatic variables by ANOVA; and (3) to interpret the main factors leading to changes in PET, in order to explain why the trends of PET in these two basins are similar or different.
2 Materials and methods
2.1 Study areas and data
The Lancang–Mekong River, flowing through six countries including China, is the most important international river in Asia, and its upper reach within the territory of China is known as the Lancang River. The Lancang River Basin (LRB, ) (21°N–34°N; 94°E–102°E) has a total length of 2354 km and a drainage basin area of more than 165 000 km2 (Tang et al. Citation2015). The LRB is under varied geographic conditions and covers many climatic zones, which causes marked differences in the distribution of heat and water resources in this region. The annual mean temperature in the LRB is in the range of 12.3–14.3°C, while annual precipitation varies from 752 to 1025 mm and annual PET is about 960–1087 mm.
Figure 1. Locations of the Lancang (LRB) and Yarlung Zangbo (YRB) river basins and meteorological stations in the two basins.
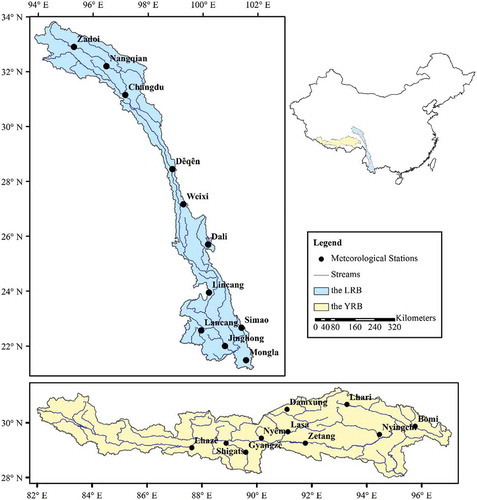
The Yarlung Zangbo River, the upstream of the Brahmaputra River, is the highest river in the world, with an average elevation of over 4000 m a.s.l. (You et al. Citation2007). The Yarlung Zangbo River Basin (YRB, ) (28°N–31°17′N; 82°E–97°07′E) has a total length of 2057 km and a drainage area of about 240 000 km2. It lies to the west of the LRB, with Nujiang between them. The hydrometeorological elements in the YRB are strongly affected by the various climatic conditions in this region. The annual mean temperature in the YRB is between 5.3 and 7.6°C, and the annual precipitation varies from 378 to 736 mm, while the annual PET is about 1116–1290 mm. It is obvious that the YRB is colder and drier than the LRB.
The long-term meteorological data from meteorological stations located within the LRB and YRB were obtained from the National Climate Center, China Meteorological Administration. The main climatic variables include wind speed at 10 m height, maximum and minimum air temperature at 2 m height, daily sunshine duration and relative humidity. The stations in the LRB have complete records from 1957 to 2015; however, the lengths of records for the stations in the YRB are various, ranging from 38 to 60 years.
2.2 Analysis framework
As the first step, the FAOFootnote1 Penman-Monteith (PM) method (Allen et al. Citation1994) was used to calculate daily PET for each station in the LRB and YRB. Next, trends of monthly and annual PET were detected by means of TFPW-MK statistical tests. Then diagnosis graphs of annual PET for the two basins and some representative stations in them were drawn in order to obtain more detailed information on trends of PET. Sensitivity analysis of PET to five climatic variables and their interactions was then conducted by ANOVA. Finally, with the combination of changes in different climatic variables and the results of sensitivity analysis, the causes of PET changes were analysed and illustrated. The whole analysis framework of this study is shown in .
2.3 FAO Penman-Monteith method
The FAO PM method (Allen et al. Citation1994) is considered to be more precise and suitable for estimating PET than many other methods (Donohue et al. Citation2010), and therefore, this method was used to estimate PET in the two study basins. The FAO PM method is expressed as:
where PET is potential evapotranspiration (mm d−1); Rn is net radiation at the canopy surface (MJ m−2 d−1); G is the soil heat flux density at the soil surface (MJ m−2 d−1); T is the mean daily air temperature at 2 m height (°C); u is the wind speed at 2 m height (m s−1); es is the saturated vapour pressure at 2 m height (kPa); ea is the actual vapour pressure at 2 m height (kPa); Δ is the slope of the saturated vapour pressure–temperature curve (kPa °C−1); and γ is a psychrometric constant (kPa °C−1).
2.4 Trend-free pre-whitening Mann-Kendall test
The Mann-Kendall (MK) statistical test (Mann Citation1945, Kendall Citation1975), a rank-based nonparametric method, has been widely used for detecting trends in time series data (Yue and Wang Citation2002, Zheng et al. Citation2009, Tian et al. Citation2012). Compared with traditional parametric statistical methods, the MK test is more appropriate and robust for non-normally distributed and censored data, which frequently happens in hydrometeorology. In this study, the MK test was applied to detect trends in long-time PET series. The statistic S is calculated as:
where xj and xk are the series data values, and n is the length of time series. The variance of test statistic S is computed as:
where t is the extent of any given tie. The normally distributed statistic Z is defined as:
Trends in the data series are defined as statistically significant when , where
is the
quantile of the standard normal distribution. The bigger
is, the more significant the trend. Moreover, a positive Z indicates an upward trend in the time series, while a negative Z indicates a downward trend.
The results of MK tests will be affected by serial correlations in the data series. Pre-whitening is a procedure to reduce the serial correlations by adding white noise series to the original series. The trend-free pre-whitening (TFPW) approach proposed by Yue et al. (Citation2002, Citation2003) was applied in this study to improve the reliability of the MK tests.
2.5 Diagnosis graph
The diagnosis graph (DG), an innovative trend analysis method (Şen Citation2012), was used in this study to verify and complement the trend analysis results gained by the MK tests. The basis of the DG method is that if two time series are identical to each other, the data points scatter along the 1:1 (45°) line on the Cartesian coordinate system, as shown in ). ) and (c) show the results of increasing and decreasing trends of time series, respectively. It can be seen in these figures that when the trend is upward (downward), the points fall above (below) the 1:1 line. It is worth noting that the data values are arranged in ascending order. The significance of the trend is determined by the distance between the cluster of points and the 1:1 line; the closer the cluster of the points is to the 1:1 line, the weaker the trend.
Figure 2. Analysis framework of this study.
Figure 3. (a) Trend-free time series; (b) increasing time series; and (c) decreasing time series.
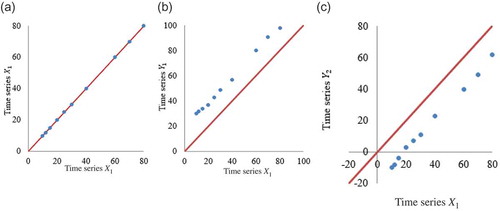
Thus, given only one time series, it can be divided into two halves, and then the trend for the second half of the time series can be identified against the first half. Compared with the MK test, the advantages of the DG method are as follows:
The trend in a time series detected by the MK test is monotonic (i.e. increasing, decreasing or trend-free). However, trends of a time series can be non-monotonic (i.e. a composition of various trends) with points falling above, below or along the 1:1 line in the DG. When analysing time series with non-monotonic trends, various data values can be divided into different clusters corresponding to different trends, and then more detailed interpretations can be made.
The validity of the MK test is only possible under a set of restrictive assumptions, such as normality of the distribution, enough length of data and independent structure of the time series, while the DG method is suitable for time series with non-normal distribution, small samples and serial correlations.
2.6 Analysis of variance
Analysis of variance (ANOVA) was applied in this study to analyse the sensitivity of PET to different climatic variables and their interactions. The main idea of ANOVA is that, in an appropriately designed experiment, total variability in the quantity can be partitioned into two or more parts including the variability caused by parameters (single parameters and interactions of parameters) and by random sources. ANOVA allows one to examine whether the variability due to parameters is statistically significant compared to that due to random sources, and thus to analyse the sensitivity of parameters.
In ANOVA, a parameter input is called a “factor” and values of factors are referred to as “levels”. The model output is called the “response variable”. The response variable can be decomposed into an overall mean, main factor effects, interaction effects and an error term (Neter et al. Citation1996, Mokhtari and Frey Citation2005). To date, ANOVA has only been capable of evaluating first-order effects (i.e. main effects from single factors) and second-order effects (i.e. effects from interactions between two factors) due to computational limitations (Box et al. Citation1978, Henderson-Sellers et al. Citation1993b, Liang and Guo Citation2003). Two-way ANOVA is calculated using:
where i and j refer to the levels of factors A and B, respectively, and k refers to the kth value of the response variable Y. The variables and
represent the main effect of the ith level of factor A and the jth level of factor B,
represents the interactions between factors A and B, and
is the error term and reflects the effects from random sources.
The coefficient of determination, R2, quantifies how the ANOVA model (Equation (6)) captures the total variation of the response variable with the first-order and second-order effects (Tang et al. Citation2007). If the second-order effects are important, R2 should increase when added with the term . Moreover, R2 can be used to assess the reliability of the results obtained by the ANOVA model.
ANOVA uses the F test to analyse the effects of the factors on the response variable. The F values are calculated for all single factors and the interactions between two factors. The higher the F value, the more significant the effect and, therefore, the more sensitive the response variable is to the factor or factor interactions. For a single factor A and interactions between factors A and B, the equations of their F values are as follows:
where MSA and MSAB are treatment mean squares, which reflect the differences between the mean values of samples in different levels and the mean value of all samples; and MSEA and MSEAB are mean square errors, which reflect the differences between the value of each sample and the mean values of samples in different levels.
Apart from the F tests, the contributions of the factors also reflect the importance of different factors to the response variable. The higher the contribution, the more important the factor. The contribution results are considered together with the F values to determine the effects of different factors on the response variable. The contributions of factor A and the interactions between factors A and B are calculated as:
where SSA and SSAB are sums of squares of factor A and the interactions between factors A and B. The terms SSTO1 and SSTO2 represent total squares of first-order and second-order factors, respectively.
3 Results and discussion
3.1 Trends of PET
3.1.1 Trends of PET in the LRB
Trends of monthly and annual PET represented by the MK statistic Z for the LRB are shown in . At the 95% confidence interval, if , the trend of PET is statistically significant. At the basin scale, PET shows an increasing trend in all months, with a significant increase in five months, and annual PET in the LRB also increases markedly, represented by Z = 3.51, according to . It is obvious that trends of PET differ for different stations. For annual PET, there is an increasing trend at all the stations for the period of 1957–2015, with a significant trend at seven stations. For February, marked increases are found at all the stations except Zadoi. For May, increasing trends are observed at all the stations except Zadoi and Nangqian, and PET at Deqin increases obviously. For July, there are insignificant downward trends at Changdu, Weixi, Dali and Mongla, while PET at the other seven stations shows an increasing trend, with Zadoi and Deqin increasing significantly. For October, significant increases occur at Lincang, Lancang, Simao and Mongla.
Figure 4. Mann-Kendall statistic (Z) values of monthly and annual PET in the Lancang River Basin.
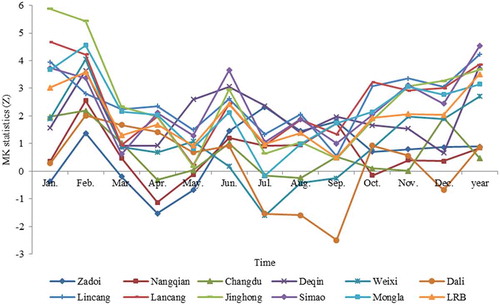
Additionally, it can be seen from that trends of monthly PET are also different at each station. At Nangqian, a significant change is found only in February. At Changdu, obvious changes occur in January and February, and both are increasing. At Weixi, there are significant increases in February and November, with insignificant changes in the other 10 months. At Dali, there is an obvious upward trend in February and an obvious downward trend in September. Deqin, Lincang, Lancang, Jinghong and Simao are different from other stations, where PET in all months shows an increasing trend.
In order to obtain more detailed information on trends of annual PET in the LRB, the DG method was used to detect trends for the second half of the PET series (1987–2015) against the first half (1958–1986) at the basin scale and for five representative stations (Nangqian, Changdu, Weixi, Dali and Jinghong). The original annual PET series of the LRB and the five selected stations are shown in and their diagnosis graphs are presented in .
Figure 5. Original annual PET series of the LRB and the five representative stations.
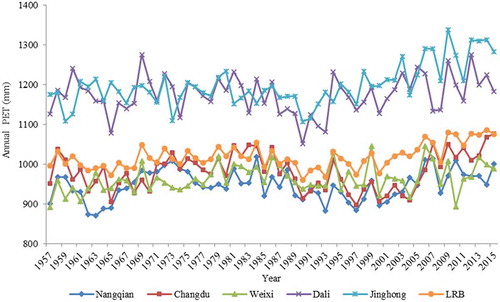
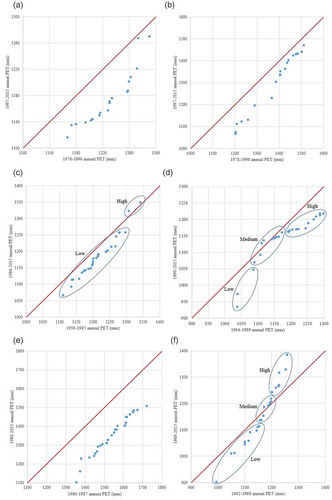
Figure 6. Diagnosis graphs of annual PET for (a) the LRB and the representative stations: (b) Nangqian, (c) Changdu, (d) Weixi, (e) Dali and (f) Jinghong.
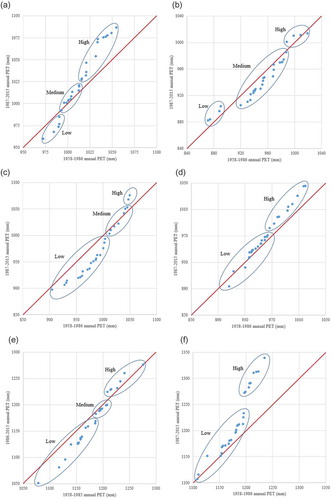
At the basin scale ()), the values of annual PET can be divided into three clusters: low, medium and high. PET with low values shows a decreasing trend in 1987–2015 compared with 1958–1986. There are increasing trends in both medium and high clusters, and the trend of PET with high values is obvious, indicating that PET with medium and high values will tend to increase further in the future, especially for high PET values.
At Nangqian ()), there is a slight decreasing trend in the medium PET cluster, while PET with high and low values shows a slight increasing trend. Considering the insignificant increasing trend detected by the MK test, it can be concluded that PET at Nangqian has no obvious trend.
At Changdu ()), there is a distinct decreasing trend in the low PET cluster and an obvious increasing trend in the high PET cluster. However, the medium cluster is trend free, with points falling around the 1:1 line. The significant increasing trend in the high cluster at Changdu gives warning that PET with high values is likely to be more common in the future. Coincidentally, a similar situation happens at Dali, as shown in ).
It can be observed from ) and (f) that there is an increase in annual PET at Weixi and Jinghong during the second half of the series (1987–2015) with respect to the first half (1958–1986), especially for high PET values. The increasing trend indicates that PET at Weixi and Jinghong will continue to increase in the future, especially for PET with high values.
3.1.2 Trends of PET in the YRB
The MK test was also conducted in the YRB to detect trends of monthly and annual PET, and the results are presented in . At the basin scale, monthly PET from April to October and annual PET decrease significantly in the YRB, whilst PET in the other five months decreases insignificantly. It can be observed that trends of PET in the YRB differ substantially from those in the LRB. For annual PET, in contrast to the results for the LRB, there are decreasing trends at all the stations, with significant decreases at five stations. For February, PET shows a significant decreasing trend at Lhazê, Shigatse, Gyangzê, Nyêmo and Zetang. For May, obvious decreases are observed at Shigatse, Gyangzê, Nyêmo, Zetang and Bomi, while an obvious increase occurs at Damxung. For July, PET decreases at all the stations expect Lasa, and decreases markedly at four stations (Gyangzê, Nyêmo, Zetang and Lhari). For October, there are significant decreasing trends at Gyangzê, Nyêmo and Zetang, while PET for other stations changes insignificantly.
Figure 7. Mann-Kendall statistic (Z) values of monthly and annual PET in the Yarlung Zangbo River Basin.
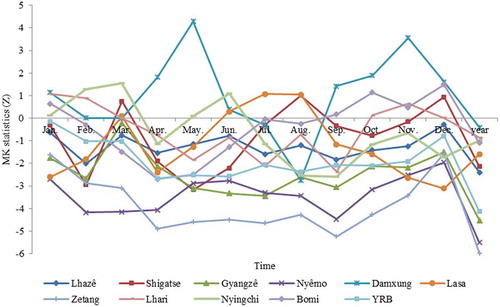
also shows that trends of PET differ in different months at each station. At Lhazê, a significant decrease in PET is found in February, compared to slight decreases in other months. At Shigatse, there are obvious decreases in February, May and June, while changes in other months are not obvious. At Gyangzê, Nyêmo and Zetang, PET decreases in all months, with a significant decrease in most months. At Damxung, marked changes occur in May, August and November, and at Nyingchi, obvious decreases are observed in August and September.
Diagnosis graphs of annual PET were also drawn for the YRB and five representative stations (Lhazê, Shigatse, Damxung, Zetang and Nyingchi) to gain more information on the trends. presents the original annual PET series of the YRB and the five selected stations, and their diagnosis graphs are shown in .
Figure 8. Original annual PET series of the YRB and the five representative stations.
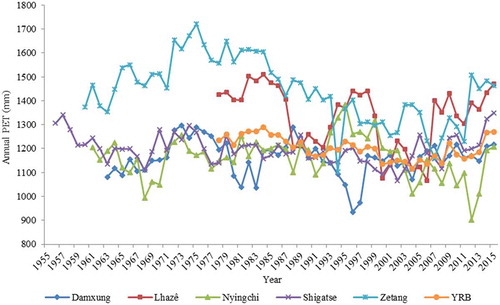
Figure 9. Diagnosis graphs of annual PET for (a) the YRB and the representative stations: (b) Lhazê, (c) Shigatse, (d) Damxung, (e) Zetang and (f) Nyingchi.
As can be seen in ), (b) and (e), there are distinct declines in PET in the second half of the series with respect to the first half at the basin scale and at Lhazê and Zetang, especially for the whole basin and Zetang. The monotonic decreasing trends obtained by the diagnosis graphs coincide with the results of the MK tests. Therefore, PET in the YRB and at Lhazê and Zetang is bound to decrease further in the future.
At Shigatse ()), PET with low values has a downward trend whereas PET with high values shows a weak upward trend. Most of the period is occupied by the low cluster with an obvious decreasing trend, which means PET at Shigatse will continue to decrease.
In ), the decreasing trend in the low and high PET clusters is evident, while there is no significant trend in the medium cluster. Considering the insignificant decreasing trend detected by the MK test, it can be inferred that the declines in low and high PET values make PET decrease on the whole at Damxung.
It can be observed from ) that PET with low values decreases while PET with high values increases at Nyingchi; however, there is almost no trend for medium PET values. At Nyingchi, the MK test only finds an insignificant decreasing trend of annual PET in the period of 1962–2015. The obvious increasing trend in high PET values is a new finding obtained by the DG.
Trends of PET in the LRB and YRB are very different. At the basin scale, there is an obvious increasing trend in PET in the LRB, while a significant decrease in PET is found in the YRB. In the LRB, annual PET at all the meteorological stations shows an upward trend, with a significant increase at seven stations. Moreover, monthly PET increases in most or even all months at each station in the LRB. The upper reaches and most of the middle reaches of the LRB lie on the east of the Tibetan Plateau, so the results are partially consistent with the conclusion drawn by Gao et al. (Citation2007) that there is an increasing trend in PET in the belt from the southwest toward the east Tibetan Plateau. However, in the YRB, PET changes in the opposite direction. There is a decreasing trend in annual PET at all the meteorological stations in the YRB, with a marked decrease at five stations. Monthly PET in most months in the YRB decreases, which is in contrast to the LRB. It can be seen that PET in the YRB decreases along with a significant increase in air temperature, which implies that the pan evaporation paradox exists in this region.
To understand why the trends of PET are so different in these two basins, the sensitivity of PET to different climatic variables was analysed in the five representative stations of each basin. The selected stations in both basins are distributed across the whole basin and each has good representation of the regional geographic and climatic conditions.
3.2 Results of sensitivity analysis
3.2.1 Results of sensitivity analysis in the LRB
Sensitivity analysis of PET to five climatic variables (u: wind speed at 2 m height; Rs: solar radiation; Tmax and Tmin: maximum and minimum air temperature, respectively; and RH: relative humidity) and their interactions was conducted by ANOVA. The F values of single factors and their percentages of the total variance at a significance level of p = 0.05 for the five representative meteorological stations in the LRB are given in the Supplementary material (Fig. S1). Similarly, F values of interactions between two factors were obtained for these five stations, together with their percentages of the total variance at a significance level of p = 0.05 (see Supplementary material, Fig. S2).
For a significance level of p = 0.05, the threshold of F is 3.0 (Pearson and Hartley Citation1951). When the F value of a single factor is bigger than 3.0, the factor is determined as sensitive. The F values of single factors ranged between 9.42 and 3187.24 (all > 3) (Fig. S1), which means that PET is sensitive to all the climatic variables of all months at all stations. In general, the bigger the F value of a single factor, the more contribution it makes to the total variance. The sensitivity of PET to different climatic variables varies substantially at different stations in the LRB (Fig. S1). In summer, PET is most sensitive to solar radiation, except at Nangqian and Changdu, and the higher latitude of these two stations could be the reason for the difference. The sensitivity of PET to solar radiation in the LRB was observed to increase gradually from upstream to downstream (i.e. from north to south), and at Jinghong, PET is most sensitive to solar radiation throughout the year. In winter, relative humidity is apparently the dominating climatic variable at all the stations except Jinghong. However, the sensitivity of PET to relative humidity shows a noticeable decline in summer. The sensitivity of PET to wind speed at Nangqian and Changdu is greater than that of the other three stations, which may be due to the higher altitude of these two stations. Moreover, it is rather obvious that PET is least sensitive to minimum air temperature for all months at all stations.
The interactions between two factors are considered to be sensitive if F is greater than 2.37 (Pearson and Hartley Citation1951). Most of the F values of interactions between two factors (Fig. S2) are greater than 2.37, which means that PET is also sensitive to the interactions between two different climatic variables in most cases. PET is most sensitive to the interactions between wind speed and relative humidity at all stations (Fig. S2). This is consistent with the result obtained by Xu et al. (Citation2016) that pan evaporation is most sensitive to the interactions between wind speed and relative humidity in the Qiantang River Basin, East China, based on Sobol’s sensitivity analysis method (Sobol Citation2001). Probably due to the lower latitude of Jinghong, PET is also sensitive to the interactions between solar radiation and maximum air temperature, aside from those between wind speed and relative humidity.
3.2.2 Results of sensitivity analysis in the YRB
Sensitivity analysis of PET to the five climatic variables of single factors and their interactions was conducted in the YRB in the same way as in the LRB (see Section 3.2.1) and the results are given in the Supplementary material (Figs S3 and S4).
The F values of single factors indicate that PET in the YRB is sensitive to all these climatic variables, and the sensitivity of PET to various climatic variables is generally different at different stations (Fig. S3). By and large, PET is shown to be quite sensitive to wind speed, relative humidity and maximum air temperature in all months at all stations in the YRB. It is observed that the sensitivity of PET to solar radiation has a sudden increase in summer, especially at Shigatse and Nyingchi, where solar radiation becomes the dominating climatic variable in summer. The sensitivity of PET to relative humidity shows an obvious decrease in summer compared with other months of the year, which is similar to the LRB. Another similarity between the two basins is that PET is least sensitive to minimum air temperature for all months at all stations.
As for the sensitivity of PET in the YRB to the interactions between two climatic variables (Fig. S4), the results are roughly coincident with those for the LRB, in that PET is sensitive to most interactions between two different climatic variables and it is most sensitive to the interactions between wind speed and relative humidity. In addition, PET is also rather sensitive to interactions between wind speed and maximum air temperature, and between maximum air temperature and relative humidity.
The coefficient of determination R2 can be used to measure whether the addition of interactions between different factors into the ANOVA model improves its ability to represent model output variability (Mokhtari and Frey Citation2005). and show, for the LRB and YRB, respectively, the 95% probability R2 values for the ANOVA models including only single factor effects and those including both single factor effects and effects from interactions between two factors. As can be seen in , with the addition of effects from interactions between two factors, the increase in R2 ranges from 0.04 to 0.17, which means that the interaction effects account for 4 to 17% of the total variability in the response variable. Similarly, indicates that the effects from interactions between two factors in the YRB account for a range of 9–20% of the total variability in the ANOVA models. It can be observed from and that the ANOVA models with only first-order effects and those with both first-order and second-order effects account for a substantial amount of variability in the response; therefore, the sensitivity analysis results based on the F values are deemed to be reliable.
Table 1. Lancang River Basin – coefficient of determination values (95% probability) for the ANOVA models: (i) including single factor effects (R12) and (ii) including both single factor effects and those from interactions between two factors (R22). Δ: difference between R12 and R22.
Table 2. Yarlung Zangbo River Basin – coefficient of determination values (95% probability) for the ANOVA models (i) including single factor effects (R12) and (ii) including both single factor effects and those from interactions between two factors (R22). Δ: difference between R12 and R22.
Through a comprehensive comparison of the sensitivity analysis results for the LRB and YRB, it can be seen that there are some similarities in these two basins. On the one hand, for single factors, PET is sensitive to all the climatic variables; the sensitivity of PET to solar radiation has an obvious increase in summer while the sensitivity of PET to relative humidity decreases in summer; PET is least sensitive to minimum air temperature. On the other hand, PET is also sensitive to the interactions between two different climatic variables most of the time; of all the interactions, PET is most sensitive to the interactions between wind speed and relative humidity. There are no large differences in the sensitivity analysis results of the LRB and YRB in general. However, these two basins show contrasting trends in PET changes, which indicates that the causes of PET changes cannot be determined only by the results of sensitivity analysis.
3.3 Causes of PET changes
Based on the results of sensitivity analysis (Section 3.2) and historic monthly changes in different climatic variables, the impacts of the changes in climatic variables on PET were analysed, and then the causes of PET changes can be inferred.
3.3.1 Causes of PET changes in the LRB
At Nangqian, there is a remarkable increase in PET in February. In this month, the sensitivity of PET to maximum air temperature and relative humidity is much higher than that to other climatic variables based on the sensitivity analysis results. The maximum air temperature and relative humidity change by 0.61°C (increase) and 0.43% (decrease), respectively, in every decade. Considering the slight decrease in relative humidity, the increase in maximum air temperature is the dominating factor for the change in PET.
At Changdu, obvious increases are observed in January and February. In January, through sensitivity analysis, it is found that PET is most sensitive to wind speed, followed by maximum air temperature, relative humidity, minimum air temperature and solar radiation. In this month, the observed changes for these variables are 0.01 m s−1 (decrease), 0.31°C (increase), 0.66% (decrease), 0.32°C (increase) and 0.14 MJ m−2 d−1 (increase) in every decade, respectively. Although wind speed is the most sensitive climatic variable, its change is quite insignificant. However, the change in maximum air temperature is significant, with a MK statistic of Z = 2.33. It can be seen that the increase in maximum air temperature is the main driving force for the obvious increase in PET. Similarly, it can be inferred that the increase in PET in February is due mainly to the increase in maximum air temperature as well.
At Weixi, there is a significant increasing trend in PET in February and November. Taking November as an example, PET in this month is most sensitive to relative humidity, followed by wind speed, maximum air temperature, solar radiation and minimum air temperature. Besides, PET is rather sensitive to the interactions between wind speed and relative humidity. The changes in relative humidity, wind speed, maximum air temperature, solar radiation and minimum air temperature are 0.16% (decrease), 0.04 m s−1 (increase), 0.31°C (increase), 0.02 MJ m−2 d−1 (decrease) and 0.12°C (increase) per decade, respectively. All the changes lead to an increase in PET except for the decrease in solar radiation. Considering the slight decrease in solar radiation and the lower sensitivity of PET to it, the impact of solar radiation on PET is not important.
At Dali, a significant increase in PET occurs in February. In this month, PET is most sensitive to relative humidity, followed by wind speed, maximum air temperature, solar radiation and minimum air temperature. The changes in these variables are 0.36% (decrease), 0.02 m s−1 (decrease), 0.46°C (increase), 0.23 MJ m−2 d−1 (increase) and 0.27°C (increase) per decade, respectively. The decreasing trend in wind speed contradicts the increasing trend in PET; however, considering the small amplitude of the decrease in wind speed, it is not an important factor for the change in PET. PET is most sensitive to relative humidity, while the change in relative humidity is insignificant. Therefore, it can be concluded that the marked increase in PET is due mainly to the significant increase in maximum air temperature.
At Jinghong, there are significant increases in PET in seven months. In particular, PET is most sensitive to solar radiation in all months at this station. For instance, in June, there is a slight increase in solar radiation; moreover, wind speed, maximum air temperature and minimum air temperature increase significantly and relative humidity decreases significantly, all contributing to the significant increase in PET.
From the sensitivity analysis results of the five representative meteorological stations, it can be concluded that the increases in PET in the LRB are due mainly to the significant increase in maximum air temperature and the decrease in relative humidity. In the LRB, forest coverage has decreased in the past several decades (He and Zhang Citation2004). Many studies have revealed that a reduction in forest area leads to regional climate change, which is usually represented by an increase in temperature and a decrease in relative humidity (Henderson-Sellers et al. Citation1993a, Nicholson et al. Citation1998, Solman and Nunez Citation1999, Hilbert et al. Citation2001). Also, temperature increases due to global warming. Therefore, it can be inferred that the increase in maximum temperature and the decrease in relative humidity, which cause PET to increase, result from human activities and global climate change.
3.3.2 Causes of PET changes in the YRB
At Lhazê, an obvious decrease in PET is observed in February. At this month, PET is most sensitive to wind speed according to the results of sensitivity analysis. Wind speed decreases significantly at a speed of 0.32 m s−1 per decade. Therefore, it can be seen that the decline in wind speed is the most important factor leading to the decrease in PET.
At Shigatse, there are significant decreases in PET in February, May and June. In May, PET is most sensitive to wind speed, followed by relative humidity, maximum air temperature, solar radiation and minimum air temperature. PET is rather sensitive to maximum air temperature, but the change in maximum air temperature is very small, increasing by only 0.06°C per decade. In contrast, minimum air temperature increases significantly at a rate of 0.25°C per decade, while PET is least sensitive to it. Hence, maximum and minimum air temperature are not the main factors for the change in PET. The significant decreases in wind speed and solar radiation and the increase in relative humidity lead to the decrease in PET, and PET is most sensitive to wind speed, making this the primary factor for PET change in May.
There is no significant change in PET at Damxung, but May is chosen for illustration because of its relatively greater change. In May, PET is most sensitive to relative humidity, followed by wind speed, maximum air temperature, solar radiation and minimum air temperature, with changes in these variables of 0.70% (increase), 0.17 m s−1 (decrease), 0.14°C (increase), 0.17 MJ m−2 d−1 (decrease) and 0.35°C (increase) per decade, respectively. Additionally, PET is also sensitive to the interactions between relative humidity and wind speed. It is apparent that the change in PET is caused mainly by changes in wind speed and relative humidity.
At Zetang, marked decreases in PET occur from February to November. Taking November as an example, PET is much more sensitive to wind speed and relative humidity in this month compared with other climatic variables. The change in relative humidity is only 0.50% (decrease) per decade, with a MK statistic of Z = −0.87. Relative humidity is not the main factor for the change in PET because of the small amplitude of decrease. Wind speed decreases significantly at a rate of 0.28 m s−1 per decade, which indicates that the decrease in wind speed is the major cause for the decrease in PET.
At Nyingchi, significant decreases in PET are found in August and September, and the conditions in these two months are similar. In August, PET is most sensitive to solar radiation, followed by maximum air temperature, wind speed, relative humidity and minimum air temperature. The changes in relative humidity and maximum air temperature are so small that they can be neglected. Although minimum air temperature increases significantly, PET is least sensitive to it. Thus, relative humidity, and maximum and minimum air temperature have small impacts on the change of PET. The significant decrease in PET is a result of the decreases in solar radiation and wind speed.
It can be inferred from the sensitivity analysis results of the five representative meteorological stations that the decreases in wind speed and solar radiation are the major causes for the decreases in PET in the YRB. This is in accordance with Zhang et al. (Citation2007), who reported that the decreases in wind speed and solar radiation led to a decreasing trend in PET in the Tibetan Plateau in the period of 1966–2003. As for the reasons for the changes in wind speed and solar radiation, decreases in the strength of the regional circulation system of the Asian and Indian monsoons (Gong and Ho Citation2002, Kripalani et al. Citation2002, Chase et al. Citation2003) could be responsible for the decline in wind speed in the YRB, and the decrease in solar radiation may result from global dimming, which is mainly caused by the increase of aerosols in the atmosphere (Stanhill and Cohen Citation2001, Che et al. Citation2005). Air temperature increases significantly in the YRB, which is able to enhance PET as expected. However, the combined effects of the decreased wind speed and solar radiation offset the effects of the rising temperature and cause PET to decrease in general. It is apparent that the pan evaporation paradox exists in the YRB.
The sensitivity analysis results, together with the historic changes in climatic variables, help identify the main causes of PET changes in the LRB and YRB. The key contributors to PET changes in the LRB and YRB are rather different, which explains to the contrasting trends of PET in these two basins.
4 Conclusions
In this study, the trends of PET in the Lancang (LRB) and Yarlung Zangbo (YRB) river basins, southwest China, were analysed and the causes of changes in PET were investigated. PET was calculated using the FAO recommended Penman-Monteith method based on long-term meteorological data of stations in the two basins, and trends of PET were then detected using the trend-free pre-whitening Mann-Kendall test and the diagnosis graph method. Analysis of variance, a global sensitivity analysis method, was applied to quantify the contributions of different climatic variables to PET. With the combination of monthly changes in different climatic variables and the results of sensitivity analysis, the causes of PET changes were derived. The main conclusions of this study are summarized below:
(1) Trends of PET in the LRB and YRB are very different. In the LRB, there are increasing trends in annual PET at all meteorological stations, and most of them increase significantly; monthly PET at five stations shows upward trends in all months, while at other stations it shows upward trends in most months. The results of the diagnosis graphs in the LRB indicate that PET with high values will tend to increase more significantly in the future, which gives warning that proper water resource management should be made in this region, especially for agricultural irrigation. In the YRB, annual PET decreases at all stations, with a significant decrease at half of the stations; there are downward trends of monthly PET in all months at four stations in the YRB, while PET decreases in most months at other stations. It can be observed from the diagnosis graphs of the YRB that, in general, PET shows a decreasing trend during the second half of the data series compared with the first half, and this decrease in PET indicates that the need for irrigation in the semi-arid environment of the YRB may be lower. Moreover, the pan evaporation paradox is not found in the LRB while it exists in the YRB.
(2) There are no large differences in the results of sensitivity analysis in the LRB and YRB. Although the sensitivity of PET to different climatic variables and the interactions between two climatic variables is varied, PET is sensitive to all the five climatic variables at all months for all stations, and also it is sensitive to the interactions between two climatic variables in most cases. However, when considering the sensitivity analysis results together with the historic changes in different climatic variables, the causes of PET changes in these two basins are quite different. It can be inferred that the increase in PET in the LRB is due mainly to the obvious increase in maximum air temperature and the decrease in relative humidity, while the declines in wind speed and solar radiation are the main reasons for the decrease in PET in the YRB. The dominating climatic variables for the changes in PET are different in the LRB and YRB, which leads to the contrasting trends of PET in these two basins.
Supplemental Material
Download MS Word (2 MB)Acknowledgements
The National Climate Centre of China Meteorological Administration is greatly acknowledged for providing meteorological data used in this study. Also, the authors would like to thank the editors and two anonymous reviewers for their useful and constructive comments, which have substantially improved the quality of this manuscript.
Disclosure statement
No potential conflict of interest was reported by the authors.
Supplementary material
Supplementary material data can be accessed here.
Additional information
Funding
Notes
1 FAO: Food and Agriculture Organization of the United Nations.
Related Research Data
References
- Abtew, W., Obeysekera, J., and Iricanin, N., 2011. Pan evaporation and potential evapotranspiration trends in South Florida. Hydrological Processes, 25 (6), 958–969. doi:10.1002/hyp.7887
- Allen, R.G., et al., 1994. An update for the calculation of potential evapotranspiration. ICID Bulletin, 43, 35–92.
- Box, G.E.P., Hunter, W.G., and Hunter, J.S., 1978. Statistics for experiments: an introduction to design, data analysis, and modeling building. New York: Wiley.
- Brutsaert, W. and Parlange, M.B., 1998. Hydrologic cycle explains the evaporation paradox. Nature, 396 (6706), 30. doi:10.1038/23845
- Chase, T.N., et al., 2003. Changes in global monsoon circulations since 1950. Natural Hazards, 29 (2), 229–254. doi:10.1023/A:1023638030885
- Che, H.Z., et al., 2005. Analysis of 40 years of solar radiation data from China, 1961–2000. Geophysical Research Letters, 32, L06803. doi:10.1029/2004GL022322
- Chen, S., Liu, Y., and Thomas, A., 2006. Climatic change on the Tibetan Plateau: potential evapotranspiration trend from 1961–2000. Climatic Change, 76, 291–319. doi:10.1007/s10584-006-9080-z
- Donohue, R., McVicar, T.R., and Roderick, M.L., 2010. Assessing the ability of potential evaporation formulations to capture the dynamics in evaporative demand within a changing climate. Journal of Hydrology, 386, 186–197. doi:10.1016/j.jhydrol.2010.03.020
- Gao, G., et al., 2007. Trend of estimated actual evapotranspiration over China during 1960–2002. Journal of Geophysical Research, 112, D11120. doi:10.1029/2006JD008010
- Gao, G.D., Lu, Y.R., and Li, H.J., 1978. The calculation and distribution of the maximum possible evaporation in China. Acta Geographica Sinica, 33 (2), 102–111.
- Gong, D.Y. and Ho, C.H., 2002. The Siberian High and climate change over middle to high latitude Asia. Theoretical and Applied Climatology, 72, 1–9. doi:10.1007/s007040200008
- He, Y.L. and Zhang, Y.P., 2004. Climatic characteristics and variation tendency of the basin valley of the Lancang River. Journal of Mountain Science, 05, 539–548.
- Henderson-Sellers, A., et al., 1993a. Tropical deforestation: modeling local-to regional scale climate change. Journal of Geophysics Research, 98, 7289–7315. doi:10.1029/92JD02830
- Henderson-Sellers, A., Yang, Z.L., and Dickinson, R., 1993b. The project of intercomparison of land-surface parameterization schemes. Bulletin of the American Meteorological Society, 74, 1335–1349. doi:10.1175/1520-0477(1993)074<1335:TPFIOL>2.0.CO;2
- Hilbert, D.W., Ostendorf, B., and Hopkins, M.S., 2001. Sensitivity of tropical forests to climate change in the humid tropics of north Queensland. Austral Ecology, 26 (6), 590–597. doi:10.1046/j.1442-9993.2001.01137.x
- IPCC. 2013. Climate Change 2013: The Physical Science Basis, Contribution of Working Group I to the Fifth Assessment Report of the Intergovernmental Panel on Climate Change. Cambridge: Cambridge University Press.
- Kendall, M.G., 1975. Rank correlation methods. 3rd. London: Griffn.
- Kousari, M.R. and Ahani, H., 2012. An investigation on reference crop evapotranspiration trend from 1975 to 2005 in Iran. International Journal of Climatology, 32, 2387–2402. doi:10.1002/joc.3404
- Kripalani, R.H., et al., 2002. Indian monsoon variability in a global warming scenario. Natural Hazards, 29 (2), 189–206. doi:10.1023/A:1023695326825
- Li, Z.X., et al., 2014. Spatial and temporal trend of poten-tial evapotranspiration and related driving forces in Southwestern China, during 1961–2009. Quaternary International, 336, 127–144. doi:10.1016/j.quaint.2013.12.045
- Liang, X. and Guo, J., 2003. Intercomparison of land-surface parameterization schemes: sensitivity of surface energy and water fluxes to model parameters. Journal of Hydrology, 279, 182–209. doi:10.1016/S0022-1694(03)00168-9
- Liu, M., et al., 2009. Changing trend of pan evaporation and its cause over the past 50 years in China. Acta Geographica Sinica, 64 (3), 259–269.
- Mann, H.B., 1945. Nonparametric tests against trend. Econometrica : Journal of the Econometric Society, 13, 245–259. doi:10.2307/1907187
- Mokhtari, A. and Frey, H.C., 2005. Sensitivity analysis of a two-dimensional probabilistic risk assessment model using analysis of variance. Risk Analysis, 25, 1511–1529. doi:10.1111/risk.2005.25.issue-6
- Neter, J., et al., 1996. Applied linear statitical models. 4th. Chicago: McGraw-Hill.
- Nicholson, S.E., Tucker, C.J., and Ba, M.B., 1998. Desertification, drought and surface vegetation: an example from the West African Sahel. Bu11etin of the American Meteoro1ogica1 Society, 79, 815–829. doi:10.1175/1520-0477(1998)079<0815:DDASVA>2.0.CO;2
- Pearson, E.S. and Hartley, H.O., 1951. Charts of the power function for analysis of variance tests, derived from the non-central F-distribution. Biometrika, 38, 112–130. doi:10.1093/biomet/38.1-2.112
- Roderick, M.L. and Farquhar, G.D., 2004. Changes in Australian pan evaporation from 1970 to 2002. International Journal of Climatology, 24, 1077–1090. doi:10.1002/(ISSN)1097-0088
- Roderick, M.L. and Farquhar, G.D., 2005. Changes in New Zealand pan evaporation since the 1970s. International Journal of Climatology, 25, 2031–2039. doi:10.1002/(ISSN)1097-0088
- Şen, Z., 2012. Innovative trend analysis methodology. Journal of Hydrologic Engineering, 17 (9), 1042–1046. doi:10.1061/(ASCE)HE.1943-5584.0000556
- Shi, H., Li, T., and Wang, G., 2017. Temporal and spatial variations of potential evaporation and the driving mechanism over Tibet during 1961–2001. Hydrological Sciences Journal, 62 (9), 1469–1482. doi:10.1080/02626667.2017.1332416
- Sobol, I.M., 2001. Global sensitivity indices for nonlinear mathematical models and their Monte Carlo estimates. Mathematics and Computers in Simulation, 55, 271–280. doi:10.1016/S0378-4754(00)00270-6
- Solman, S.A. and Nunez, M.N., 1999. Local estimates of global climate change: a statistical downscaling approach. International Journal of Climatology, 19, 835–861. doi:10.1002/(SICI)1097-0088(19990630)19:8<835::AID-JOC401>3.0.CO;2-E
- Stanhill, G. and Cohen, S., 2001. Global dimming: a review of the evidence for a widespread and significant reduction in global radiation with discussion of its probable causes and possible agricultural consequences. Agricultural and Forest Meteorology, 107 (4), 255–278. doi:10.1016/S0168-1923(00)00241-0
- Tang, Y., et al., 2007. Comparing sensitivity analysis methods to advance lumped watershed model identification and evaluation. Hydrology and Earth System Sciences Discussions, 11 (2), 793–817. doi:10.5194/hess-11-793-2007
- Tang, J., et al., 2015. Climate-induced flow regime alterations and their implications for the Langcang River, China. River Research and Applications, 31, 422–432. doi:10.1002/rra.2819
- Tian, Y., et al., 2012. Detection of trends in precipitation extremes in Zhejiang, east China. Theoretical and Applied Climatology, 107, 201–210. doi:10.1007/s00704-011-0472-2
- Xu, Y.P., et al., 2016. Historical pan evaporation changes in the Qiantang River Basin, East China. International Journal of Climatology, 36, 1928–1942. doi:10.1002/joc.4470
- You, Q.L., et al., 2007. Climate change over the Yarlung Zangbo River Basin during 1961–2005. Journal of Geographical Sciences, 17 (4), 409–420. doi:10.1007/s11442-007-0409-y
- Yue, S., Pilon, P., and Phinney, B., 2002. The influence of autocorrelation on the ability to detect trend in hydrological series. Hydrological Processes, 16 (14), 2881–2898. doi:10.1002/hyp.1095
- Yue, S., Pilon, P., and Phinney, B., 2003. Canadian streamflow trend detection: impacts of serial and cross correlation. Hydrological Sciences Journal, 48 (1), 51–63. doi:10.1623/hysj.48.1.51.43478
- Yue, S. and Wang, C.Y., 2002. Applicability of prewhitening to eliminate the influence of serial correlation on the Mann-Kendall test. Water Resources Research, 38 (6), 1068. doi:10.1029/2001WR000861
- Zhang, Y.Q., et al., 2007. Trends in pan evaporation and reference and actual evapotranspiration across the Tibetan Plateau. Journal of Geophysical Research, 112, D12110. doi:10.1029/2006JD008161
- Zheng, H., et al., 2009. Assessing contributions to pan evaporation trends in Haihe River Basin, China. Journal of Geophysical Research, 114, D24105. doi:10.1029/2009JD012203