
 ?Mathematical formulae have been encoded as MathML and are displayed in this HTML version using MathJax in order to improve their display. Uncheck the box to turn MathJax off. This feature requires Javascript. Click on a formula to zoom.
ABSTRACT
The temporal variations in electrical conductivity and the stable isotopes of water, δD and δ18O, were examined at Chhota Shigri Glacier, India, to understand water sources and flow paths to discharge. Discharge is highly influenced by supraglacially derived meltwater during peak ablation, and subglacial meltwaters are more prominent at the end of the melt season. The slope of the best fit linear regression line for δD versus δ18O, for both supraglacial and runoff water, is lower than that for precipitation (snow and rain) and surface ice, indicating strong isotopic fractionation associated with the melting processes. The slope of the local meteoric water line (LMWL) is close to that of the global meteoric water line (GMWL), reflecting that the moisture source is predominantly oceanic. The d-excess variation in rainwater confirms that the southwest monsoon is the main contributor during summer while the remainder including winter is mostly influenced by westerlies.
Editor A. Castellarin;Associate editor Not assigned
1 Introduction
The snow and ice accumulated in High Mountain Asia acts as a source of water for much of the Indian sub-continent’s population (Immerzeel et al. Citation2010). Meltwater is a vital component of streamflow for the Himalayan river systems (Rai et al. Citation2009, Jain et al. Citation2011). The estimated annual snow- and glacier-melt contribution to Himalayan rivers ranges from 35 to 60% (Singh et al. Citation1997, Singh and Jain Citation2002, Kumar et al. Citation2007). These large summer contributions to river flow raise fears that the retreat of Himalayan glaciers could pose a significant problem for the large (1.5 billion) and dense populations dependent on these rivers for their water supply. Our present understanding of the hydrological characteristics of the glaciated basins in the Indian Himalaya relies on investigations using a variety of approaches, including water budget models (Jeelani et al. Citation2012) and snowmelt runoff models (SRM) (Wulf et al. Citation2016) such as SNOWMOD (Arora Citation2010) and the SWAT model (Junghans et al. Citation2011). These models all report some level of uncertainty involved in determining the dominant end member contributions to glacier discharge, particularly in changing climatic scenarios (Junghans et al. Citation2011, Yin et al. Citation2017). Hence, there is a clear need for further field-based studies that address the end member melt contributions to runoff, and how these may change over the melt (ablation) season.
Isotope-based hydrograph separation (IHS) has the potential to reduce the uncertainty in end member contributions to runoff, both in temperate and in glacierized catchments (Dincer et al. Citation1970, Mook et al. Citation1974, Firtz et al. Citation1976, Sklash et al. Citation1976; Hooper et al. Citation1990, Liu et al. Citation2004, William et al. Citation2006, Klaus et al. Citation2013, Rodriguez et al. Citation2016, Sun et al. Citation2016, Penna et al. Citation2014, Penna et al. Citation2017, Engle et al. Citation2016). To date, there are only a few studies in the Indian Himalaya that have adopted an isotope-based mechanism to quantify the contributions of different components of glacier melt to discharge (Rai et al. Citation2009, Citation2016, Ahluwalia et al. Citation2013, Jeelani et al. Citation2013, Citation2016). These studies have shown that it is possible for the stable isotopes of water to characterize runoff components, such as rain, snowmelt and glacier ice, but a significant confounding factor is isotopic fractionation during daily melting and freezing cycles. Studies in other glacial environments show that there is decrease in the slope of the linear δD–δ18O regression line from precipitation to snowpack, from 8.0 to 6.4–6.9, with a further decrease in discharge water, to 4.3 (Hashimoto et al. Citation2002, Zhou et al. Citation2008a, Citation2008b). The latter observation suggests that it may be possible to differentiate between supraglacial runoff sources with short-term storage (rain, snow and glacier ice), which presumably dominate runoff during the peak ablation season, with longer-term stored meltwater, which is subject to freeze and melt processes.
This study extends work on stable isotope tracers of glacier runoff components to Chhota Shigri (CS) Glacier, in the Indian Himalaya. The aim is to establish a baseline study of how the stable isotopes of water, in addition to electrical conductivity measurements, can be used to establish how the dominant end members (including both supraglacial and subglacial melt) contribute to glacial runoff during the peak ablation season.
2 Study area
The Chhota Shigri Glacier, India, was chosen as the study site for the following reasons:
The glacier is influenced by both Westerlies and the Indian summer monsoon, and has the longest series of daily morning and evening runoff isotope data available during the ablation season in this hydro-climatological setting.
Assessment of runoff components and their temporal variability along with an isotopic characterization of the catchment is still missing.
The glacier is considered to be representative of those in the valley, and so changes happening here can be inferred to be happening at other Himalayan glaciers of the Lahaul Spiti valley.
Chhota Shigri Glacier (32.28°N, 77.58°E) is a benchmark glacier identified by the World Glacier Monitoring System (WGMS), located in the Chandra-Bhaga basin of the Pir Panjal range of the Lahaul Spiti region (Himachal Pradesh, India). It is a valley-type glacier in a monsoon arid transition zone of the Western Himalaya. It is 9 km long with the snout and highest point at 4050 and 6263 m a.s.l., respectively. The glacier covers an area of 15.7 km2 and has a basin area of 34.7 km2. The mean orientation of the glacier is north (Wagnon et al. Citation2007) and it has branches differently oriented in the accumulation zone (Azam et al. Citation2014) (). The glacier has a clear accumulation and ablation zone, and the ELA (equilibrium line altitude), where the net balance is zero, lies at around 4950 m a.s.l. (Wagnon et al. Citation2007). The lower part (~1 km) of the ablation area is fully covered with supraglacial debris, which constitutes 3.4% of the glacier (Vincent et al. Citation2013). The glacier surface contains several moulins, which route surface meltwater rapidly to the subglacial drainage system. The glacier is also traversed by a number of crevasses near the ELA, characterized by splitting of ice in vertical planes due to steepening of the gradient of glacier flow. The snout of the glacier is very well identified, positioned in a valley from which a single proglacial stream originates and similar to the orientation of the glacier; stream drainage is north oriented, and subsequently extends about 2.5 km downstream from the snout and flows into the Chandra River, a tributary of the Indus River, at a right angle (). A detailed summary of the glacier features is documented in .
Table 1. Detailed description of the Chhota Shigri Glacier.
Figure 1. Study area along with sample locations: (a) glacier ice surface, (b) supraglacial channel and (c) discharge measurement site (~3800 m a.s.l.) in the Chhota Shigri Glacier catchment.
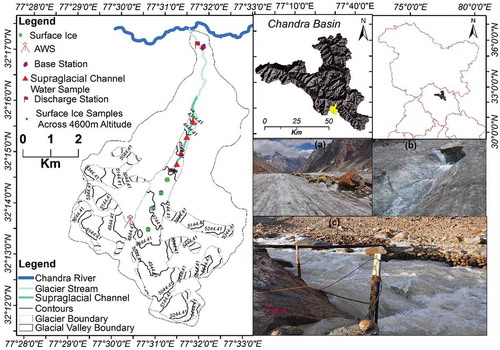
The Chhota Shigri catchment is underlain by granite, migmatite, gneiss, biotite and phyllite (Kumar and Dobhal Citation1997). Rohtang gneiss and chalcopyrite can be found in the lateral moraines up to an altitude of 4700 m a.s.l. Pyrites are present in small veins traversing the granitic glacier bedrock (Kumar Citation1987, Sharma et al. Citation2013). Veins of stibnite in the granitic rocks have been reported around lateral moraines (Katoch Citation1989).
Chhota Shigri Glacier receives precipitation from two different atmospheric circulations, the Indian summer monsoon and mid-latitude Westerlies in summer (May–September) and winter, respectively. Most (80%) annual precipitation occurs in winter (Azam et al. Citation2014). According to (Azam et al. Citation2014), the meteorological conditions at Chhota Shigri have month-to-month variability and net radiation (shortwave and longwave) is the main cause of melting, followed by turbulent fluxes.
3 Materials and methodology
3.1 Sample collection
This is a preliminary study in the Indian Himalaya, carried out at subglacier reservoir scale, that deals particularly with the glacier system and its processes involving isotopes and electrical conductivity (EC) as a tracer. The study field work at Chhota Shigri Glacier, Western Himalaya, was planned from 15 June to 5 October 2015. During the study period, samples of winter snowpack, rainfall, glacier surface ice, supraglacial meltwater, subglacial meltwater and stream water were collected. These samples give a complete representation of the entire ablation period, except the winter snowpack, which is used to represent winter precipitation. Stream water samples (n = 120) were collected twice daily (at 08:00 and 18:00 h, local time) whenever good weather allowed access to the discharge station of Chhota Shigri Glacier, between 10 June and 4 October 2015. The various other identified water source components (end members) were sampled as follows ():
Snowpack accumulated during winter (450 cm) (n = 10) was sampled at depths of 50 cm intervals at 5196 m a.s.l. during June 2015.
Glacier surface ice samples were collected from two different transects – transverse (4600 m a.s.l.) (n = 14) and longitudinal (n = 17) – on the clean glacier surface in order to gather the complete signature.
Rainwater samples (n = 35) were sealed immediately after rain stopped and given focus to prevent atmospheric exchange processes of the samples.
Supraglacial meltwater samples (n = 9) were collected from different altitudes after the formation of supra-channels in mid-June 2015.
Negative ambient air temperature and low incoming solar radiation during late ablation (end of September onwards) cause surficial melting to cease and the resultant supraglacial channel stops completely. Low discharge in the proglacial stream was then thought to be contributed mainly by subglacial ice melt. The stream discharge during this lean period was estimated as the signature of the subglacial component and sampled twice daily (n = 9) until the end of the field expedition (early October 2015). A detailed description of the number of samples and sampling period is presented in .
Table 2. Detailed description (number of samples, sampling period and sampling frequency) of water source components (end members) and mixed components (glacial discharge) at Chhota Shigri Glacier.
All water samples were collected in 50-mL high-density plastic bottles with a double cap (to prevent moisture exchange with the atmosphere and evaporation loss). The samples were transported to the laboratory and kept at 4°C before analysis for stable isotopes.
3.2 Analysis
Electrical conductivity (EC; µS/cm) of meltwater samples was measured at the sampling site with the help of a portable electrode (HACH – Sension 150). Calibration of the instrument was done using a 1000 µS/cm (at 25°C) NaCl standard before the measurement of EC. Accuracy of determination was maintained to ±1–2% by measuring the known standard at regular intervals. Analytical precession of repeat measurements lies in the range ±10–15%.
Discharge was calculated using hydrometric techniques (area–velocity) at the gauging site. The cross-section area of the stream channel was measured using the dipsticks method. A graduated staff gauge and water level recorder (OTT Orpheus mini; accuracy ±0.05%) were installed at the gauging site for manual and automatic recording of water-level fluctuations, respectively. The OTT set-up at the discharge station was given a time step of 30 min for each determination. A current meter was used for the measurement of depth-integrated velocity of the stream during early ablation (2010). These parameters associated with discharge were used to establish an initial rating curve for the Chhota Shigri stream. Taking account of technical and instrumental limitations along with the rough bed of the stream (due to transport of boulders through the water), particularly in the peak ablation period (July and August), expected errors in discharge measurement are believed to be around 5–10% of the total. The expected errors lie in a similar range to those reported from Gangotri Glacier (±5%; Haritashya et al. Citation2006) and Cordillera Blanca, Peru (10%; Mark and Seltzer Citation2003).
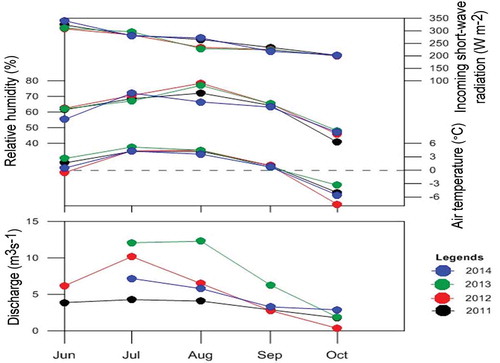
Meteorological variability in monthly average temperature, relative humidity and incoming solar radiation for 2011–2014 was recorded at an automatic weather station installed at an altitude of 4863 m a.s.l. on Chhota Shigri Glacier. To understand the glacier stream hydrodynamics, monthly observations of hydro-meteorological variation during the ablation seasons of 2011–2014 were recorded at Chhota Shigri Glacier and are presented in .
Figure 2. Hydrological and meteorological observations at Chhota Shigri Glacier for the complete summer ablation season.
The stable isotopes of H2O (δD and δ18O) of the samples were measured using a Picarro (L2140-i) analyser with cavity ring-down spectroscopy (CRDS). A very small aliquot of sample (2.0 µL) was required for optimum precision. Each sample analysis was repeated five times and the first two values were excluded to improve the precision of the results. The obtained analytical precision for δD and δ18O was 0.24‰ and 0.07‰, respectively. Three international standards (VSMOW, GISP and SLAP) were used for normalization of our isotopic records.
3.3 Methodology
The glacier melts both on the surface and at the base. Hence, meltwater in proglacial streams is mainly produced supraglacially and subglacially (Knight Citation2011). Supraglacial melting is the main characteristics of the peak ablation season, while subglacial melting persists for the entire year (Singh and Singh Citation2001). Thus, selection of end members is based on the assumption that glacier melt is mainly composed of a highly solute-concentrated, delayed flow component (subglacial melt) and an ionically-diluted, quick-flow component (supraglacial melt), which act as major sources during low and high streamflow, respectively (Collins Citation1979). This approach is useful in reconstructing the temporal variation of the discharge of the different end members to the proglacial stream.
A simple water balance and chemical mass balance equations were used for quantification purposes:
where Q is the water component and C is the average tracer (δ18O and EC) concentration; and subscripts st, sub and sup refer to stream water, subglacial component and supraglacial component, respectively.
On the basis of Equations (1)–(3), we estimated the percentage contributions made by supraglacial and subglacial components to the glacier discharge during the peak ablation period. The uncertainties in component quantification were calculated for both tracers (δ18O and EC), using the Gaussian error propagation technique, as described by Liu et al. (Citation2004). The uncertainties were found to be 17% and 1% for δ18O and EC, respectively. The higher uncertainty (17%) is due to the smaller differences in isotopic composition of each component and the large variability (expressed by standard deviation, SD).
To trace the origin of the moisture source, Craig (Citation1961) and Dansgaard (Citation1964) defined the parameter deuterium excess (d-excess = δD − 8δ18O + 10), which is nothing but the intercept of the best fit line of regression between δD and δ18O. It shows spatio-temporal variation (Jouzel et al. Citation1997) and is mainly controlled by the temperature, relative humidity and wind speed of the air mass over the moisture source surface (Merlivat and Jouzel Citation1979). Similarly, the present study used d-excess to distinguish moisture sources in different seasons.
4 Results and discussion
4.1 Tracer concentration in different water source components and mixed stream water
The different sources of water along with glacier discharge in the CS glacierized catchment in the Chandra basin showed marked variability in their tracer (EC and δ18O) concentrations (). Rainfall and winter snowpack samples showed large variability in their isotopic composition characterized by most positive and most negative values in δ18O, with medians of −11.9 and −14.7‰, respectively. The glacier surface ice and supraglacial meltwater showed minor differences between their isotopic compositions (median δ18O: −12.8 and −13.8‰, respectively). Stream water was most depleted in its isotopic composition compared to its end members and showed slight variation in the morning and evening discharge (median δ18O: −14.8 and −14.0‰, respectively), which became wider at the seasonal scale, having enriched (−13.6‰) and depleted (−14.5‰) δ18O during peak and late ablation seasons, respectively. This variation in stream water is attributed to different sources contributing during morning and evening flow of stream discharge. The whiskers range (WR) of δ18O in rainfall was found to be largest among all other end members, whereas it is observed to be insignificant for glacier components (glacier surface ice, supraglacial channel and stream water). Large δ18O variation (−1.08 to −25.55‰) in the rainfall thus provides an indication of seasonal control that derives moisture from different sources.
Figure 3. Box-and-whisker plots for (a) δ18O and (b) electrical conductivity of different types of water source and stream samples. The whiskers represent the 10th and 90th percentiles, while the box limits indicate the 25th and 75th percentiles, and the lines inside the box represent the median. R: rainfall; SP: winter snowpack; GS: glacier surface ice: SC: supraglacial channel water; MSTR: morning stream water; ESTR: evening stream water (where morning is 08:00 h and evening 18:00 h).
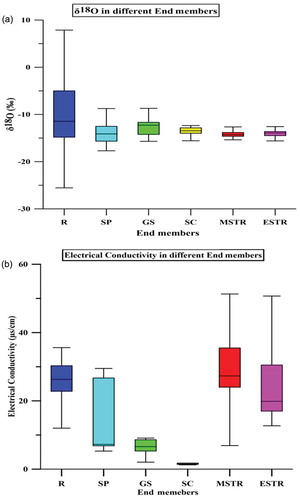
Electrical conductivity (as a surrogate representative of constituent ions) of all water components ()) showed an inverse relationship when compared to their isotopic compositions. The winter snowpack was marked by low EC (median: 6 µS/cm), while the EC of rainfall was higher (median: 26 µS/cm), reflecting the influence of the southwest monsoon. Glacier components such as surface ice and supraglacial meltwater showed very low ionic concentrations (median EC: 5 and 2 µS/cm, respectively) and were thus considered as quickflow components. Stream water showed large variations in median EC at seasonal scale of peak ablation (30 µS/cm) and late ablation (51.5 µS/cm), and smaller variation at the diurnal scale, with 28 µS/cm at 08:00 h and 18 µS/cm at 18:00 h. Variability in EC at different temporal scales follows an inverse relationship with the discharge pattern of the glacier stream, which is in accordance with previous studies at Chhota Shigri Glacier (Sharma and Ramanathan Citation2013) and in the Dokriani Bamak Glacier basin (Hasnain et al. Citation1999a). Temporal variation of tracer concentration in stream water thus acts as an indicator of major end members in different periods of streamflow.
4.2 Variability in moisture sources and isotopic characterization of rainwater
The local meteoric water line (LMWL) describes the linear association between δD and δ18O of precipitation. The region-specific microclimate (including air mass mixing, evaporation effects), along with moisture sources, determines both the isotopic composition of precipitated water (snow, rainwater) and the LMWL (Rozanski et al. Citation1993). The LMWL for the upper catchment of the Chandra basin in the Western Himalaya is shown in ), using the rainwater samples collected during each rain event for the whole season (June, July, August, September and October) at Chhota Shigri base station, and gives the following best fit linear regression equation: δD = 7.95δ18O + 21.4 (n = 35, R2 = 0.98). This relationship has a similar slope, but a much higher intercept when compared with both the LMWL of Western Himalaya (δD = 7.95δ18O + 11.51) (Kumar et al. Citation2010) and the global meteoric water line (GMWL): δD = 8δ18O + 10 (Craig Citation1961); δD = 8.20 ± 0.07 δ18O + 11.27 ± 0.65 (Rozanski et al. Citation1993). The established LMWL from this study is also similar in slope and intercept to the LMWL line of Middle Himalaya (δD = 8.9δ18O + 22.26) (Tian et al. Citation2005) and to the Mediterranean meteoric water line (MMWL) (δD = 8δ18O + 22) (Gat and Carmi Citation1970). The high intercept is due to the process of mixing of air moisture from different sources in different seasons (Tian et al. Citation2005), which is confirmed by the d-excess variation ()) and large range in δ18O composition ()).
Figure 4. (a) Regression line (dashed green) between δ18O and δD values of rainwater samples (n = 35) at Chhota Shigri Glacier during the entire ablation season. Meteoric water lines (MWL) are as follows: dashed brown: Mediterranean MWL, dashed blue: Western Himalayan MWL, and solid black: global MWL. (b) Variation of d-excess and isotope (δ18O) in rainwater samples collected at the base station of Chhota Shigri Glacier (CS) during June–October.
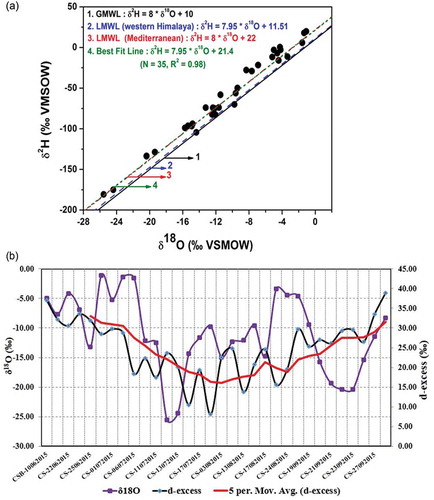
It was found that the southwest monsoon is dominant only for the short stretch during summer (low d-excess: <20%) while the remaining period in winter is contributed by westerly (high d-excess: >25%) ()), which is supported by winter snowpack samples (signature for winter precipitation in the region) having d-excess (25) close to the LMWL. This finding is in line with the previous observation at Chhota Shigri Glacier where the southwest monsoon accounts for only 21% of the annual precipitation while the rest is from the mid-latitude Westerlies that govern 79% of total precipitation (Azam et al. Citation2014). The pattern of d-excess shifting with the seasons leads to high slope and intercept between the δD–δ18O regression line ()). Its low (<15%) and high (15–24%) shifts are the signatures of an active period of southwest monsoon and Westerlies, respectively (Tian et al. Citation2005, Jeelani et al. Citation2013).
4.3 Isotopic composition of glacier components (glacier surficial ice, supraglacial channel, subglacial channel)
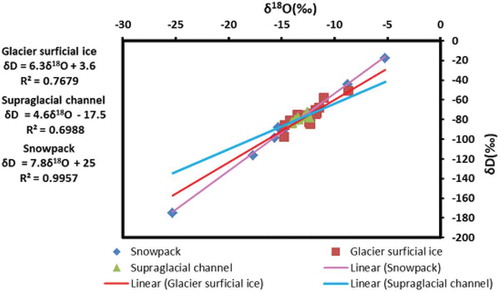
Glacier surficial ice samples collected below the equilibrium line altitude (ELA) from the bare glacier surface during peak ablation (July and August) cover an isotopic range between −8.70 and −14.70‰ in δ18O and −50.97 to −97.7‰ in δD. The regression line for δD–δ18O of this subset of samples has a lower slope (6.3) in comparison to that (7.8) of the winter snowpack (), indicating secondary fractionation associated with sublimation during the deposition and melt freeze cycle (Stichler et al. Citation2001). Supraglacial meltwater collected at different elevations in the ablating zone showed isotopic ranges of δ18O (−12.3 to −14.05‰) and δD (−72.73‰ to −84.22‰) (). The regression line obtained with the help of these sets of data has a slope (4.6) that is much lower in comparison to that of surficial ice samples (), reflecting the melt fractionation processes (Hashimoto et al. Citation2002, Zhou et al. Citation2008a, Citation2008b). Subglacial meltwater showed small variability in isotopic composition, being in the ranges −13.32 to −14.75‰ for δ18O and −78.70 to −86.31‰ for δD. The regression line for δD–δ18O of subglacial meltwater has a slope (4.5) nearer to that of supraglacial melt (4.6). The similar slopes of these meltwaters drained from two different components of the glacier (subglacial and supraglacial) are attributed to the common effect of fractionation associated with melting processes in the Chhota Shigri Glacier system. The linear relationship δD–δ18O of various end members and their derived parameters are illustrated in .
Figure 5. Relationship between δD and δ18O values of glacier surface ice, winter snowpack and supraglacial meltwater collected during the monitoring period at Chhota Shigri Glacier.
4.4 Isotopic composition of stream water
Stream water showed temporal variability in its isotopic composition during the ablation period. Diurnal variation in isotopic characteristics of stream is smaller, but gets wider and more remarkable at the seasonal scale (peak ablation and late ablation) (). This variability is directly related to the runoff characteristics of streamflow (having enriched and depleted isotopic composition during high and low flow, respectively) (Ohlander et al. Citation2013). Variation in stable isotopic composition of stream water can be attributed to the different water source components in ablation periods. Various end members, on mixing, together form composite water that flows out of the snout as proglacial stream water. On mixing, the identical signature of tracers of end members becomes attenuated (Dalai et al. Citation2002a, Maurya et al. Citation2011) and flows into a composite proglacial stream that is characterized by the mixed signature of its various end members. Thus, the isotopic composition of stream water showed a narrow isotopic range (see ), box limit: 25th and 75th percentiles) compared with its other end members at the glacier reservoir scale. The δD–δ18O regression slope and intercept of stream water was monitored each month during the ablation period and is presented in . The slope for stream water is observed to be similar to that for meltwater drained from two different systems of the glacier (supraglacial: 4.6 and subglacial: 4.5), highlighting their role as end members of the stream. Meltwater (supraglacial and subglacial) and stream water showed lower slopes and intercepts in their δD–δ18O relationship when compared with other components of the glacier reservoir of Chhota Shigri ( and ). This significant difference in slope of melt and non-melt components of the glacier clearly indicates that isotopic fractionation is associated with glacier melting processes (Zhou et al. Citation2014).
Table 3. Parameters of the linear relationship between δ18O and δD for all types of end members (Chhota Shigri Glacier).
Table 4. Detailed summary of discharge data for stable isotopes and electrical conductivity during study period.
Table 5. Parameters of the linear relationship between δ18O and δD for all stream water (Chhota Shigri Glacier).
4.5 Identification of end members
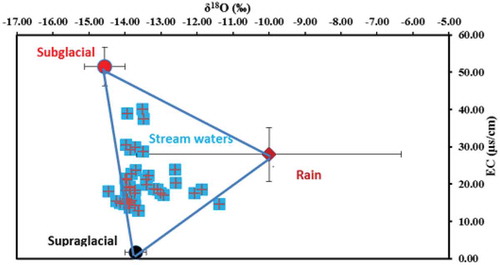
The glacier components, such as winter snowpack, dissipated as surficial melt in the ablation season and quickly flowed into the supraglacial channel before draining into the moulin and then exiting at the glacier snout. Winter snowpack collected in early summer is not considered as a potential end member because of its early depletion and not having direct input to the proglacial stream. Rainwater can exert an influence on the isotopic composition of stream water (rainfall–runoff characteristics) (), but this study has not included rain as a significant contributor to glacier discharge for the following reasons. First, the sampling site is close to the glacier snout, thus minimizing the contribution of rainfall falling on the proglacial plain. Second, rainfall was intermittent in nature and only 30–40 rain events were encountered during the study period, amounting to 2.38 mm (on average) per event measured by a precipitation gauge (Geonor T-200B) installed near the discharge site. The total rainfall was therefore 7.14–9.52 cm. The total glacier surface melt as estimated by a glaciological method during the same period was −2.27 meter water equivalent (m w.e). Finally, rainfall passes quickly through the glacier drainage system, and does not greatly influence runoff between precipitation events (De Walle and Rango Citation2008). The δ18O (‰) of all stream water samples during peak ablation season plotted against EC (µS/cm) falls within a triangular domain defined by the average δ18O and average EC of rainfall, supraglacial and subglacial melt. The large shifting of stream waters towards vertices of supra- and subglacial end members in the triangular domain of the mixing plot, shown in , clearly reveals the importance of supra- and subglacial components as the dominant end members at the glacier reservoir scale. To observe significant differences in tracer concentrations among identified end members, statistical description () and a parametric statistical test, the t-test, were performed, with results at a significance level of α = 0.05, as shown in .
Table 6. Statistical description of the tracers describing potential end members of stream water. SD: standard deviation.
Figure 6. Rainfall–runoff characteristics the during ablation season at Chhota Shigri Glacier stream.
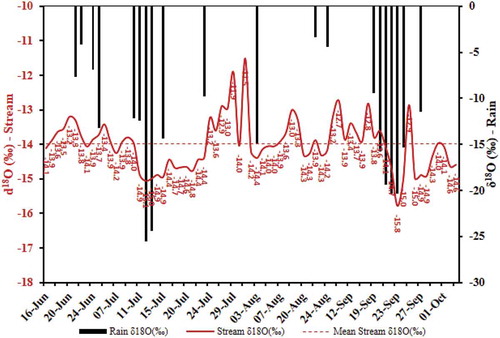
Figure 7. Mixing plot between δ18O (‰) and EC (µS/cm) of end members including average values of samples collected twice daily from main stream (morning: 08:00 h; evening: 18:00 h) during peak ablation.
4.6 Glacier runoff characteristics during ablation season
There are no other stream networks joining the proglacial stream between its origin at the snout of Chhota Shigri and the gauging station (2.5 km downstream), and so the runoff pattern and its compositional variation is mostly a representation of the characteristics of Chhota Shigri Glacier. Monthly mean discharge of the Chhota Shigri Glacier for the period 2011–2014 is shown in . The discharge of glacier runoff increases in July and August, and declines to its minimum flow during late September and October (Singh Citation2016). More than 50% of the total runoff occurs during July and August (Singh Citation2016), whereas late September and October account for less than 15% of the total discharge. This observation is comparable to the discharge estimated in the Gangotri Glacier in India (56.8%) (Singh et al. Citation2006).
4.7 Temporal dynamics of tracer concentration in stream water
4.7.1 EC and δ18O in stream water
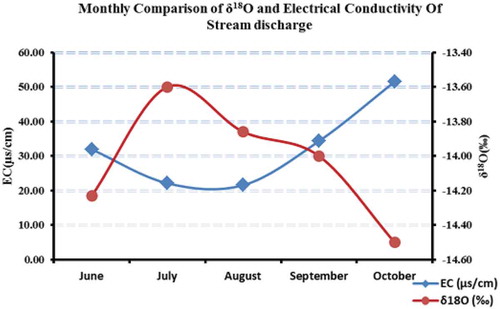
The monthly variation in δ18O and EC of the stream waters is shown as a box plot () and the monthly mean relationships of these tracers (EC vs δ18O) are presented in . To observe statistical significance in the variation of δ18O and EC, a nonparametric statistical test, the Mann-Whitney test, was performed with a significance level of α = 0.05. It was found that both tracers (δ18O: p = 0.01; EC: p = 0.01) are significantly different at diurnal and seasonal scales. The variation in isotopic composition as well as EC in stream water is observed narrowly at the diurnal scale (morning and evening), but this variation gets stronger at the seasonal (early, peak and late) scale. Although both tracers show the same pattern of variation with varying seasons, they are inversely related in their composition. The inverse relationship between these tracers is also identified by Maurya et al. (Citation2011) and Penna et al. (Citation2014) in their studies during the ablation season. The observation of different dynamics in the tracer composition sheds some light on the shifting of the major contributors to the glacier stream along with its associated glacial processes. The depletion of δ18O in stream water and the highly ionized water from the morning samples and at the end of the ablation season (June and October) is the outcome of the subglacial environmental processes. In contrast, the enrichment in δ18O composition and low EC values of stream water for the evening samples and at peak ablation season (July to early September) reflects processes associated with the supraglacial system. This is further substantiated in the discussion in Section 4.7.2.
Figure 8. Monthly variation of (a) morning δ18O (‰), (b) evening δ18O (‰), (c) morning EC (µS/cm), and (d) evening EC (µS/cm) in the glacier stream. The whiskers represents the 10th and 90th percentiles, while the box limits indicate the 25th and 75th percentiles and the line inside the box represents the median.
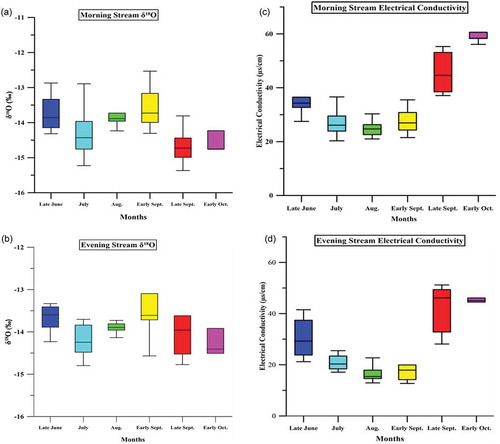
Figure 9. Temporal dynamics and comparison of monthly average values of tracers δ18O and EC in stream discharge samples taken consistently daily (morning: 08:00 h; evening: 18:00 h).
4.7.2 Supraglacial and subglacial contributions to runoff
The bulk meltwater in the proglacial stream can be produced supraglacially and subglacially (Knight Citation2011). Surficial melt of snow and ice (supraglacial meltwater) is induced by various factors, e.g. insolation, turbulent heat transfer and precipitation, whereas basal melting (subglacial meltwater) is primarily governed by geothermal heating, frictional heating due to abrasion (glacier movement) and pressure fluctuations during flow across the bed (Knight Citation2011). Glacier surface melting increases with the progress of summer and forms a supraglacial channel which includes melt of all short resident glacial components, mainly snow and surficial ice. Supraglacial melting is seasonal and occurs mainly during the ablation season, while subglacial melting, although more limited, occurs throughout the year (Singh and Singh Citation2001). Once the supraglacial channel is blocked, proglacial streamflow in low discharge mode is then believed to be supplied from the subglacial ice melting. The identified contributors are compositionally different from each other, i.e. having enriched δ18O and low EC for supraglacially drained meltwater and depleted δ18O and high EC for subglacially drained meltwater. These differences in tracer composition are related to different environmental processes that govern the supra- and subglacial ecosystems. Supraglacially drained melt is acquired mainly from new water (short residence time) such as surficial snow, while subglacial melt is generated through glacier-bed ice friction. Thus, melt governed mainly by snow and ice shows enriched and depleted isotopic composition, respectively, due to different density in the two phases (the denser the phase, the more it tends to be enriched in heavier isotopes) (Stichler Citation1987). Further, low EC in supraglacial channel water could result from short residence times with negligible rock–water interaction at the clean glacier surface, whereas high EC in subglacially derived meltwater is associated with its longer residence times due to slow streamflow and lesser dilution effect, along with subglacial acquisition processes (Collin Citation1979). The statistical analysis of the tracer compositions is shown in and . The percentage contribution made by the identified end members (supraglacial and subglacial components) to the stream in the peak ablation season was estimated with the help of a two-component mixing model using the tracers δ18O and EC. This is based on the results of previous studies that quantified the contribution by various end members using stable isotopes and EC (detailed in ) and followed Equations (1)–(3) (see Section 3.3). The results are presented in .
Table 7. Statistical differences among potential end members on the basis of tracers (δ18O and EC) performed with parametric t-test significant at α = 0.05.
Table 8. Previous studies that account for stable isotopes in hydrograph separation.
Table 9. Average (peak ablation) glacial end member (supraglacial and subglacial) contributions to glacial discharge based on tracer (δ18O and EC) data. The uncertainty is computed according to a Gaussian error propagation technique (Liu et al. Citation2004).
Continuous estimation of the contribution made by different glacial system components (supraglacial and subglacial) to the proglacial stream and their validation with the glacier mass balance study is important mainly because increased melt of the subglacial component (long-term storage of water) in comparison with supraglacial (short-term storage of water) might lead to serious deterioration of glacier health in a changing climatic scenario.
The above analysis and outcomes have certain limitations. Winter sampling at very high elevations was not carried out due to the dangerous terrain and the lack of logistical support for work in this region (e.g. political sensitivity, heavy snowfall and limited transport facilities). This prevents a better estimation of the various end members and comparison on a large extended dataset for annual characterization of glacial processes and discharge dynamics. Thus, the present research dealt only with summer processes of the glacier system. Solid precipitation (snowfall) is the major winter phenomenon, contributing mass to glaciers. Since we did not encounter snowfall events during the summer sampling, the tracer index of snowmelt could not be acknowledged. Hence, it was not included as an end member of stream discharge.
5 Conclusions
This study provided new insights into the dynamics of runoff components during the peak melt season induced by elevated summer temperatures in the glacierized catchment of Chhota Shigri. Further, the findings of this research could help to infer processes and tracer dynamics in other glacier systems of the Lahual and Spiti valley as well as glaciers having similar terrain and climatic setting, leading to deeper insight into the identification of end members and their contributions to rivers at the basin scale. The main results and conclusions of this study are as follows:
The temporal variation in tracer (EC and δ18O) concentrations and their different dynamics reflects the shift in the dominant end members to proglacial discharge during the ablation period.
The similar slope (δD–δ18O regression) for stream water and its high shift towards the supraglacial component in the mixing plot confirms that the stream discharge is highly influenced by supraglacially derived meltwater, which is estimated to be the major contributor, followed by subglacial melt.
The δD–δ18O regression slope for the meltwater (supraglacial and stream water) is lower than the precipitated (snowpack and rain) as well as glacier surface ice, indicating strong fractionation associated with the melting processes.
The slope of the local meteoric water line (LMWL) is close to that of the global meteoric water line (GMWL), reflecting that the moisture source is predominantly oceanic at the CS glacierized basin. The d-excess variation in rainwater confirms that the southwest monsoon (low d-excess) is the main contributor for the short period during summer, while the remainder including winter is mostly influenced by mid-latitude Westerlies (high d-excess).
Acknowledgements
NK thanks the CSIR for a fellowship grant. ALR and NK thank JNU for its support and providing the facilities necessary for the study. NK also acknowledges other members of the glacier research group, SES, JNU for their cooperation in the field.
Disclosure statement
No potential conflict of interest was reported by the authors.
Additional information
Funding
References
- Ahluwalia, R.S., et al., 2013. Assessment of snowmelt runoff modelling and isotope analysis: a case study from the western Himalaya, India. Annals of Glaciology, 54 (62). doi:10.3189/2013AoG62A133
- Arora, M., 2010. Estimation of melt contribution to total streamflow in River Bhagirathi and River DhauliGanga at Loharinag Pala and Tapovan Vishnugad project sites. Journal of Water Resource Prot, 2 (7), 636–643. doi:10.4236/jwarp.2010.27073
- Azam, M.F., et al., 2014. Processes governing the mass balance of Chhota Shigri Glacier (western Himalaya, India) assessed by point-scale surface energy balance measurements. The Cryosphere, 8, 2195–2217. doi:10.5194/tc-8-2195-2014
- Buzek, F., Hruska, J., and Kram, P., 1995. 3-Component model of runoff generation, Lysina catchment, Czech-Republic. Water Air Soil Pollution, 79 (1–4), 391–408. doi:10.1007/BF01100449
- Collins, D.N., 1979. Quantitative determination of the subglacial hydrology of two Alpine glaciers. Journal of Glaciology, 23 (89), 347–362. doi:10.1017/S0022143000029956
- Craig, H., 1961. Isotopic variations in meteoric waters. Science, 133, 1,702–1,703. doi:10.1126/science.133.3465.1702
- Dalai, T.K., Bhattacharya, S.K., and Krishnaswami, S., 2002a. Stable isotopes in the source waters of the Yamuna and its tributaries: seasonal and altitudinal variations and relation to major cations. Hydrological Processes, 16, 3345–3364. doi:10.1002/(ISSN)1099-1085
- Dansgaard, W., 1964. Stable isotopes in precipitation. Tellus, 16, 436–468. doi:10.3402/tellusa.v16i4.8993
- DeWalle, D.R. and Rango, A., 2008. Principles of snow and hydrology. Cambridge: Cambridge University press.
- DeWalle, D.R., Swistock, B.R., and Sharpe, W.E., 1988. Three-component tracer model for stormflow on a small Appalachian forested catchment. Journal of Hydrology, 104 (1–4), 301–310. doi:10.1016/0022-1694(88)90171-0
- Dinçer, T., et al., 1970. Snowmelt runoff from measurements of tritium and oxygen-18. Water Resource Research, 6 (1), 110–124.
- Engel, M., et al., 2016. Identifying run-off contributions during melt-induced run-off events in a glacierized alpine catchment. Hydrological Process, 30, 343–364. doi:10.1002/hyp.10577
- Fritz, P., et al., 1976. Storm runoff analyzes using environmental isotopes and major ions. In: Interpretation of Environmental Isotope and Hydrochemical Data in Groundwater, Panel Proceedings Series-International Atomic Energy Agency. Vienna, Austria: International Atomic Energy Agency, 111–130.
- Gat, J.R. and Carmi, I., 1970. Evolution of the isotopic composition of atmospheric waters in the Mediterranean Sea area. Journal of Geophysical Research, 75, 3039–3048. doi:10.1029/JC075i015p03039
- Haritashya, U.K., et al., 2006. Suspended sediment from the Gangotri Glacier: quantification, variability and associations with discharge and air temperature. Journal of Hydrology, 321, 116–130. doi:10.1016/j.jhydrol.2005.07.037
- Hashimoto, S., et al., 2002. Isotope studies of inner snow layers in a temperate region. Hydrological Process, 16, 2209–2220. doi:10.1002/hyp.1151
- Hasnain, S.I. and Thayyen, R.J., 1999a. Controls of major ion chemistry of the Dokriani GLACIER meltwaters, Ganga basin, Garhwal Himalaya. Journal of Glaciology, 45 (149), 87–92. doi:10.1017/S0022143000003063
- Hooper, R.P., Christophersen, N., and Peters, N.E., 1990. Modelling streamwater chemistry as a mixture of soilwater end-members – an application to the Panola Mountain catchment, Georgia, USA. Journal of Hydrology, 116 (1), 321–343. doi:10.1016/0022-1694(90)90131-G
- Immerzeel, W.W., Van Beek, L.P.H., and Bierkens, M.F.P., 2010. Climate change will affect the Asian water towers. Science, 328 (5984), 1382–1385. doi:10.1126/science.1183980
- Jain, S.K., Rai, S.P., and Ahluwalia, R.S., 2011. Stream flow modelling of Beas River at Manali, Himachal Pradesh. In: Proceedings of National Conference on Recent Advances in Civil Engineering (RACE-2011), 14–16 October 2011. Varanasi, UP, India: Baranas Hindu University, 286–289.
- Jeelani, G., et al., 2012. Role of snow and glacier melt in controlling river hydrology in Liddar watershed (western Himalaya). Water Resource Research, 48, 1–16. doi:10.1029/2011WR011590
- Jeelani, G., et al., 2016. Estimation of snow and glacier melt contribution to Liddar stream in a mountainous catchment, western Himalaya: an isotopic approach. Isotopes in Environmental and Health Studies, 53 (1), 18–35. doi:10.1080/10256016.2016.1186671
- Jeelani, G., Kumar, U.S., and Kumar, B., 2013. Variation of δ18O and δD in precipitation and stream waters across the Kashmir Himalaya (India) to distinguish and estimate the seasonal sources of stream flow. Journal of Hydrology, 481, 157–165. doi:10.1016/j.jhydrol.2012.12.035
- Jouzel, J., Froehkich, K., and Schotterer, U., 1997. Deuterium and oxygen-18 in present-day precipitation: data and modelling. Hydrological Sciences Journal, 42 (5), 747–763. doi:10.1080/02626669709492070
- Junghans, N., Cullmann, J., and Huss, M., 2011. Evaluating the effect of snow and ice melt in an Alpine headwater catchment and further downstream in the River Rhine. Hydrological Sciences Journal, 56 (6), 981–993. doi:10.1080/02626667.2011.595372
- Katoch, K., 1989. Study of moraines with special reference to metallic minerals in Chhota Shigri Glacier in Lahaul and Spiti District, Himachal Pradesh. Department of Science and Technology, Government of India New Delhi, (Technical Report), 299–301.
- Klaus, J., et al., 2013. Macropore flow of old water revisited: experimental insights from a tile-drained hillslope. Hydrology and Earth System Science, 17 (1), 103–118. doi:10.5194/hess-17-103-2013
- Kumar, B., et al., 2010. Isotopic characteristics of Indian precipitation. Water Resource Research, 46 (W12548), 1–15. doi:10.1029/2009WR008532
- Kumar, S., et al., 1987. Chhota Shigri Glacier. New Delhi: Department of Science and Technology, (Technical Report 1), 1–29.
- Kumar, S. and Dhobal, D.P., 1997. Climatic effects and bedrock control on rapid fluctuations of Chhota Shigri Glacier, northwest Himalaya, India. Journal of Glaciology, 43 (145), 467–472. doi:10.1017/S0022143000035061
- Kumar, V., Singh, P., and Singh, V., 2007. Snow and glacier melt contribution in the Beas River at Pandoh Dam, Himachal Pradesh, India. Hydrological Sciences Journal, 52 (2), 376–388. doi:10.1623/hysj.52.2.376
- Liu, F., Williams, M.W., and Caine, N., 2004. Source waters and flow paths in an alpine catchment, Colorado Front Range, United States. Water Resource Research, 40. doi:10.1029/2004WR003076
- Mark, B.G. and Seltzer, G.O., 2003. Tropical glacier meltwater contribution to stream discharge : a case study in the Cordillera Blanca, Peru 49 (165), 271–281.
- Maurya, A.S., et al., 2011. Hydrograph separation and precipitation source identification using stable water isotopes and conductivity: river Ganga at Himalayan foothills. Hydrological Process, 25, 1521–1530. doi:10.3189/2016AoG71A067
- McDonnell, J.J., Stewart, M.K., and Owens, I.F., 1991. Effect of catchment-scale subsurface mixing on stream isotopic response. Water Resource Research, 27 (12), 3065–3073. doi:10.1029/91WR02025
- Merlivat, L. and Jouzel, J., 1979. Global climatic interpretation of the deuterium oxygen 18 relationship for precipitation. Journal of Geophysical Research, 84 (C8), 5029–5033. doi:10.1029/JC084iC08p05029
- Misra, D., Daanen, P.R., and Thompson, M. A. 2011. Glacier- melt discharge and streamflow. In: P.G. Knight, eds. Glaciers. Routledge: Taylor and Francis.
- Mook, W., et al., 1974. Analysis of a runoff hydrograph by means of natural 18O. In: Isotope techniques in groundwater hydrology. Vienna: International Atomic Energy Agency, 38 (21), 145–156.
- Ohlanders, N., Rodriguez, M., and McPhee, J., 2013. Stable water isotope variation in a Central Andean watershed dominated by glacier and snowmelt. Hydrology and Earth System Sciences, 17, 1035–1050. doi:10.5194/hess-17-1035-2013
- Penna, D., et al., 2014. Tracer-based analysis of spatial and temporal variations of water sources in a glacierized catchment. Hydrology and Earth System Sciences, 18, 5271–5288. doi:10.5194/hess-18-5271-2014
- Penna, D., et al., 2017. Towards a tracer-based conceptualization of meltwater dynamics and streamflow response in a glacierized catchment. Hydrology and Earth System Sciences, 21, 23–41. doi:10.5194/hess-21-23-2017
- Rai, S.P., et al., 2016. Isotopic characteristics of cryospheric waters in parts of Western Himalayas, India. Environmental Earth Science, 75, 600. doi:10.1007/s12665-016-5417-8
- Rai, S.P., Kumar, B., and Singh, P., 2009. Estimation of contribution of southwest monsoon rain to Bhagirathi River near Gaumukh, western Himalayas, India, using oxygen-18 isotope. Current Science, 97, 240–245.
- Rodriguez, M., et al., 2016. Estimating runoff from a glacierized catchment using natural tracers in the semi-arid Andes cordillera. Hydrological Process, 30, 3609–3626. doi:10.1002/hyp.10973
- Rozanski, K., Araguas-Araguas, L., and Gonfiantini, R., 1993. Isotopic patterns in modern global precipitation. In: American Geophysical Unions Monograph, P.K. Swart, et al., eds. Climate change in continental isotopic records. Vol. 78. Washington: American Geophysical Union, 1–36.
- Sharma, P. and Ramanathan, A.L., 2013. Study of solute sources and evolution of hydrogeochemical processes of the Chhota Shigri Glacier meltwaters, Himachal Himalaya, India. Hydrological Sciences Journal, 58 (5), 1128–1143. doi:10.1080/02626667.2013.802092
- Singh, P., et al., 2006. Hydrological characteristics of the Gangotri Glacier, central Himalaya, India. Journal of Hydrology, 327, 55–67. doi:10.1016/j.jhydrol.2005.11.060
- Singh, P. and Jain, S.K., 2002. Snow and glacier melt in the Satluj River at Bhakdra Dam in the western Himalayan region. Hydrological Sciences Journal, 47, 93–106. doi:10.1080/02626660209492910
- Singh, P., Jain, S.K., and Kumar, N., 1997. Estimation of snow and glacier-melt contribution to the Chenab River, western Himalaya. Mountain Research and Development, 17, 49–56. doi:10.2307/3673913
- Singh, P. and Singh, V.P., 2001. Snow and glacier hydrology. Dordrecht, The Netherlands: Kluwer.
- Singh, V.B., 2016. Hydrological characteristics and solute dynamics of meltwater draining from Western Himalaya, India. Thesis (PhD). Jawaharlal Nehru University.
- Sklash, M.G., Farvolden, R.N., and Fritz, P., 1976. A conceptual model of watershed response to rainfall, developed through the use of oxygen-18 as a natural tracer. Journal of Earth Science, 13 (2), 271–283.
- St. Amour, N.A., et al., 2005. Isotopic time-series partitioning of streamflow components in wetland dominated catchments, lower Liard River basin, Northwest Territories, Canada. Hydrological Process, 19 (17), 3357–3381. doi:10.1002/hyp.5975
- Stichler, W., 1987. Snow cover and snowmelt processes studied by means of environmental isotopes. In: H.G. Jones and W.J. Orville-Thomas eds. Seasonal snow covers: physics, chemistry, hydrology. Dordrecht: Springer, 673–726.
- Stichler, W., et al., 2001. Influence of sublimation on stable isotopic record recovered from high altitude glaciers in the tropical Andes. Journal of Geophysical Research, 106 (19), 613–620. doi:10.1029/2001JD900179
- Sun, C., et al., 2016. Analysis on the streamflow components of the typical inland river, Northwest China. Hydrological Sciences Journal, 61, 970–981. doi:10.1080/02626667.2014.1000914
- Swistock, B., DeWalle, D., and Sharpe, W., 1989. Sources of acidic storm flow in an Appalachian headwater stream. Water Resource Research, 25 (10), 2139–2147. doi:10.1029/WR025i010p02139
- Tian, L., et al., 2005. Westerly moisture transport to the middle of Himalayas revealed from the high deuterium excess. Chinese Science Bulletin, 50 (10), 1026–1030. doi:10.1360/04wd0030
- Vincent, C., et al., 2013. Balanced condition or slight mass gain of glaciers in the lahaul and spiti region (northern India, Himalaya) during the nineties preceded recent mass loss. The Cryosphere, 7, 569–582. doi:10.5194/tc-7-569-2013
- Wagnon, P., et al., 2007. Four years of mass balance on Chhota Shigri Glacier, Himachal Pradesh, India, A new benchmark Glacier In the Western Himalaya. Journal of Glaciology, 53 (183), 603–610. doi:10.3189/002214307784409306
- Williams, M.W., et al., 2006. Geochemistry and source waters of rock glacier outflow, Colorado Front Range. Permafrost Periglacial Processes, 17 (1), 13–33. doi:10.1002/(ISSN)1099-1530
- Wulf, H., Bookhagen, B., and Scherler, D., 2016. Differentiating between rain, snow, and glacier contributions to river discharge in the western Himalaya using remote-sensing data and distributed hydrological modeling. Advances in Water Resource Research, 88, 152–169. doi:10.1016/j.advwatres.2015.12.004
- Yin, Z., et al., 2017. The spatial and temporal contribution of glacier runoff to watershed discharge in the Yarkant River Basin, Northwest China. Water, 9 (3), 159.
- Zhou, S., et al., 2008a. The effect of refreezing on the isotopic composition of melting snowpack. Hydrological Process, 22, 873–882.
- Zhou, S., et al., 2008b. Preferential exchange rate effect of isotopic fractionation in a melting snowpack. Hydrological Process, 22, 3734–3740.
- Zhou, S., Wang, Z., and Joswiak, D.R., 2014. From precipitation to runoff: stable isotopic fractionation effect of glacier melting on a catchment scale. Hydrological Process, 28 (8), 3341–3349.