
ABSTRACT
A basic component of any hydrogeological study is the magnitude and temporal variation of groundwater recharge. This can be difficult to assess accurately, particularly in arid and semi-arid rainfed mid-mountain zones, as is the situation in the rural, low population density zones of North-Central Chile. In this study, recharge in the Punitaqui Basin, North-Central Chile, was characterized, contrasting the results of two methods: a modified Thornthwaite-Mather (MTM) and discharge recession analysis (DRA). We found a recharge rate of between 1 and 4% of average annual precipitation. Average recharge estimated by the MTM method is consistently higher than that estimated by DRA. Also, DRA tends to smooth the recharge values, resulting in a lower inter-annual variation coefficient. Both methods identified a threshold value of total annual precipitation, above which recharge can be expected to occur, of the order of 180 mm year−1, consistent with values reported in similar areas.
Editor A. CastellarinAssociate editor L. Bouchaou
1 Introduction
Arid and semi-arid zones, where potential evapotranspiration exceeds precipitation, cover more than 30% of the Earth’s surface. Although access to water resources is invariably restricted in these areas, they are increasingly subject to population pressure, and present population growth rates higher than for any other ecological zone (Scanlon et al. Citation2006, Touhami et al. Citation2014, UN Citation2017).
In addition to their socio-economic and political importance, the mountainous portions of arid and semi-arid zones have clear hydrological and environmental consequences for large numbers of people. Mountainous zones, which are areas at altitudes greater than 1000 m a.s.l., or between 200 and 1000 m a.s.l., but with slopes greater than 20%, make up more than 39% of the global continental surface, excluding Antarctica and Greenland (Viviroli et al. Citation2007). Worldwide, around 67% of surface runoff originates in mountainous basins (Ajami et al. Citation2011). In this context, a good understanding of hydrological aspects in mid-mountain areas, particularly those located in arid and semi-arid regions, takes on special importance.
Although arid and semi-arid mountainous regions are significant contributors to the availability of water resources for areas at lower elevations, groundwater is commonly the only reliable and permanent source of water in arid and semi-arid regions themselves (Herczeg and Leaney Citation2011). The evaluation and characterization of these resources is especially difficult in large and/or remote areas, given the costs associated with such investigations, and this is particularly true for basin-scale studies. As a result, few hydrogeological studies are carried out at this scale, especially in rural areas with low population densities where the need for such studies is likely the greatest (Van Camp et al. Citation2013, Oyarzún et al. Citation2014a).
A key component of any hydrogeological study is the correct estimation of recharge. Recharge is defined as the fraction of the water infiltrating at the land surface that eventually reaches the water table, “…adding to groundwater storage…” (Healy Citation2010). Very frequently the estimation of precipitation-derived recharge is a difficult task, due to the spatial and temporal variability of rainfall, and the limited ability to observe and analyse aquifer dynamics. These difficulties are particularly evident in arid and semi-arid areas, as precipitation is affected highly by climatic phenomena such as El Niño Southern Oscillation (ENSO) or the Pacific Decadal Oscillation (PDO) (Núñez et al. Citation2013). This in turn determines that recharge actually occurs in a sporadic fashion (UNEP/DEWA Citation2002). In addition, in arid zones precipitation amounts are usually low in comparison to the potential evapotranspiration (PET), and the fraction of precipitation that eventually becomes recharge is therefore comparable in magnitude to the range of uncertainty of the recharge quantification methods (Scanlon et al. Citation2002).
Despite the fact that groundwater recharge studies and the characterization of recharge events in arid zones have been identified in Chile as key variables for the sustainable use of water resources in the country, especially for rural or small urban communities (CNID Citation2016), there is in general a lack of such studies in rainfed mid-mountain areas in North-Central Chile. In a context of declining rainfall amounts (Garreaud et al. Citation2017), there is an urgent need for such knowledge, particularly on “comunidades agrícolas” (i.e. rural communities) areas, which depend on rain as the water source, either directly through rainwater capture or indirectly through groundwater recharge (Oyarzún et al. Citation2014a, Citation2014b, Citation2015). This type of social organization in North-Central Chile, especially important in the Coquimbo Region, dates back to colonial times (Livenais and Aranda Citation2003, Wilkins and Green Citation2014), and thus possesses enormous cultural significance. More than 16 000 people, or “comuneros” (members) participate in comunidades agrícolas, and land managed under the comunidades agrícola tradition occupies nearly 25% of the Coquimbo Region (MBN Citation2017).
In this context, the present work aims mainly to characterize and quantify recharge processes, at the mountain block scale (hereafter referred to as mountain block recharge – MBR), in a representative basin of North-Central Chile, considering the Punitaqui Basin, in the Coquimbo Region, as a case study. Whereas a previous study in this basin estimated recharge at around 5% of mean annual precipitation (DGA Citation2008), it is important to recognize that groundwater recharge in arid zones such as the Punitaqui Basin is usually dominated by episodic events related to extreme (and thus infrequent) precipitation events (Ajami et al. Citation2011), and influenced by phenomena such as ENSO and the PDO (Scanlon et al. Citation2006). In spite of the importance of episodic, high-impact precipitation events that are likely to result in high inter-annual variability in recharge rates, the DGA (Citation2008) study cited above did not consider such issues. Thus, this study was undertaken with the expectation of using the knowledge gained from the Punitaqui Basin to better characterize recharge occurrence and dynamics in arid mid-mountain areas.
2 Methods and materials
2.1 Study area
The study area is the Punitaqui Basin, located in the Limarí Province, Coquimbo Region, North-Central Chile (). The criteria by which this basin was selected include: (a) its climatic and geomorphological representativeness of middle-mountain dry-land areas (Oyarzún et al. Citation2014a); (b) the existence of flow-gauging information at the basin outlet, a rather uncommon situation in such basins in North-Central Chile (Nauditt et al. Citation2017); and (c) the existence of previous work on the determination of hydrogeological properties at the basin scale from recession flow analysis (Oyarzún et al. Citation2014a).
Figure 1. Punitaqui Basin area.
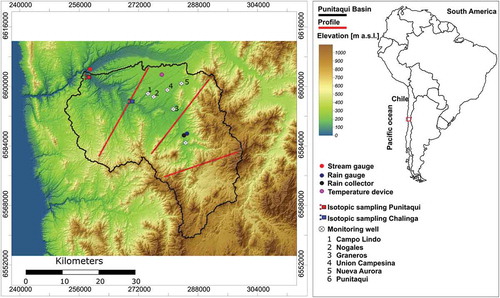
The Punitaqui Basin has a surface area of approx. 1240 km2. The main stem draining the basin is the Punitaqui Stream, with an approximate length of 60 km (Oyarzún et al. Citation2014a). The basin is roughly north–south to northwest–southeast in orientation, and the majority of the area ranges between 200 and 800 m a.s.l.; numerous sub-basins located in the surrounding hills to the east and west contribute runoff that converges to the main stem (the Punitaqui Stream) (Huerta Citation2009).
The climate is predominantly arid, with a precipitation to potential evapotranspiration ratio in the range of 0.05 to 0.2 (Scanlon et al. Citation2006, UNESCO Citation2010). The average annual temperature is of the order of 16°C, ranging between a minimum of 9°C and a maximum of 24°C (Cade-Idepe Citation2004). Long-term precipitation averages around 160 mm year−1, with significant inter-annual variations associated with the ENSO phenomenon (Veit Citation1996), but concentrated in the winter months (May–August). The greatest streamflows occur between June and July, and generally attain values of less than 1000 L s−1 (50% exceedence probability), while the lowest streamflows occur between December and March, of the order of 50 L s−1 (also at a 50% exceedence probability) (Cade-Idepe Citation2004).
Igneous rocks, such as thick-grained, dark grey granodiorites and tonalites of Jurassic and Cretaceous ages, with moderate weathering, predominate in the Punitaqui Basin. Also important are andesitic rock outcroppings, intercalated with sedimentary rocks of the lower Cretaceous (Sernageomin Citation2003, DGA Citation2008). Partially consolidated sediments of Pliocene-Pleistocene age are distributed in the northwest of the study area, horizontally arranged over the batholithic rocks, and composed of gravels, sands and clays of alluvial and fluvial origin (Huerta Citation2009). Finally, a narrow band of recent alluvial unconsolidated gravels and sandy gravels, distributed in the central valley and neighbouring gullies in the northern part of the study area, make up the current Punitaqui Stream floodplain (Huerta Citation2009). In geomorphological terms, four formations predominate: (a) alluvial terraces, present in the northern part of the basin, (b) low coastal ridges in the northwestern sector, (c) coastal mountains that cross the territory diagonally from the northeast to southwest, and (d) low interior ridges in the southwestern sector (Pouget et al. Citation1996).
Finally, it is possible to identify hydrogeological units that exist primarily within surficial sediments, and can be subdivided into zones of high- and medium-permeability (DGA Citation2008). The high-permeability hydrogeological unit is located in the Punitaqui Stream fluvial deposits; it is composed of cobbles, gravels and sands, with finer sediments in lesser quantity, and demonstrates hydraulic conductivities ranging from 10−2 to 10−4 m s−1. Locally saturated aquifers in this unit are mainly unconfined, with water tables located at depths of between 5 and 30 m, and specific flows on the order of 1.2 L s−1 m−1. Meanwhile, the alluvial terrace deposits, in the northern part of the Punitaqui Basin, are a semi-permeable unit composed of sands, gravels and silts. The hydraulic potential of these sediments is moderate, with hydraulic conductivities between 10−4 and 10−8 m s−1, and specific flows of 0.4 L s−1 m−1. Saturated aquifers in this semi-permeable hydrofacies are also typically unconfined, with water tables located between depths of 20 and 30 m (DGA Citation2008). Shallow groundwater in the Punitaqui Basin also occurs in weathered and/or fractured granitic rocks in various proportions, with moderate hydrogeological potential, at depths of 3–30 m. When these aquifers occur, they may merge or interact with, or be composed of in part by, colluvial deposits. In an integrative approach, Oyarzún et al. (Citation2014a) determined a hydraulic conductivity on the order of 3 × 10⁻⁵ (m s−1) and a drainable porosity of 7 × 10⁻⁵, for effective parameter values at basin scale.
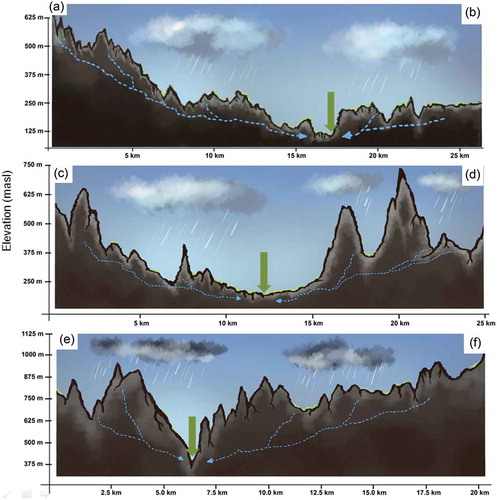
Within the described physiographic context, this work is focused specifically on MBR evaluated at the basin level. In agreement with Ajami et al. (Citation2011), we define MBR as precipitation that infiltrates through the mountain block on its way to recharge groundwater at lower elevations as well as to feed surface water discharge. For the area of study, this is schematically represented in . Therefore, MBR influences both the storage dynamics of groundwater at the basin level, and the behaviour of the surface flow.
Figure 2. Conceptual representation of MBR (curved blue dashed arrows) for the Punitaqui Basin based on three transverse profiles of the study area (depicted in ). The vertical green arrow indicates the location of the Punitaqui Stream.
2.2 Basic hydrological characterization
An analysis of the historical hydrological behaviour of the basin and an isotope characterization of surface water components were carried out.
The hydrological analysis addressed the historical dynamics (both monthly and annually) of precipitation and surface discharge patterns. For this, publicly available data obtained from the Chilean Water Authority (DGA, Dirección General de Aguas) were considered.
Regarding the isotope characterization, Punitaqui Stream samples were taken between May 2016 and April 2017, every 1–2 months, at two sites located in the middle part and the end (i.e. confluence with the Limarí River) of the stream, at Chalinga and Desembocadura, respectively (). These samples were analysed for 2H, 18O and 222Rn isotopes, which have been used in earlier hydrogeological investigation in the area to understand surface–groundwater interaction (Oyarzún et al. Citation2014a, Citation2014b, Citation2015). In addition, precipitation samples were obtained during 2015 and 2016 from a rain collector located in the town of Punitaqui (). Isotope analyses of the samples collected in 2015 (rainfall) were performed at the Environmental Isotope Laboratory of the Chilean Nuclear Energy Commission (CCHEN), while those collected in 2016/17 (rainfall, stream water) were analysed at the University of Waterloo-Environmental Isotope Laboratory (uwEILAB). In both laboratories a Liquid Water Stable Isotope Analyzer (Los Gatos Research, CA, USA) was used. Isotope ratios are expressed in per mil (‰) using the usual δ notation:
where R refers to the 2H/1H or 18O/16O ratio of a sample and the standard (VSMOW), respectively. Informed analytic errors for 18O and 2H at CCHEN were 0.08 and 1‰ (2015 samples), whereas at uwEILAB (2016/17) these were 0.2 and 0.8‰ for 18O and 2H, respectively. The 222Rn measurements (stream water) were made using alpha spectrometry on RadH2O equipment (Durridge Co., MA, USA) at the Environment Laboratory of the University of La Serena, the day after each sampling date. Corrections were made to account for radioactive decay between time of sampling and time of analysis in the laboratory.
2.3 MBR quantification methods
2.3.1 Hydro-meteorological information
We employed two methods to estimate recharge in the Punitaqui Basin: the modified Thornthwaite-Mather method, and the discharge recession method. Both methods require the availability of historical series of basic hydro-meteorological data, i.e. precipitation and runoff. There was one raingauge and one stream discharge gauge in the Punitaqui Basin with suitable data (in terms of both temporal extension and continuity). The names and locations of the gauges, and the time period for which data are available for each of the stations, are shown in and . Note that, for the purposes of this analysis, we expressed discharge in terms of equivalent water depth, i.e. the discharge divided by the surface area of the basin.
Table 1. Rain and flow gauging stations in the Punitaqui Stream basin and data availability.
2.3.2 Modified Thornthwaite-Mather method
The first method used for MBR quantification was a modified Thornthwaite-Mather (MTM) method. The Thornthwaite-Mather approach is a well-known technique for estimating recharge, and is of proven utility in hydrogeological studies (e.g. Scozzafava and Tallini Citation2001, Walraevens et al. Citation2009, Westenbroek et al. Citation2010, Uribe et al. Citation2013, Touhami et al. Citation2014). In particular, the scheme employed in the present study is based on the work of Uribe et al. (Citation2013). The method relies on a mass balance, taken over a monthly time interval, as expressed by:
where θ is the unsaturated zone moisture; P is precipitation; ETr is real evapotranspiration; Qr is surface runoff; and R is groundwater recharge, assuming the studied basin does not receive external inputs from other sub-basins (Uribe et al. Citation2013). The subscript m indicates the time step month (m = 1, 2, 3, …, where m − 1 = 0 is the initial condition at the start of the calculation). Within the balance, it must be taken into account that the unsaturated zone, as a container, has a limited storage capacity. This is known as the maximum storage capacity (θmax), which is a function of the texture and depth (thickness) of the unsaturated zone (Coral et al. Citation2015). If the calculated quantity of water in the system by the end of the month (θcal m) is greater than θmax, the excess is assumed to be partitioned to groundwater recharge (Westenbroek et al. Citation2010, Uribe et al. Citation2013, Coral et al. Citation2015). The monthly balance embodied in Equation (2) was implemented using the algorithm presented in . In order to apply the algorithm, a value must be established for θmax; furthermore, an initial moisture content (θm−1) must be supplied for each iteration. Unlike the study of Uribe et al. (Citation2013), in the present work we calculated monthly potential evapotranspiration (ETPm) and determined the crop evapotranspiration (ETcm) using the crop coefficient (kc), and then defined the value of ETrm for months in which calculations indicated the existence of moisture in the soil (i.e. (θm−1 + Pm) − Qrm > 0).
Figure 3. Flow diagram of the algorithm used for the MTM method.
Monthly precipitation (Pm) and runoff (Qrm) values were obtained from the daily records at the selected rain and stream discharge stations (). The ETPm was estimated using the Thornthwaite method according to average monthly temperature, with a correction for astronomical day length and the number of days in the month (Xu and Singh Citation2001, Almorox Citation2007). Due to the lack of historical temperature data in the study zone, global-scale gridded (GSG) temperature data were used (Matsuura and Willmott Citation2015). We checked that our estimates of ETP were reasonable by comparing the calculated values against short time series (May 2011–December 2014), available at the Camarico station of the CEAZA-Met network (www.ceazamet.cl; ).
To determine the parameters θmax and kc, we used information from several sources. Land use was simplified to two classes: cultivated surface area and non-cultivated surface area (natural vegetation), and regions of the study area were classified as belonging to one category or the other as determined from (a) soil-use GIS coverage from the CONAF (National Forestry Office) Land Information System (CONAF Citation2014), (b) irrigated surface GIS coverage of the Limarí River basin (CAZALAC-RHODOS Citation2006) and (c) soil characteristic GIS coverage (CIREN Citation2012). For the cultivated area, and to distinguish the crop types according to their evapotranspiration capacities, a representative kc parameter was determined as a function of vegetation type. Also, seasonal variability was considered due to the variable demand of water required during different stages of the crops present, obtained from CAZALAC-RHODOS (Citation2006) and FAO 56 (Allen et al. Citation2006). An examination of the crop types existing in the study area and respective kc values suggested the use of a basin average value of kc equal to 0.75 (CAZALAC-RHODOS Citation2006). However, because various species present kc close to 1 (and sometimes greater than that) in the summer period, but much lower in winter (particularly in the case of deciduous fruit trees), we decided to correct kc based on the time of year. Thus, the preliminary basin average value of 0.75 was multiplied by 0.8 for months with lower water demand (April–September) and 1.2 for months with greater requirements (October–March). For the non-cultivated surface, a fixed kc of 0.065, i.e. approximately 1/10 of the average kc of the cultivated surface, was used. The chosen value is based on the work of Kalthoff et al. (Citation2006). These authors determined real evapotranspiration (ETr) rates of 750 mm year−1 in cultivated areas and 65 mm year−1 in rainfed areas with natural vegetation (i.e. approx. 1/10 of the figure of the cultivated area) in the middle (east–west) portion of the Elqui Basin, approx. 80 km to the north of the Punitaqui Basin, with similar physiographic and environmental characteristics.
With respect to the unsaturated zone hydrological properties, we used the field capacity (FC) as a reasonable approximation of the maximum storage capacity (θmax), and assumed the permanent wilting point (PWP) as the initial soil moisture content (θ0). The use of the PWP as a starting value for the iterative calculation of moisture content is valid when the initial time (m = 0) corresponds to a dry month (summer), such as January for the area of study; in any case, the calculated soil moisture contents become asymptotically independent of the initial condition after a few time steps. The FC and PWP values were assigned on the basis of the dominant unsaturated zone texture for the area and literature values from Israelsen and Hansen (Citation1975). In the case of cultivated surfaces the soil texture, which is predominantly fine (clayey to clay) loam in the study area, was obtained from CIREN (Citation2012). For non-cultivated surfaces, the unsaturated zone texture was taken from Casanova et al. (Citation2010) and was characterized as loam or silty loam on the surface (0–32 cm) and clay loam or silty clay loam at deeper horizons (32–100 cm). Thus, FC values of 36 and 27% and PMP values of 17 and 13% were used for cultivated and non-cultivated zones, respectively. The unsaturated zone depth was derived from the work of Casanova et al. (Citation2010) and values obtained from CIREN (Citation2012) which, when taken together, suggested using a depth value of 70 cm as an average for the study area. The monthly water balance given by Equation (2), calculation of the model parameters, and processing of the meteorological time-series data (i.e. precipitation) were all implemented in MS Excel.
2.3.3 Discharge recession analysis method
The second method used to estimate recharge was discharge recession analysis (DRA), which is based on the initial work of Kirchner (Citation2009) and the subsequent work of Ajami et al. (Citation2011). This method estimates recharge based on changes in groundwater storage dynamics, which in turn are obtained from local storage–surface runoff discharge (S–Q) relationships acquired in a basin from recession analysis of runoff discharge. Conceptually, the DRA method attempts to infer a functional relationship between groundwater storage and discharge processes from observations of discharge (baseflow) recession. Thus, the storage–discharge function methodology provides an indirect method to quantify mountain block recharge by estimating changes in mountain bedrock storage as a function of changes in stream discharge. This is somewhat different than the commonly used concept of mountain block recharge (e.g. Wilson and Guan Citation2004). While this does not mean that lateral flow does not exist, we acknowledge that we lack of enough information to quantify it directly. The general approach and specific stages of the method applied in this study are described below; for a more detailed explanation of the theoretical foundations, the reader is referred to Kirchner (Citation2009) and Ajami et al. (Citation2011).
The analysis requires a record of time-series discharge observations when source/sink terms are not contributing significantly to streamflow. Data cannot be influenced by precipitation, and must take place when evapotranspiration is at a minimum. In our case, daily streamflow data for the May–September period of each year of record, i.e. the autumn–winter period (given lower ET, as well as lower potential influence of irrigation return flows from agricultural areas) were used. However, because the May–September period coincides with the occurrence of precipitation events in the area, we used the criteria of Oyarzún et al. (Citation2014a), eliminating from the analysis any discharge data that demonstrated any of the following three characteristics: (a) days with rainfall greater than 10 mm, (b) two days following a day with rainfall greater than 10 mm, and (c) consecutive days with increasing discharge. From this, we plotted Q*, the average discharge of two consecutive days:
versus the corresponding rate of change in discharge, −dQ/dt, approximated as:
where the time step, ∆t, is taken as one day.
The Q* versus −dQ/dt values were plotted on logarithmic axes, and the point cloud grouped into bins or sets. To accomplish this binning, two methods were considered: (a) the equal interval method (Oyarzún et al. Citation2014a) and (b) the quantile method (Ajami et al. Citation2011). The equal interval method divides the range of the logarithm of discharges into a selected number of bins of equal log-length:
In the general case, when intervals are chosen in this fashion the number of points per bin is likely to vary widely. For the present analysis we chose 15 as a reasonable number of bins, following heuristic guidelines from previous investigators (Mendoza et al. Citation2003, Oyarzún et al. Citation2014a).
For the quantile method, bins are chosen such that each interval contains the same number of data points; thus, the total number of data pairs (Q* and −dQ/dt) are divided by the desired number of bins (in this case, 15 intervals) to obtain the number of data points per bin:
For each bin (in both criteria) we calculated the average values of both Q* and −dQ/dt, as well as the standard error:
where is the standard error of the mean, s is the sample standard deviation, and n is the number of points in the bin.
Following the criteria of Ajami et al. (Citation2011), only bins in which the standard error of −dQ/dt was lower than or equal to the average value of (−dQ/dt) were ultimately retained. Thus, with the selected bins, the central trend of the discharge recession data was determined by linear regression. Based on this, the groundwater storage–surface discharge (S–Q) relationship for each year was obtained using the following equation (Ajami et al. Citation2011):
where a is the intercept and b is the slope of the corresponding linear regression between the binned −dQ/dt vs Q*. From this, MBR was obtained as:
The discharge (Q) used in Equations (8) and (9) (Qmax, Qmin) corresponds to the maximum and minimum daily values for each year, being careful that Qmax did not correspond to a day with more than 10 mm of precipitation or the subsequent two days.
3 Results and discussion
3.1 Hydrological behaviour
In we present monthly total precipitation and discharge. Along with the marked variability, it is observed that discharges are rather temporally delayed, by approx. one month, with respect to precipitation. In addition, although precipitation tends to decrease in late winter–early spring (August–September), significant discharge is still recorded in the stream then. Finally, even during the dry period of the late spring–summer (November–January), a “baseflow” is recorded. Thus, it can be inferred that the underlying hydrogeology of the study area exerts important control of surface discharge through the baseflow discharge. Thus, some fraction of the precipitation in the basin infiltrates the mountain block, recharging groundwater and later feeding surface discharge during the dry (non-rainfall) months.
Figure 4. Monthly total precipitation and discharge in the study area.
presents the historical precipitation and discharge in the study area. From inspection of the data, it is clear that both rainfall and discharge are highly variable from year to year, and there are frequent periods of low annual precipitation, which is a common occurrence in rural, arid and semi-arid rainfed areas both in Chile and abroad (Oyarzún et al. Citation2014a).
Figure 5. Temporal evolution of monthly precipitation and average monthly discharge in the Punitaqui Basin.
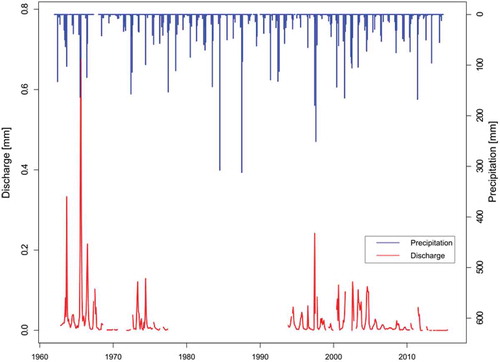
There is also a period from 1978 to 1992 for which discharge data are unfortunately not available. However, the comparison of years in which there were similar amounts of precipitation during the periods of available data, i.e. 1962–1977 and 1993–2015, shows that there are still differences in reported discharge. From this it can be inferred that other factors (e.g. rainfall spatial or temporal distribution for the year) influence precipitation–runoff processes in the study area. Furthermore, since 1998 the Punitaqui area (and North-Central Chile in general) has been affected by a period of water scarcity (low and decreasing precipitation), which has translated into historical discharges that are also low and decreasing.
presents the temporal evolution of the isotope signals (2H, 18O, 222Rn) in the 2016/17 period in the Punitaqui Stream at two stations, located at Chalinga and Desembocadura. This particular period was a year with relatively low precipitation, which favoured the use of isotopic compositions for understanding the contributions of the groundwater reservoir to streamflow. Indeed, between 1 April 2016 and 30 April 2017, only 4 days were recorded with precipitation greater than 10 mm, and the total recorded rainfall for that period was approx. 66 mm. The sampling of 26 July 2016 was carried out a day after the greatest precipitation event of the year (approx. 27 mm between 24 and 25 July). Thus, it is possible to compare the isotopic ratios in the baseflow contribution to surface discharge (i.e. streamflow that is maintained by groundwater discharge) to those associated with surficial and shorter-term rainfall–runoff processes. With the exception of the 26 July sampling, 2H and 18O values in the Punitaqui Stream for 2016/17 are rather similar to those described by Strauch et al. (Citation2006) and Oyarzún et al. (Citation2014b, Citation2015) for wells and springs associated with hills and low granite ridges in the first third (southern portion) of the basin. Likewise, these values are consistent with the values obtained from precipitation samples in 2016 (n = 3) and 2017 (n = 1) from the collector located in the town of Punitaqui (averages of −5.7‰ and −32‰ for 18O and 2H, respectively). Although the δ18O and δ2H ratios generally vary around the average values, the samples of surface water runoff obtained on 26 July 2016 (−9.0/−8.0‰ for δ18O, and −59.1/−52.1‰ for δ2H, for Chalinga/Desembocadura, respectively) stand out from the samples collected on other dates. Given that the rainfall isotopic signal of the 24–25 July event was −5.9‰ and −37.0‰ for δ18O and δ2H, respectively, the depleted values in stream water of 26 July could be attributable to a significant contribution to surface water of precipitation falling in the basin headwater, upstream of the town of Punitaqui (where the rainfall collector was installed).
Figure 6. Values of 2H, 18O and 222Rn for the Punitaqui Stream at (a) Chalinga and (b) Desembocadura in the 2016–2017 period.
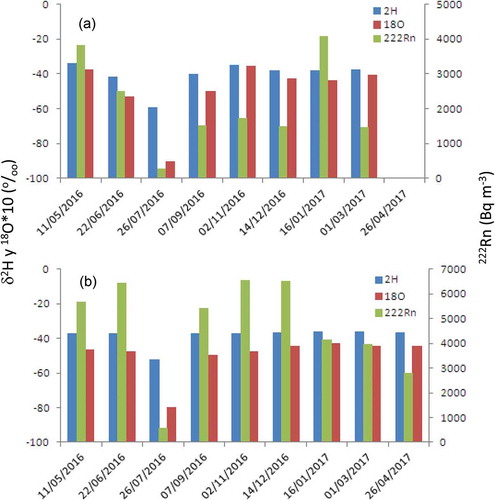
The interpretations for the oxygen and hydrogen isotope ratios are confirmed by the 222Rn data. Green and Stewart (Citation2008) indicated that values of 222Rn activity above 1000 Bq m−3 in surface water can be considered indicative of some degree of exfiltration of groundwater (i.e. the stream is in a gaining, or influent, condition), and the values of 222Rn activity, generally above 1400 Bq m−3, appear to support the supposition that discharge in the Punitaqui Stream contains a non-negligible fraction of baseflow at all sampled times during the year. As with the δ18O and δ2H ratios, the exception to this general behaviour is provided by the 26 July 2016 sampling event, when direct surface runoff from the antecedent rainfall represents a major part of stream discharge. Taken together, both the analysis of the historical precipitation and discharge data and the isotopic evidence suggest that surface water discharge in the Punitaqui Stream contains a variable amount of surface runoff, along with an identifiable fraction of groundwater discharge (baseflow) that is the result of MBR.
3.2 MBR estimates
The results of the MBR estimations with the MTM and DRA methods are presented below. Based on the final availability of data, the following assessment sub-periods (for both methods) were selected: 1963–1966, 1973–1975, 1994–1998 and 2003–2010.
3.2.1 MTM method
shows the estimates of cultivated surface area in the basin, obtained from the review and processing of various GIS layers, as discussed previously. The percentage of the total area that is cultivated fluctuates, depending on the GIS layer reviewed, between 8 and 11% of the basin; for the present study, we chose to use a cultivated surface area value of 10%, with the non-cultivated surface area (with natural vegetation) set at 90%.
Table 2. Cultivated surface area of each basin according to various GIS layers.
With the proportion of each type of plant coverage defined, a weighted crop coefficient (kc) value was obtained for the entire basin. In addition, as mentioned in the methods section, weighted values of FC and PWP were determined, as shown in .
Table 3. Weighted parameter values used in the modified Thornthwaite-Mather water balance.
Based on the indicated values and in accord with the described procedures, the results of the water balance are presented at annual scale in , for each of the four sub-periods of assessment. It is clear that, while precipitation and discharge present significant inter-annual variability, the same does not occur in the case of evapotranspiration, which is more stable over time. In fact, with the exception of the years of its maximum and minimum values (1997 and 1966, respectively), ETP values are close to the average for all the years. In addition, it is observed that in most of the assessed years, the value of ETr, as a percentage of precipitation, exceeds the threshold of 100, an expected situation in an arid climate.
Table 4. Summary of hydrological variables considered in the water balance. P: precipitation, Qr: runoff, ETP: potential evapotranspiration, ETr: real evapotranspiration, MBR: recharge. SD: standard deviation; CV: coefficient of variation.
In contrast to the estimated values of ETP, estimated MBR appears to be quite variable and rather episodic, only attaining an observable magnitude during the few years with elevated precipitation (above approx. 188 mm year−1). The long-term (historical average) estimated recharge rate is on the order of 4% of precipitation; however, this average value is somewhat misleading. The rate of recharge is actually highly variable (coefficient of variation of 200%, much greater than that obtained for discharges and evapotranspiration). In fact, the mode of the distribution of the annual recharge is zero, and no recharge events are indicated for the most recent time period, 2003–2010.
3.2.2 DRA method
We plotted the data as Q* vs −dQ/dt relationships for both log-equal intervals and intervals containing equal numbers of data points. The results are presented in .
Figure 7. Q* vs −dQ/dt relationship (blue dots), and bins (orange dots) determined using (a) the equal interval method and (b) the quantile method.
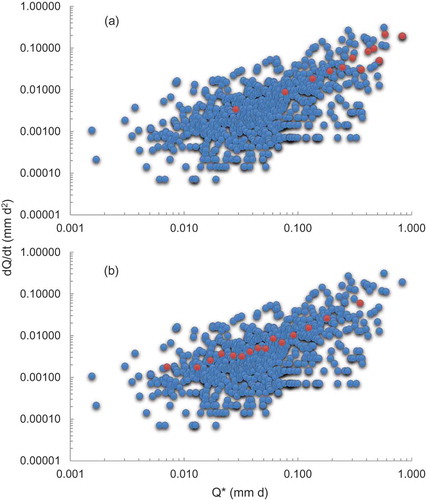
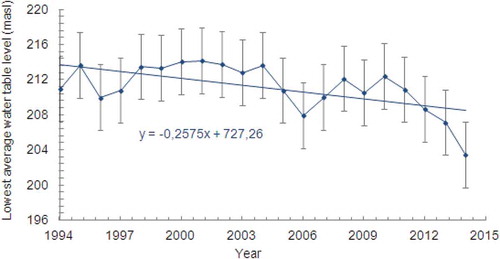
Figure 8. Temporal evolution (± standard deviation) of the average water table levels (lowest annual value) from the six DGA monitoring wells in the Punitaqui Stream basin.
In the case of the equal interval method, only 12 of the 15 originally defined bins were kept (given the standard error criterion, Section 3.2.3). The bins defined by this method tend to be concentrated towards the highest discharge values, which also coincide with somewhat lower data quantity. In contrast, the bins defined by the quantile method were more evenly distributed across all values of −dQ/dt. All the bins defined by the quantile method met the standard error criterion and were retained in the analysis. We applied (log) linear regression to the binned data values shown in , and obtained slope and intercept estimates, as well as estimates of the significance of the values ().
Table 5. Linear and polynomial regression coefficients for the quantile and equal interval methods.
It is interesting to note the high R2 values obtained in the analysis, which are even greater than some of the values presented in Ajami et al. (Citation2011). Although not a quantitative assessment of correlation (as developed, for example, from a Pearson correlation test), the calculated R2 is an indication of the fraction of variability in the dependent variable that can be predicted by the independent variable (in this case, >90%). The quality of the fit implies that the S–Q (storage–discharge) relationship in the study area can be described adequately by the central trend of the recession analysis (Ajami et al. Citation2011), thus fulfilling a basic assumption of the method. Of the two clustering schemes, the data grouped by quantile yield slightly greater regression coefficients. The inferred storage–discharge relationships were MBR = 6.04Q0.796 and MBR = 8.59Q1.074, based on the equal interval and quantile grouping methods, respectively. In spite of the different relationships and slightly different R2 values obtained from the separate binning methods, the annual MBR values obtained () are ultimately not significantly different. Also, the long-term MBR to precipitation ratio was observed to be 1% (for both methods of bin grouping).
Table 6. Hydrological year period MBR estimates, with maximum and minimum discharge each year, using the equal interval (EI) and quantile (QU) bin grouping methods. Dates (columns 4 and 6) in the form dd/mm.
3.2.3 Integrated analysis
The average annual recharge estimated for the Punitaqui Basin, expressed as a percentage of average precipitation, is 4 and 1% for the MTM and DRA methods, respectively. These values are of the same order of magnitude as the average figure described by DGA (Citation2008). However, the current study also allowed us to estimate the temporal recharge dynamics. Indeed, annual recharge values obtained by MTM and DRA are very variable throughout the period of study.
The average recharge from DRA is lower than that obtained with the MTM. This could be explained by the fact that the “dynamic storage” (or MBR) is lower than the “total storage” of a basin, since basins “can retain significant volumes of residual water, even under drought conditions” (Kirchner Citation2009). Similarly, Ajami et al. (Citation2011) indicated that “stream gauging stations may only capture part of the MBR flow path”. Thus, recharge determined by the DRA should be regarded as a “lower limit” of recharge for a given area.
Both approaches yield no recharge from 2005 onward, consistent with the period of high water scarcity (low rainfall) that has affected the Coquimbo Region in recent years (Garreaud et al. Citation2017, Nauditt et al. Citation2017). This result is consistent with water table dynamics recorded in six wells of the Chilean Water Authority (DGA) monitoring network in the Punitaqui Basin (). It should be acknowledged that these wells are primarily located in the northern part of the basin, in the alluvial terrace area (), so they may be influenced by agricultural activity in their vicinity (e.g. groundwater extraction, irrigation return flows). However, they actually show decreasing groundwater levels for the last 10 years, which could be related with, among other factors, extremely low (or non-existing) recharge, as identified in this work.
Also, it is interesting to note that the MTM method predicts many years of zero recharge. This outcome contrasts with the DRA results, for which a zero-recharge situation is not expected to occur. Because some infiltration is retained within the mountain block, rather than being discharged during the year it is recharged, the DRA tends to distribute or “smooth” inter-annual variations in recharge. Thus, years that yield a zero-recharge value by the MTM are predicted to have a finite positive recharge rate by DRA, reflecting MBR released from storage. Indeed, while 1998 was the driest year (least rain) of the analysed data record, with an annual precipitation of only 12 mm, DRA nonetheless registers a recharge value, albeit a low one. In other words, part of the recharge that occurred in previous years, especially in 1997 (which registered the greatest precipitation value, 511 mm) must have remained stored in the mountain system and been released gradually. This explains why the DRA method indicates the existence of recharge in years in which the water balance method predicts negligible recharge as a consequence of “insufficient rainfall”.
It should be pointed out that, in general, balance methods such as Thornthwaite-Mather are usually used for small- or medium-sized basins, with surface areas from dozens to a few hundred square kilometres (Westenbroek et al. Citation2010, Gong et al. Citation2012). Similarly, in the work of both Kirchner (Citation2009) and Ajami et al. (Citation2011), the DRA method was applied to small- and medium-sized basins (i.e. 20 and 100 km2, respectively). In fact, Kirchner (Citation2009) highlighted the need for additional studies to assess the method in basins larger than those assessed by that author. Given that the results obtained in the present work with both MTM and DRA are generally consistent and plausible, it can be inferred that these approaches may be applicable in larger basins, e.g. on the order of 1000 km2, at least in general terms with regard to the determination of average recharge rates over a period of several years. The satisfactory results obtained from the DRA method in the present study are also interesting in terms of application of the method within an arid to semi-arid climate context. In the study of Kirchner (Citation2009), precipitation levels in the study area exceeded 2500 mm year−1, while in the case of Ajami et al. (Citation2011), they fluctuated between 300 and 900 mm year−1. Thus, reasonably consistent results obtained from the DRA and MTM methods for the Punitaqui Basin suggest that these methods may produce acceptable results over a wider range of conditions (both size and climatic) than those to which they have previously been applied.
Finally, both methods identify a minimum total annual precipitation threshold, above which recharge could be expected to occur. This is around 190 mm for the MTM, as for years with precipitation lower than this value no recharge is determined. In the case of the DRA method, and by taking 2 mm as a “reasonable” minimum recharge value (considering the inherent uncertainties of the precipitation and discharge records required by the method), the precipitation threshold is around 180 mm. These values are consistent with a result obtained by Scanlon et al. (Citation2006), whose observations indicate that “rainfall below 200 mm usually results in negligible recharge”. The identification and validation of a minimum precipitation value, below which recharge would be unlikely to occur, has great practical importance in arid and semi-arid regions such as the Punitaqui Basin and other similar situations elsewhere. For example, a recent study financed by the Coquimbo Regional Government advocated the use of “rain harvesting” initiatives as a method for artificial recharge to aquifers in arid rainfed areas, even under conditions of very low precipitation (Romero Citation2015). The results of the present study indicate that practical application of such tactics for increasing recharge would not be effective unless considerable attention was paid to the nature, amount and variability of the rainfall itself, as well as to methods for circumventing the impacts of evapotranspiration and near-surface storage. Without considering the implications of the results presented here, it is likely that many attempted mitigations would be ineffective and a wasteful use of public resources.
Although the good correspondence between the results achieved by the two methods (MTM and DRA) provides confidence, it is reasonable to expect that some uncertainties are associated with the study findings. In particular, we note that the data analysed in this study for the MTM method begin in the early 1960s and continue until the present; however, over this timeframe it is likely that crop characteristics, such as crop types and areas of coverage, have changed and evolved. Since it was not possible to make corrections for such changes, it is not clear to what extent the results may have been affected by land-use trends. It should also be noted that the availability of data from only one raingauge in the basis introduces uncertainty into the analysis, particularly considering the size of the basin and the spatial variability in precipitation that could reasonably be expected at the basin scale. In spite of these uncertainties, the results obtained are supported not only by the consistency between the two methods, but by the fact that they are of the same order of magnitude as found by other investigators (especially for studies of arid zones), particularly in terms of the occurrence (timing, magnitude) of recharge (Scanlon et al. Citation2006, Healy Citation2010). While we do not present these results as exact values, they can be interpreted as providing a robust order of magnitude assessment of the expected recharge rates and timing in arid zones, such as the Punitaqui Basin and others elsewhere, suitable for planning purposes and as a guide to the design of future water management measures.
4 Conclusions
The work used a lumped approach to characterize the mountain block recharge (MBR) process in the Punitaqui Basin, considered representative of rainfed mid-mountain systems in North-Central Chile. First, using isotope and hydrological data allowed us to verify that a major source of surface flow corresponds to MBR. Then, we applied modified Thornthwaite-Mather (MTM) and discharge recession analysis (DRA) methods to examine the magnitude and temporal variation of groundwater recharge in the basin. On the basis of the results, it appears possible to use either the water balance or the discharge recession analysis method to quantify average recharge rates and temporal recharge dynamics, and we expect the general trends inferred for the Punitaqui Basin to be representative of many of the rainfed, mid-mountain systems in the arid North-Central region of Chile, and possibly of other, similar arid and semi-arid basins elsewhere.
Although there are year-to-year differences between the MTM and DRA methods, overall they converge toward a determination of recharge rates at around 1–4% of the annual precipitation value as a long-term average, consistent with values described in the literature for arid zones. However, the two methods predict slightly different behaviours when examined in detail. In particular, inter-annual variability in precipitation and crop type/cover observed in the data is more clearly reflected in the recharge values determined by the MTM method. In contrast, we observe that the DRA approach smoothed recharge on an annual basis by capturing annual carry-over storage within the mountain block. As a result of this smoothing, the method registers the existence of recharge in years in which the MTM method predicts no recharge due to “insufficient precipitation”. In any case, our analyses imply that significant recharge is unlikely except in years for which precipitation exceeds the annual average by around 20–25%, i.e. when annual precipitation reaches (or surpasses) approximately 180 mm.
The methods of analysis presented here are relatively simple in terms of their use, and our study shows they can be applied to good effect in arid to semi-arid basins on a medium scale (of the order of hundreds to a few thousand square kilometres), provided the basic information required for their implementation is available. In this sense, the DRA method is simpler to implement than the MTM method, as it is less demanding in terms of information requirements (i.e. “only” precipitation and daily discharge values).
Acknowledgements
The authors would like to thank Professor E. Muñoz (UCSC) for providing the gridded temperature data. This work was developed within the framework of Conicyt/Programa Fondecyt Project 1150587, the Water Resources and Environment Programme (PRHIMA, for its acronym in Spanish) of the Department of Mining Engineering of the Universidad de La Serena, and Conicyt/Fondap/15130015 Center CRHIAM. The paper benefited from the comments of two anonymous reviewers.
Disclosure statement
No potential conflict of interest was reported by the authors.
Additional information
Funding
References
- Ajami, H., et al., 2011. Quantifying mountain block recharge by means of catchment- scale storage- discharge relationships. Water Resources Research, 47, W04504. doi:10.1029/2010WR009598
- Allen, R., et al., 2006. FAO Irrigation and drainage paper Nº 56, Crop evapotranspiration. Available from: https://www.kimberly.uidaho.edu/water/fao56/fao56.pdf [ Accessed 12 April 2016].
- Almorox, J. (2007). Métodos de estimación de las evapotranspiraciones ETP y ETr. Available from: http://ocw.upm.es/ingenieria-agroforestal/climatologia-aplicada-a-la-ingenieria-y-medioambiente/contenidos/evapotranspiraciones [ Accessed 3 July 2016].
- Cade-Idepe, 2004. Diagnóstico y clasificación de los cursos y cuerpos de agua según objetivos de calidad: cuenca del río Limarí. Available from: http://www.sinia.cl/1292/articles-31018_Limari.pdf [ Accessed 15 July 2016].
- Casanova, M., Seguel, O., and Luzio, W., 2010. Suelos de la Zona Árida y Semiárida (Desde 29º hasta 32º S). In: W. Luzio, ed. Suelos de Chile. Santiago: Universidad de Chile, 76.
- CAZALAC-RHODOS, 2006. Applicación de metodologías para determiner la eficiencia del uso del agua. Estudio de caso en la Región de Coquimbo. Available from: http://documentos.dga.cl/USO4651.pdf [Accessed 25 March 2016].
- CIREN (Centro de Información de Recursos Naturales), 2012. Estudio Agrológico IV Región. Descripciones de suelos, materiales y símbolos. Actualización 2012 (Publicación N°129). Santiago, Chile: Centro de Información de Recursos Naturales.
- CNID (Consejo Nacional de Innovación para el Desarrollo), 2016. Ciencia e Innovación para los desafíos del agua en Chile. Consejo Nacional de Innovación para el Desarrollo. Available from: http://www.cnid.cl/2016/12/20/ciencia-e-innovacion-para-los-desafios-del-agua-en-chile/ [ Accessed 3 July 2017].
- CONAF (Corporación Nacional Forestal). 2014. Sistema de Información Territorial. Corporación Nacional Forestal. Available from: https://sit.conaf.cl/[ Accessed 3 May 2016].
- Coral, A.C., García, J.T., and Leal, A.C., 2015. Cálculo de balance hídrico usando modelamiento de datos espaciales: estudio aplicado a la cuenca del río Buena Vista, Ecuador. Formação, 1 (22), 119–137.
- DGA (Dirección General de Aguas) 2008. Evaluación de los recursos hídricos subterráneos de la cuenca del río Limarí. Informe Técnico (S.D.T. Nº 268). Available from: http://www.dga.cl/estudiospublicaciones/Paginas/seriesInformesTecnicos.aspx [ Accessed 3 November 2016].
- Garreaud, R.D., et al., 2017. The 2010–2015 megadrought in central Chile: impacts on regional hydroclimate and vegetation. Hydrology and Earth System Science, 21, 6307–6327. doi:10.5194/hess-21-6307-2017
- Gong, H., Pan, Y., and Xu, Y., 2012. Spatio-temporal variation of groundwater recharge in response to variability in precipitation, land use and soil in Yanqing Basin, Beijing, China. Hydrogeology Journal, 20 (7), 1331–1340. doi:10.1007/s10040-012-0883-x
- Green, G. and Stewart, S., 2008. Interactions between groundwater and surface water systems in the Eastern Mount Lofty Ranges. DWLBC Report 2008/27. Department of Water, Land and Biodiversity Conservation, Government of South Australia.
- Healy, R.W., 2010. Estimating groundwater recharge. Cambridge: Cambridge University Press.
- Herczeg, A.L. and Leaney, F.W., 2011. Review: environmental tracers in arid-zone hydrology. Hydrogeology Journal, 19, 17–29. doi:10.1007/s10040-010-0652-7
- Huerta, G., 2009. Hidrogeoquímica de aguas subterráneas en la cuenca del estero Punitaqui, IV región. Available from: http://repositorio.uchile.cl/handle/2250/103322 [ Accessed 15 August 2016].
- Israelsen, O.W. and Hansen, V.E., 1975. Irrigation principles and practices. New York: John Wiley and Sons.
- Kalthoff, N., et al., 2006. The energy balance, evapo-transpiration and nocturnal dew deposition of an arid valley in the Andes. Journal of Arid Environments, 65 (3), 420–443. doi:10.1016/j.jaridenv.2005.08.013
- Kirchner, J.W., 2009. Catchments as simple dynamical systems: catchment characterization, rainfall-runoff modeling, and doing hydrology backward. Water Resources Research, 45, 34. doi:10.1029/2008WR006912
- Livenais, P. and Aranda, X., 2003. Dinámica de los sistemas agrarios en Chile Arido: la Region de Coquimbo. Santiago: LOM Ediciones.
- Matsuura, K. and Willmott, C.J., 2015. Terrestrial air temperature: gridded monthly time series (1900-2014), Version 4.01. University of Delaware. Available from: http://climate.geog.udel.edu/~climate/html_pages/download.html#T2014 [ Accessed 28 November 2016].
- MBN (Ministerio Bienes Nacionales), 2017. Comunidades Agrícolas. Ministerio de Bienes Nacionales, Gobierno de Chile. Available from: http://www.comunidadesagricolas.cl/ [ Accessed 17 July 2017].
- Mendoza, G.F., et al., 2003. Estimating basinwide hydraulic parameters of a semi-arid mountainous watershed by recession flow analysis. Journal of Hydrology, 279, 57–69. doi:10.1016/S0022-1694(03)00174-4
- Nauditt, A., et al., 2017. Conceptual modelling to assess the influence of hydro-climatic variability on runoff processes in data scarce semi-arid Andean catchments. Hydrological Sciences Journal, 62 (4), 515–532. doi:10.1080/02626667.2016.1240870
- Núñez, J., et al., 2013. Influence of Pacific Ocean multidecadal variability in the distributional properties of hydrological variables in North-Central Chile. Journal of Hydrology, 501 (25), 227–240. doi:10.1016/j.jhydrol.2013.07.035
- Oyarzún, R., et al., 2014b. Applying a multi-method approach for surface water-shallow groundwater connectivity assessment. Hydrogeology Journal, 22, 1857–1873. doi:10.1007/s10040-014-1170-9
- Oyarzún, R., et al., 2014a. Recession flow analysis as a suitable tool for hydrogeological parameter determination in steep, arid basins. Journal of Arid Environments, 105, 1–14. doi:10.1016/j.jaridenv.2014.02.012
- Oyarzún, R., et al., 2015. A hydrogeochemistry and isotopic approach for the assessment of surface water-groundwater dynamics in an arid basin: the Limarí basin, North-Central Chile. Environmental Earth Science, 73, 39–55. doi:10.1007/s12665-014-3393-4
- Pouget, M.J., et al., 1996. Ambiente árido y desarrollo sustentable: la provincia del Limarí. Santiago. Chile: Universidad de Chile, Facultad de Ciencias Agrarias y Forestales; Institut Francais de Recherche Scientific pour le Dévelopment en Coopération.
- Romero, J. 2015. Estudio de cosecha de aguas lluvia en áreas de secano de la Región de Coquimbo. Corporación Regional de Desarrollo Productivo. Available from: www.crdp/biblioteca/hidrico/Resumen_ejecutivo_Cosecha_Aguas_Lluvia.pdf [ Accessed 1 October 2017].
- Scanlon, B.R., Healy, R.W., and Cook, P.G., 2002. Choosing appropriate techniques for quantifying groundwater recharge. Hydrogeology Journal, 10, 18–39. doi:10.1007/s10040-001-0176-2
- Scanlon, B.R., et al., 2006. Global synthesis of groundwater recharge in semiarid and arid regions. Hydrological Processes, 20, 3335–3370. doi:10.1002/(ISSN)1099-1085
- Scozzafava, M. and Tallini, M., 2001. Net infiltration in the Gran Sasso Massif of central Italy using the Thornthwaite water budget and curve-number method. Hydrogeology Journal, 9 (5), 461–475. doi:10.1007/s100400100151
- Sernageomin, 2003. Mapa Geológico de Chile (1:1.000.000). Servicio Nacional de Geología y Minería. Available from: http://www.ipgp.fr/~dechabal/Geol-millon.pdf. [ Accessed 3 January 2016].
- Strauch, G., et al., 2006. Contributions of the different water sources to the Elqui river runoff (northern Chile) evaluated by H/O isotopes. Isotopes in Environmental and Health Studies, 42 (3), 303–322. doi:10.1080/10256010600839707
- Touhami, I., et al., 2014. Comparative performance of soil water balance models in computing semi-arid aquifer recharge. Hydrological Sciences Journal, 59 (1), 193–203. doi:10.1080/02626667.2013.802094
- UN (United Nations), 2017. United decade for desert and the fight against desertification. Available from: http://www.un.org/en/events/desertification_decade/whynow.shtml [ Accessed 29 August 2017].
- UNEP/DEWA, 2002. A survey of methods for analysing groundwater recharge in arid and semi-arid regions (RS.02-2). Available from: http://wedocs.unep.org/handle/20.500.11822/8195 [ Accessed 2 July 2016].
- UNESCO, 2010. Atlas de Zonas Áridas de América Latina y el Caribe. Documentos Técnicos del PHI-LAC, N°25.
- Uribe, H., et al., 2013. Balances hidrológicos para estimar la recarga de acuíferos en el secano interior, Chile. Tecnología y Ciencias del Agua (ex Ingeniería Hidráulica en México), 8 (3), 17–28.
- Van Camp, M., et al., 2013. Modeling approaches and strategies for data-scarce aquifers: example of the Dar es Salaam aquifer in Tanzania. Hydrogeology Journal, 21, 341–356. doi:10.1007/s10040-012-0908-5
- Veit, H., 1996. Southern Westerlies during Holocene deduced from geomorphological and pedological studies in Norte Chico, Northern Chile (27–33°S). Palaeogeography, Palaeoclimatology, Palaeoecology, 123 (1–4), 107–119. doi:10.1016/0031-0182(95)00118-2
- Viviroli, D., et al., 2007. Mountains of the world, water towers for humanity: typology, mapping, and global significance. Water Resources Research, 43, W07447. doi:10.1029/2006WR005653
- Walraevens, K., et al., 2009. Groundwater recharge and flow in a small mountain catchment in northern Ethiopia. Hydrological Sciences Journal, 54 (4), 739–753. doi:10.1623/hysj.54.4.739
- Westenbroek, S.M., et al., 2010. SWB - A modified Thornthwaite-Mather soil-water-balance code for estimating groundwater recharge (Techniques and methods 6–A31). Available from: https://pubs.usgs.gov/tm/tm6-a31/. [ Accessed 5 May 2016].
- Wilkins, J. and Green, J., 2014. Comunidades agrícolas: antecedentes generales. Biblioteca del Congreso Nacional. Available from: http://www.bcn.cl/obtienearchivo?id=repositorio/10221/199241/COMUNIDADES%AGRICOLAS.f_va.doc [ Accessed 28 September 2017].
- Wilson, J.L. and Guan, H. 2004. Mountain-block hydrology and mountain-front recharge. In: J.F. Hogan, F.M. Philips, and B.R. Scanlon, eds.Groundwater recharge in a desert environment: the Southwestern United States. Water science application series. Washington, DC: American Geophysical Union, Vol. 9, 113–137.
- Xu, X.Y. and Singh, V.P., 2001. Evaluation and generalization of temperature-based methods for calculating evaporation. Hydrological Processes, 15, 305–319. doi:10.1002/hyp.119