
 ?Mathematical formulae have been encoded as MathML and are displayed in this HTML version using MathJax in order to improve their display. Uncheck the box to turn MathJax off. This feature requires Javascript. Click on a formula to zoom.
ABSTRACT
Multisource rainfall products can be used to overcome the absence of gauged precipitation data for hydrological applications. This study aims to evaluate rainfall estimates from the Chinese S-band weather radar (CINRAD-SA), operational raingauges, multiple satellites (CMORPH, ERA-Interim, GPM, TRMM-3B42RT) and the merged satellite–gauge rainfall products, CMORPH-GC, as inputs to a calibrated probability distribution model (PDM) on the Qinhuai River Basin in Nanjing, China. The Qinhuai is a middle-sized catchment with an area of 799 km2. All sources used in this study are capable of recording rainfall at high spatial and temporal resolution (3 h). The discrepancies between satellite and radar data are analysed by statistical comparison with raingauge data. The streamflow simulation results from three flood events suggest that rainfall estimates using CMORPH-GC, TRMM-3B42RT and S-band radar are more accurate than those using the other rainfall sources. These findings indicate the potential to use satellite and radar data as alternatives to raingauge data in hydrological applications for ungauged or poorly gauged basins.
Editor A. Castellarin Guest editor Y. Chen
Introduction
Rainfall data are very important for various hydrological models (at local, regional and global levels) and are used for water resource management, flood forecasting, warning services and drought monitoring (Shrestha et al. Citation2011). In the past few decades, the acquisition of precipitation data has been limited to ground-based observations using raingauges. However, such surface-based observations have low spatial coverage, especially in developing countries where surface-based data sources are limited or very scattered (Mei et al. Citation2014). To overcome these limitations, a number of global high-resolution spatial (≤0.125°) and temporal (≤3 h) satellite-based precipitation products are now freely available, such as the Global Land Data Assimilation System (GLDAS), Modern-Era Retrospective analysis for Research and Applications (MERRA), ERA-Interim, Global Precipitation Measurement (GPM), Tropical Rainfall Measuring Mission (TRMM), Global Precipitation Climatology Project (GPCP), Precipitation Estimation from Remotely Sensed Information using Artificial Neural Networks (PERSIANN), the CPC Morphing Technique (CMORPH) of the National Oceanic and Atmospheric Administration (NOAA) Climate Prediction Center (CPC), and many more. However, it remains a challenge to mitigate the uncertainties of satellite rainfall data, such as the gaps in revisit times, the poor direct relationship between remotely sensed signals and rainfall rate, and the atmospheric effects that modify the radiation field (Bitew and Gebremichael Citation2011).
Most importantly, different types of satellite precipitation data might have different accuracy and hydrological utility in different regions, which is crucial in determining which precipitation product is more suited to a particular region. This might be because of the inconsistency of satellite data and different retrieval algorithms; therefore, the satellite precipitation products need to be evaluated against raingauge network observations and their performance assessed using hydrological models (Karaseva et al. Citation2012). The validation of satellite data can be organized into three classes: (a) a series of field experiments and individual error source quantification; (b) direct comparison with raingauge rainfall and ground-based radar estimates; and (c) evaluation of the forecast ability on streamflow using hydrological models (Bitew and Gebremichael Citation2011). In recent years Adesina et al. (Citation2016) and Huffman et al. (Citation2007) have analysed the performance of satellite precipitation products on the common trend of temporal characteristics and spatial distribution, and have also considered error quantification (Xue et al. Citation2013). Li et al. (Citation2015) and Gao et al. (Citation2017) have evaluated the input suitability of satellite precipitation products for hydrological models on a yearly, monthly and daily basis in a river basin network. Some workers (e.g. Zhao Citation2006, Ma et al. Citation2009, Gao et al. Citation2017) have suggested that the performance of satellite data is good in eastern China and that satellite data represent a suitable alternative to raingauge networks.
Apart from satellite rainfall products, radar systems have been used to detect precipitation echoes via snapshots of electromagnetic backscatter from raindrops in a cloud band. Radar systems have the capability to provide rainfall estimation at high spatial and temporal resolution over hundreds of kilometres. An evaluation of radar–gauge merging methods for quantitative precipitation estimates was given by Goudenhoofdt and Delobbe (Citation2009). There are some limitations, such as season, region, nature of the precipitation, ground clutter, anomalous propagation, vertical reflectivity profile, Z–R relationship and sampling, which contribute error in rainfall estimation. Different techniques have been applied to overcome these limitations (e.g. Kitchen Citation1997, Rico-Ramirez and Cluckie Citation2007). Continuous radar-based rainfall estimation is ideal for flood modelling for a variety of storms, basins and hydrological models. Input of radar–rainfall estimates can be expected to improve runoff prediction by hydrological models (Sun et al. Citation2000). The driving power for successful hydrological modelling and its application is accurate areal rainfall estimation (Cole and Moore Citation2009). These radar–rainfall relationships are usually applied to single polarization radar systems and are still in use today (Chandrasekar and Cifelli Citation2012). However, hydrological modelling in poorly gauged areas is still a challenge. This challenge could be better addressed through lumped, semi-distributed and distributed models, and may be possible if we have high-resolution spatial and temporal data. Keeping in view the research gap and importance of the issue, this study aims to investigate the hydrological evaluation of rainfall estimates from radar, satellite, raingauges and satellite–gauge combinations on the Qinhuai River Basin in China. The specific objectives were to evaluate the potential and reliability of the five most widely used global high-resolution satellites (C_MORPH, CMORPHGC, ERA-Interim, GPM_3IMERGHHE_03 and TRMM 3B42V7) and S-band weather radar rainfall products against raingauge data for flood simulation and real-time flood forecasting purposes. The results are intended to provide comparative, reliable analyses of the patterns of precipitation and flow, which would be helpful to describe and understand the limits of predictability and reliability of satellite-based and radar rainfall products, relative to raingauge measurements. Furthermore, the outcomes would be used assess the potential utility of all multisource rainfall products as inputs to real-time flood and flash-flood prediction systems. Finally, this study aims to guide the development of combined multisensory rainfall algorithms by analysing the impacts of adjustments from raingauges at the hourly scale, which could be helpful to provide a scientific basis for decision making and better use of datasets for hydrological modelling and flood prediction.
Study area and data availability
Study area
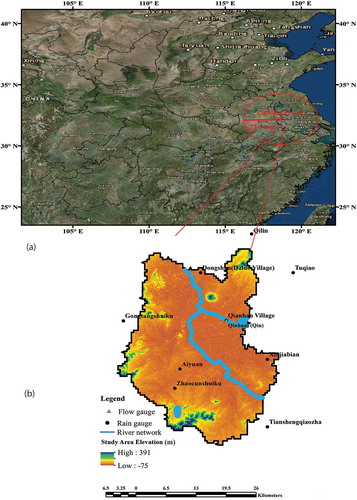
The Qinhuai River Basin covers an area of 799 km2 in Nanjing, China. Nanjing is located in the lower reaches of the Yangtze River, which is in the north-subtropical climatic zone, with mean annual temperature and rainfall of 15°C and 1033 mm, respectively. This causes river flooding, particularly during June and July (Jim and Chen Citation2003). The catchment topography varies from mountains to low hills and plains. shows the scanning area of the China New-generation Doppler weather Radar S-band conventional radar (CINRAD-SA) (radius: 230 km). The catchment is about 10 km from the radar site and the locations of the raingauges, flow gauges and the river network within the catchment are also shown in . The gauge density for the study catchment is 0.0112 gauges per km2.
Figure 1. (a) Map of the study area showing the scanning area of the CINRAD-SA radar and (b) Qinhuai River Basin and streamflow stations with rainfall and flow gauges.
Hydrological data
For the verification of satellite and radar rainfall estimates, ground rainfall measurements are important to ensure consistency. We considered nine raingauge stations located within the Qinhuai River Basin, five of which were within the study area and four of which were located close to the catchment (see ). Hourly rainfall measurements and flow data for the period 2010–2015 were collected from the Bureau of Hydrology in Nanjing. The data include calibration and validation data for the three flood events to be analysed.
CINRAD-SA rainfall estimates
The CINRAD system is similar to the Weather Surveillance Radar-1988 Doppler (WSR-88D) of the USA. It is operated with a spatial resolution of 1° × 1° km and temporal resolution of 6 min, scanning at nine angles (0.5°, 1.5°, 2.4°, 3.4°, 4.3°, 6.0°, 9.9°, 14.5° and 19.5°) for volume coverage with a wavelength of λ = 10 cm (Chu et al. Citation2014). The Z–R relationship (Z = 300R1.4 for convective clouds and Z = 200R1.6 for stratiform clouds) was applied to estimate precipitation for the CINRAD-SA (Gao et al. Citation2016). It is located at 118.64°E and 32.19°N at a height of 139 m, with coverage of a 230-km radius from the instrument location. The accuracy of the radar raw echo is important to ensure accuracy in the rain products, and thus a quality control scheme was applied as described by Ye et al. (Citation2013). The parameters of the CINRAD-SA radar are shown in .
Table 1. S-band radar (CINRAD-SA) parameters.
ERA-Interim dataset
The ERA-Interim dataset is generated by the European Centre for Medium-Range Weather Forecasts (ECMWF) global model for forward integration in the 4D-variational analysis in a 3-h temporal window. ERA-Interim is a re-analysis product based on a range of available observations and data that is significantly accurate; however, it may not be considered as real observational data (Mooney et al. Citation2011). Precipitation is estimated using a numerical model from temperature and humidity data, which are derived from assimilated passive microwave (PMW) and in situ measurements (Dee et al. Citation2011). These re-analysis data cover the period from 1979 to the present day. The ERA-Interim dataset used in this study was obtained from the ECMWF data serverFootnote1 on a fixed grid of 0.125° for the period 1 July 2014 to 5 July 2015.
GPM rainfall products
After the success of the National Aeronautics and Space Administration (NASA) Tropical Rainfall Measuring Mission (TRMM), the Global Precipitation Measurement (GPM) mission started to release the next generation of rainfall products. The GPM mission was launched by NASA and the Japan Aerospace Exploration Agency (JAXA) on 28 February 2014. The GPM mission has dual-frequency precipitation radar (DPR; the Ku-band at 13.6 GHz and Ka-band at 35.5 GHz), and a conical-scanning multichannel microwave imager (GMI; 13 different microwave channels with frequencies ranging from 10 to 183 GHz). Therefore, the GPM sensors have a wider band than TRMM instruments and have more capacity to detect smaller and solid precipitation (Huffman et al. Citation2017). The input precipitation estimates were computed with the GPM combined instrument product and various satellite passive microwave sensors inter-calibrated. These two products were morphed and combined with geo-IR (infrared) fields, and adjusted with monthly surface precipitation gauge analysis data (where available). From 1 April 2014, the analysis also includes the final post-real-time run of the GPM IMERG Final Precipitation L3 Half Hourly 3IMERGHH product from the GPM mission. This product is characterized by fine spatial resolution (0.1°) and can provide half-hourly and monthly precipitation estimates on a 10-km grid over the domain 60°N–60°S. In this study, 3IMERGHH-03 30-min rainfall rate data were downloaded from https://giovanni.gsfc.nasa.gov/giovanni.
TRMM-PA rainfall products
The National Space Development Agency (NASDA, Japan) and NASA launched the TRMM Multisatellite Precipitation Analysis TMPA 3B42V7 and 3B42RT in November 1997. It was designed primarily to monitor and study tropical precipitation for weather and climate research (Kumar et al. Citation2017). According to Huffman et al. (Citation2010), the accurate precipitation estimates of TMPA were produced by merging three types of observations, PMW, IR and precipitation radar (PR), from multiple low earth orbit (LEO) and geostationary (Geo) satellites and ground observations at a spatial resolution of 0.25° × 0.25°, with a temporal resolution of 3 h; however, PR, PMW and IR operate within the global latitude belts over 35°N–35°S, 40°N–40°S and 50°N–50°S, respectively. Thus, the TMPA algorithm could be executed by applying the calibrated PMW precipitation estimates to create IR precipitation estimates and merging the PMW and IR data to provide optimal TMPA precipitation estimates. The TMPA v.7 algorithm consists of two standard products: the near-real-time version (3B42RT) and post-real-time version (3B42). The 3B42RT data are available approximately 9 h after the real-time observations; however, 3B42 data become available about 10–15 days after the end of each month. TRMM provides a range of rainfall products; in this work, we analysed only the TMPA 3B42 v.7 precipitation dataset.Footnote2
CMORPH rainfall product
The inputs for CMORPH and TRMM 3B42 are the same, but CMORPH does not involve the merging of PM and IR rainfall estimates (Joyce et al. Citation2004). The very high spatial (8-km grid) and temporal (30-min) resolution CMORPH data product began in December 2002. Today, the data are available at a spatial resolution of 0.25° and at a 3-h temporal resolution, extending globally from 60°N to 60°S (Jiang et al. Citation2012). The 3-h, 0.25° average rainfall used in this study was freely obtained from NOAA-CPCFootnote3.
CMORPH Gauge China (CMORPHGC)
CMORPH Gauge China (CMORPHGC) is a merged dataset of satellite and China gauge station data. First, quality control is applied to the gauge stations; then they are used to correct the 8-km/30-min CMORPH product with the help of a pdf (probability distribution function) matching technique to obtain the CMORPHGC. This is the first dataset that has been produced from dense gauge observations and it offers excellent reference precipitation information with fine spatial (0.1°) and temporal (1-h) resolution. The range extends across 15°S–44°N and 70°W–140°E, covering the whole of China. It is expected that it can outperform both of its originators (Gauge and CMORPH). During snowfall, the performance of CMORPHGC is limited because gauge stations are not reliable for snowfall. Chen et al. (Citation2015) briefly reported on this product. The spatial and temporal resolution and coverage of the remotely sensed satellite and re-analysis data are given in .
Table 2. Remotely sensed satellite and re-analysis data used in this study.
Methodology
In order to unify the temporal resolution of all data, as well as maintain the accuracy of satellite precipitation and the impact of precipitation inputs on hydrological applications, all the data from different satellites, radar, raingauge and flow gauges were interpolated or aggregated to 3-h temporal resolution. This temporal resolution may have sufficient impact on the catchment size and steepness. While it may not have an impact on larger catchments, it could cause significant impact on small catchments.
Rainfall–runoff model description
The probability distribution model (PDM) is a conceptual lumped rainfall–runoff model. It uses the probability distribution function (pdf), which shows the spatial distribution of soil moisture deficit in the catchment along with two parallel linear reservoirs. The soil moisture storage capacity, C (mm), can be described by a Pareto distribution function:
where Cmax is the maximum storage capacity at any location in the catchment and factor b controls the variability of storage capacity within the catchment. More deep stores than shallow stores are generated when b is between 0 and 1; however, there is a greater frequency of shallow stores when b is greater than 1. The standard PDM model employs two linear stores with time constants k1 and k2, which describe the surface flow, whilst the moisture stores drain to form the groundwater recharge as a nonlinear function of the effective store contents with a time constant kg. This recharge forms the input to the subsurface storage, which is usually taken to be a cubic store with time constant kb. The subsurface flow is finally added to the surface runoff to form the total outflow at catchment outlet. The probability-distributed model divides the rainfall into three parts: surface runoff, groundwater recharge and soil moisture storage. The direct runoff is generated from the saturated surface storage contributed by a series of the probability-distributed stores over the catchment. It is designed as a fast response system, and most commonly represented by a cascade of two linear reservoirs with time constants k1 and k2 expressed as an equivalent transfer function model constrained to preserve continuity (O’Connor Citation1982). Details of the PDM may be found in the literature (Pechlivanidis et al. Citation2010, Zhu et al. Citation2014). The reader is referred to the study of Moore (Citation2007) to understand the pdf and schematic diagram of the PDM model in detail. The PDM-suggested values of parameters for the study area are shown in .
Table 3. PDM parameter values for the Qinhuai River Basin.
Validation statistics
The differences among all precipitation data were quantified by bias, mean absolute error (MAE), root mean square error (RMSE), and the coefficient of determination (R2), which are estimated by the following equations:
where Si represents the satellite and radar data and Gi represents the gauge measurements, while n is the total number of readings. The bias shows the difference between two sources. The MAE was used to indicate the average magnitude of error, the RMSE was used to scale the average difference between the satellite/radar and raingauge precipitation, while R2 was used to indicate the correlation between the two data sources (Shrestha et al. Citation2011, Tang Citation2016). A Taylor diagram was applied to quantify agreement between patterns of all rainfall data in terms of their correlation, RMSE and the ratio of their variances. All of the above indicators are shown in a single Taylor diagram, which has been used in other studies, for example Shi et al. (Citation2015) and Blacutt et al. (Citation2015).
Performance statistics
Performance statistics were used to quantify the errors of streamflow simulations from all rainfall products. The RMSE, correlation coefficient (R2), percent error in peak discharge (PEP) and peak time error (PTE) were calculated as follows:
where Qs and Qo are the simulated and observed flows, respectively; and
are the mean values of observed and simulated flows, respectively; and
and
are the times to peak for simulated and observed data, respectively. The overall quality of the simulation was evaluated through the Nash-Sutcliffe efficiency coefficient (Nash and Sutcliffe Citation1970), which measures how well the plot of observed versus predicted values fits the 1:1 line, and can vary from
to 1. A negative value indicates that model predictions are not better than the average of the observed data.
Model calibration and validation
The PDM model was used to carry out the calibration within a generic model calibration shell environment, which provides for both automatic optimization and informal visually-interactive parameter estimation. Nelder and Mead (Citation1965) provided a simplex direct search procedure for automatic optimization, with further modifications suggested by Gill et al. (Citation1981). Informal estimation is supported by an interactive visualization tool, which allows the user to see instantaneously the effect that a change of parameter has on the shape of the hydrograph. This can be an invaluable aid to understanding the model response and the nature of the dependence between parameters. Additionally, the calibration environment can also provide analysis of mean and peak error statistics for simulated and forecast flows, including the error response (objective function) surface analysis for a pair of parameters in contour form, which can be used in the investigation of parameter independence (Moore Citation2007). In order to achieve the best fit between observed and modelled flow, the model parameters were calibrated in simulation mode using a mixture of manual and automatic parameter adjustment based on the functionalities in the model.
The model was calibrated using a combination of manual and automatic optimization. The RMSE and R2 were monitored along with percentage PE and PTE (Equations (6)–(9)) to evaluate the performance of the model. The 3-h meteorological dataset for the period 12 July 2010 to 20 June 2011 was used to calibrate the PDM over the Qinhuai River Basin and the predicted hydrograph for the calibration is given in . It may be seen that the model-generated peaks (referred to as Peak-1 and Peak-3) are in phase with actual flow, while Peak-2 shows a lag in the rising and falling limbs. The amplitude of all three peaks closely resembles actual flow.
Figure 2. Model calibration and validation flow results of (a) calibration (12 July 2010–20 June 2011) and (b) validation (12 July 2012–20 June 2013) of the PDM model for the Qinhuai River Basin catchment.
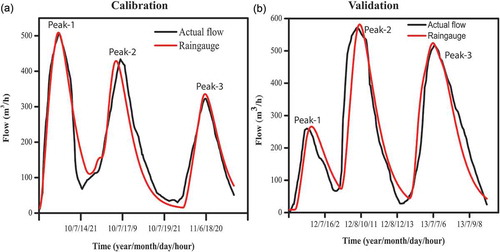
The calibrated model was applied to the flow for the period 12 July 2012 to 20 June 2013, and the validation results are shown in . The amplitude of both actual and observed peaks is similar. However, Peak-1 shows a delay, Peak-2 shows a delay for only the rising limb and Peak-3 shows a delay in the rising limb but is very similar in amplitude and the falling limb.
gives the values of RMSE and R2 of model simulations for the calibration and validation periods. The R2 for calibration and validation is, respectively, 0.91 and 0.85. For comparison, Alazzy et al. (Citation2017) described smaller values of calibration and validation (0.81 and 0.67) for the Ganzi River Basin, China. Similarly, Gao et al. (Citation2017) reported lower values of R2 for calibration and validation; they also mentioned overestimation in the validation period for the Jialiang River Basin, China. However, due to model divergence, the performance of a model in the validation period is always poorer than that for calibration (Sorooshian and Gupta Citation1995).
Table 4. Statistical indicators for calibration and validation using actual flow and raingauge data.
Results and discussion
To better understand the impact of precipitation inputs on the hydrological model, the accuracy of the satellite precipitation and S-band radar data was first assessed against the raingauge observations. Thus we compared the CMORPH, CMORPHGC, ERA-Interim, GPM, TRMM, S-band radar and raingauge observations with the basin-average precipitation for three events in the period 1 July 2014 to 21 July 2015, shown in together with the peak flow for each event.
Table 5. Flood events analysed and highest peak flow for each event.
Rainfall comparison
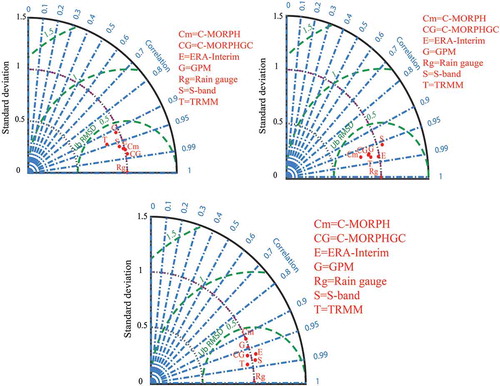
Event 1 occurred on 1–8 July 2014. shows statistical indicators for the CMORPH, CMORPHGC, ERA-Interim, GPM, TRMM and S-band radar rainfall estimates relative to the raingauge data. The rainfall estimated by CMORPH and CMORPHGC has lower MAE and RMSE, whereas that estimated by GPM has higher RMSE and MAE (). Based on the statistics, the performance of all the satellite and radar data was good. (Event-1) shows that there was good correlation for CMORPHGC, with a value of 0.98, while all other sources had a correlation of more than 0.90. By comparison, Gao et al. (Citation2017) reported that a low density of raingauge stations in the Tuojiang River catchment, China, may explain the lower correlation for TRMM observed in their study. They found that SD of all other sources was around 1, while that of TRMM was 0.70 and the ubRMSD for all rain estimators was below 0.50. Some studies, for instance Sharifi et al. (Citation2016), stated that mountainous topography, high rate of mean annual precipitation and spatial resolution of satellites (occurrence of rainfall at a smaller scale) may have caused the underestimation of rainfall by GPM, ERA and TRMM over Iran.
Table 6. Statistical parameters of rainfall estimates from satellite and radar data relative to raingauge data for the three study events.
Figure 3. Taylor diagrams showing correlation coefficients, standard deviations and unbiased root mean square differences (UbRMSD) between rainfall estimators C-MORPH (Cm), C_MORPHGC (CG), ERA-Interim (E), GPM (G), TRMM (T) and S-band radar (S) for Events 1, 2 and 3.
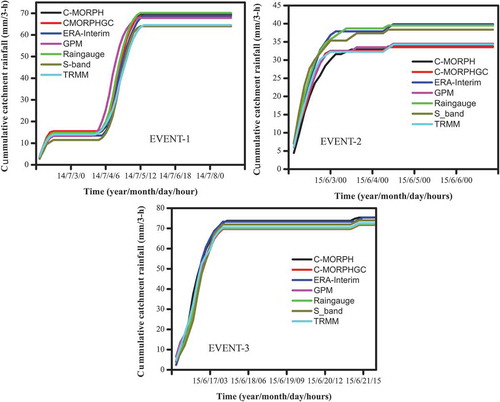
The results of cumulative precipitation analysis for Event 1 are shown in (Event-1), which clearly indicates that C-morph, ERA, GPM and S-band radar tended to significantly underestimate rainfall volume, whereas C-band, C-morphGC and TRMM captured spatial patterns and rainfall volumes well when compared to raingauge data.
Figure 4. Comparisons of catchment cumulative rainfall from raingauge, C-morph, CMORPHGC, ERA-Interim (ERA), GPM, TRMM and S-band radar for Events 1, 2 and 3.
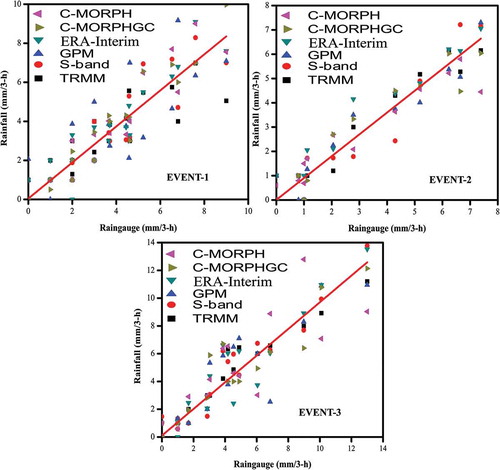
Continuous verification statistical methods are commonly used for verifying how estimated values vary from those of observations, such as the accuracy in the measure of precipitation. These methods include some exploratory plots, such as scatter plots and box plots. (Event-1) shows scatter plots of area-averaged 3-h rainfall for Event 1 (1–8 July 2014). The rainfall measured from the gauge is compared to that obtained by C-band, C-morph, C-morphGC, ERA, GPM, TRMM and S-band radar data sources. It is clear from Figure 5 that there is a not a wide scatter of points at low intensity rainfall, but when the intensity of rainfall increases all source points are scattered much more widely. Most data sources showed little underestimation.
Figure 5. Comparisons of 3-h average catchment rainfall from raingauge, CMORPH, CMORPHGC, Era-Interim (ERA), GPM, TRMM and S-band radar for Events 1, 2 and 3.
Event 2 occurred on 2–6 June 2015. The different statistical indicators for the rainfall estimated based on CMORPH, CMORPHGC, ERA-Interim, GPM, TRMM and S-band radar relative to raingauge data are listed in . It can be seen that the TRMM had a lower RMSE and ERA had lower MAE, while GPM has higher MAE and S-band radar has higher RMSE. The performance of all the satellite and radar data looks good according to the statistics.
(Event-2) shows good correlation with all estimators greater than 0.95. The SD of S-band radar was above 1 and that of all sources was less than 1. The S-band radar overestimated rainfall and all other sources underestimated it. Tang (Citation2016) reported higher R2 values for TRMM and GPM (0.87 and 0.90) as well as underestimation of GPM and TRMM over the Ganjiang River Basin in China, which is similar to this study area. Our results also evidenced that the under- and overestimations may be related to the topography of the basin and the smaller number of gauges.
(Event-2) shows the cumulative rainfall over the catchment for this event. The amount of precipitation obtained by the different sources is compared with raingauge data for every 3 h. The scatter plots showing the differences between the different sources and 3-h rainfall data are provided in (Event-2).
Event 3 occurred in the period 16–21 June 2015. shows the detailed statistics for the rainfall estimates from CMORPH, CMORPHGC, ERA-Interim, GPM, TRMM, and S-band radar relative to the raingauge estimation. The results indicate that all datasets performed well in terms of MAE and RMSE. (Event-3) displays good correlation for all rainfall estimators are above 0.95, except CMORPH (0.91). Tang (Citation2016) reported that the high R2 for GPM over the Ganjiang River Basin may be related to the study taking place during the heavy rain season, as GPM performs better in heavy rain. However, in this study, in the same geographical location, the ubRMSD of all sources was below 0.5, and all the sources gave results very close to raingauge data with small or no dispersion. The ERA and S-band radar slightly overestimated rainfall, while all other rain estimators showed underestimation. Zhao et al. (Citation2015) investigated the sensitivity of TRMM for low and high rainfall and suggested it may be associated with vertical attenuation of radar wavelength, which caused underestimation in the Weihe River Basin, China. The SD of TRMM and S-band radar was above 1, while for the other sources of rainfall data it was below 1. In addition, all sources except for TRMM and CMORPH showed the same tracing path as the raingauge data. Cumulative rainfall for Event 3 is shown in (Event-3) and the comparison of amount of precipitation for every 3-h time step between the raingauge and CMORPH, CMORPHGC, TRMM, GPM, ERA-Interim or S-band radar is shown in (Event-3).
Flow simulation comparison
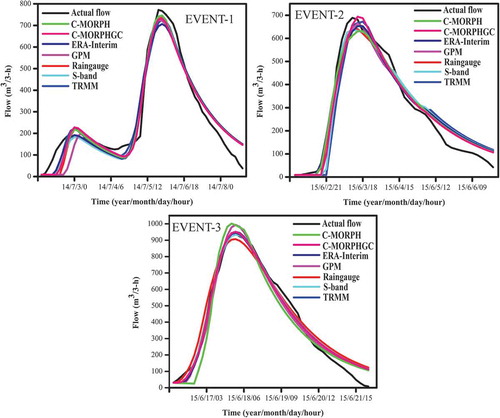
The simulated hydrographs for this event were compared with the actual flow (Event-1). This analysis indicates that there was little underestimation in magnitude of the peak for all data sources relative to actual flow. Jiang et al. (Citation2012) stated that complex topography might be the cause of underestimation of TRMM and C-morph over the Mishui Basin, Xiangjing River, China. In our study, the timing is good for all rain estimators; however, all data sources showed a lag behind the actual data and overestimation at the recession end of the curve.
Figure 6. Comparison of computed and observed 3-h resolution flow for the Qinhuai River Basin for Events 1, 2 and 3. See caption for explanation of abbreviations.
The performance statistics for the three study events are presented in . For Event 1, the statistics indicators are shown in ; all sources have higher values of R2 (0.94) and only GPM has a low value (R2 = 0.92).
Table 7. Performance indicators of flow comparing raingauge data and CMORPH, CMORPHGC, ERA-Interim, GPM, TRMM and S-band radar data for the three study events.
The simulated hydrographs obtained with different inputs for Event 2 compared to the actual flow is shown in (Event-2). It is clear that the magnitude of the peak for all data sources showed a slight underestimation relative to actual flow, except for CMORPHGC. Jiang et al. (Citation2012) reported the underestimation of C-morph over the Mishui Basin, China. The timing in our study is good for all sources except CMORPHGC, which shows a delay in the rising limb. However, all data sources showed lag and overestimation at the falling limb.
shows the statistics for Event 2. In terms of R2, the model using the raingauge rainfall estimates had a higher value, of 0.97. The value of R2 between actual flow and flow generated by S-band data is 0.96. Similarly, S-band radar has zero PTE, which indicates that in this event the performance of S-band radar is comparatively better. Moreover, all other estimates have the 3-h delay; only CMORPH and TRMM have a 6-h delay. The PET for CMORPHGC (–0.58) and CMORPH (8.41) show the good fit of simulated and measured flow.
(Event-3) shows that all the estimators had good agreement with the actual flow in timing; however, the CMORPH and GPM slightly underestimated flow. All the sources showed slight delay for the falling limb and the timing is good. The performance of all data sources was good for hydrological modelling in the Qinhuai River Basin, with only a small uncertainty in the rainfall product, which may be associated with sampling, instrumentation, algorithmic error and geophysical features. The statistics for Event 3 are presented in . The R2 for all estimators is more than 0.94. RMSE values for all data sources were between 44 and 71, while only CMORPH had a greater RMSE of 71.41. The time of peak for CMORPH is 3 h earlier, while all other estimators gave the same timing for peak flow. The PEP for the raingauge data was 3.51 and for other sources it was either zero or negative.
Conclusion
Hydrological prediction is essential for regional and global water resource management. Satellite precipitation products offer new kinds of input data with high spatial and temporal resolution (i.e. giving continuous and universal coverage). This study aimed to discover the potential of satellite-based precipitation estimates for flood forecasting at the catchment level. The study focused on the statistical evaluation of rainfall estimates from TRMM 3B42RT, GPM, CMORPH, CMORPHGC, ERA-Interim and S-band radar, and evaluated their utility for streamflow prediction using the PDM model in the lower Qinhuai River Basin, Nanjing, China. Many topographical factors may affect the behaviour of the catchment. Furthermore, in addition to the catchment size, the rainfall timespan may also have a significant impact on the outflow of the catchment. The performance of different rainfall estimators in this investigation showed that CMORPHGC had a higher coefficient of determination (0.98) but lower MAE (0.24) and RMSE (0.51) in Event 1, whereas in Event 2 all the estimators indicated good performance, with R2 of more than 0.96 and lower MAE (up to 0.17) and RMSE (up to 0.61). However, for Event 3, the TRMM and S-band radar had higher R2 (0.98), while that of the remaining sources was around 0.95. The MAE for TRMM and CMORPH was higher, showing good performance, while CMORPH and TRMM had lower RMSE values, showing relatively poor performance. In summary, the results of Event 1 indicate that CMORPHGC had the best overall performance (based on R2 and RMSE of 0.94 and 51.3, respectively. For Event 2, the raingauge data showed the greatest resemblance to actual flow on the basis of R2 and RMSE (0.97, 41.25) and visual inspection of the hydrograph, followed by CMORPHGC, ERA-Interim, GPM, S-band radar, CMORPH and TRMM (R2 of 0.96, 0.95, 0.96, 0.95, 0.96 and 0.93, respectively). For Event 3, the TRMM, S-band radar and CMORPHGC sources outperformed the others (which followed in the order raingauge data, ERA, GPM and CMORPH). Overall the CMORPHGC and S-band radar outperformed the other data sources.
The PDM model was able to capture the 3-h observed streamflow quite well in both magnitude and timing. A small PEP was observed for raingauge, CMORPHGC, TRMM and S-band, respectively, for Events 1, 2 and 3, while small PET was observed for all sources, showing good performance for all events. The simulated peak flows using PDM-based streamflow being consistent with actual streamflow observations indicates the potential of satellite and ground-based S-band radar precipitation data for flood prediction. The spatial and temporal distributions of all sources were different, as the PDM is a lumped model, so we converted temporal resolution to the requirement of the model. In the next phase of investigation, we propose using a distributed model so that conversion of spatial and temporal scales will be taken into account.
This study may help to improve our understanding of the potential and utility of various satellite and S-band radar rainfall products for hydrological applications, flood forecasting and water management.
In summary, the CMORPHGC and S-band radar outperformed other rain estimators in the rainfall comparison against raingauge measurements, while the CMORPHGC, TRMM and S-band radar have better performance in hydrological simulations. All the satellite products and S-band radar have the potential to be used as input data for hydrological models on a 3-h basis, especially in ungauged areas. Further investigation of river basins using a distributed hydrological model may give better results and may show the impact of spatial resolution on the performance of datasets and model; more studies are required to explore the potential of multisource rainfall data used in long-term water resource management under climate change. The important innovations of this article are:
The predictability of remotely sensed rainfall products was estimated and validated statistically on the study basin using multidata sources simultaneously.
The hydrological behaviour of the study catchment was studied for the first time on a sub-daily basis, specifically, every 3 hours.
Acknowledgements
The DEM, TRMM, GPM, ERA-Interim, C-morph, S-band, raingauge and flow data used in this study were downloaded/collected from the respective sources given in the text. The authors wish to extend their sincere gratitude to all of them. We also owe our sincere thanks to the Centre for Ecology and Hydrology (Wallingford, UK) for providing the PDM model. Finally, we gratefully acknowledge the help of Dr Geoff Austin who reviewed an earlier version of this paper.
Disclosure statement
No potential conflict of interest was reported by the authors.
Additional information
Funding
Notes
2 The data for the entire study period are archived at http://disc.sci.gsfc.nasa.gov/precipitation/tovas/.
References
- Adesina, A.J., et al., 2016. Intercomparison and assessment of long-term (2004-2013) multiple satellite aerosol products over two contrasting sites in South Africa. Journal of Atmospheric and Solar-Terrestrial Physics, 148, 82–95. doi:10.1016/j.jastp.2016.09.001
- Alazzy, A.A., et al., 2017. Evaluation of satellite precipitation products and their potential influence on hydrological modeling over the Ganzi River Basin of the Tibetan Plateau. Advances in Meteorology, 2017, 1–23. doi:10.1155/2017/3695285
- Bitew, M.M. and Gebremichael, M., 2011. Evaluation of satellite rainfall products through hydrologic simulation in a fully distributed hydrologic model. Water Resources Research, 47 (6), 1–11. doi:10.1029/2010WR009917
- Blacutt, L.A., et al., 2015. Precipitation comparison for the CFSR, MERRA, TRMM3B42 and Combined Scheme datasets in Bolivia. Atmospheric Research, 163, 117–131. doi:10.1016/j.atmosres.2015.02.002
- Chandrasekar, V. and Cifelli, R., 2012. Concepts and principles of rainfall estimation from radar: multi sensor environment and data fusion. Indian Journal of Radio and Space Physics, 41 (4), 389–402.
- Chen, S., et al., 2015. Hydrologic evaluation of the TRMM multisatellite precipitation analysis over ganjiang basin in Humid Southeastern China. IEEE Journal of Selected Topics in Applied Earth Observations and Remote Sensing, 8 (9), 4568–4580. doi:10.1109/JSTARS.2015.2483484
- Chu, Z., Yin, Y., and Gu, S., 2014. Characteristics of velocity ambiguity for CINRAD-SA doppler weather radars. Asia-Pacific Journal of Atmospheric Sciences, 50 (2), 221–227. doi:10.1007/s13143-014-0010-0
- Cole, S.J. and Moore, R.J., 2009. Distributed hydrological modelling using weather radar in gauged and ungauged basins. Advances in Water Resources, 32 (7), 1107–1120. doi:10.1016/j.advwatres.2009.01.006
- Dee, D.P., et al., 2011. The ERA-Interim reanalysis: configuration and performance of the data assimilation system. Quarterly Journal of the Royal Meteorological Society, 137 (656), 553–597. doi:10.1002/qj.v137.656
- Gao, Y., et al., 2016. Radar-rainfall estimation from S-band radar and its impact on the runoff simulation of a heavy rainfall event in the Huaihe River Basin. Journal of the Meteorological Society of Japan. Ser. II, 94 (1), 75–89. doi:10.2151/jmsj.2016-005
- Gao, Z., et al., 2017. Assessing the potential of satellite-based precipitation estimates for flood frequency analysis in ungauged or poorly gauged tributaries of China’s Yangtze River basin. Journal of Hydrology, 550, 478–496. doi:10.1016/j.jhydrol.2017.05.025
- Gill, P.E., Wright, M.H., and Murray, W., eds., 1981. Practical optimization. Practical Optimization Algorithms and Engineering Applications L, 13, 1–669. .
- Goudenhoofdt, E. and Delobbe, L., 2009. Evaluation of radar-gauge merging methods for quantitative precipitation estimates. Hydrology and Earth System Sciences Discussions, 13, 195–203. doi:10.5194/hess-13-195-2009
- Huffman, G.J., et al., 2007. The TRMM multisatellite precipitation analysis (TMPA): quasi-global, multiyear, combined-sensor precipitation estimates at fine scales. Journal of Hydrometeorology, 8, 38–55. doi:10.1175/JHM560.1
- Huffman, G.J., et al., 2010. The TRMM multi-satellite precipitation analysis (TMPA). In F. Hossain and M. Gebremichael, eds. Satellite applications for surface hydrology. Dordrecht: Springer, 3–22.
- Huffman, G.J., Bolvin, D.T., and Nelkin, E.J., 2017. Integrated multi-satellite retrievals for GPM (IMERG). NASA-Goddard Space Flight Center. Technical Documentation. 1–6. Available from: https://pmm.nasa.gov/resources/documents/gpm-integrated-multi-satellite-retrievals-gpm-imerg-algorithm-theoretical-basis- [Accessed 12 Apr 2018].
- Jiang, S., et al., 2012. Comprehensive evaluation of multi-satellite precipitation products with a dense raingauge network and optimally merging their simulated hydrological flows using the Bayesian model averaging method. Journal of Hydrology, Elsevier B.V., 452–453, 213–225. doi:10.1016/j.jhydrol.2012.05.055
- Jim, C.Y. and Chen, S.S., 2003. Comprehensive greenspace planning based on landscape ecology principles in compact Nanjing city, China. Landscape and Urban Planning, 65 (3), 95–116. doi:10.1016/S0169-2046(02)00244-X
- Joyce, R.J., et al., 2004. CMORPH: A method that produces global precipitation estimates from passive microwave and infrared data at high spatial and temporal resolution. Journal of Hydrometeorology, 5 (3), 487–503. doi:10.1175/1525-7541(2004)005<0487:CAMTPG>2.0.CO;2
- Karaseva, M., Prakash, O., and Satya Gairola, R.M., 2012. Validation of high-resolution TRMM-3B43 precipitation product using raingauge measurements over Kyrgyzstan. Theoretical and Applied Climatologyl, 108, 147–157. doi:10.1007/s00704-011-0509-6
- Kitchen, M., 1997. Towards improved radar estimates of surface precipitation rate at long range. Quarterly Journal of the Royal Meteorological Society, 123 (537), 145–163. doi:10.1002/(ISSN)1477-870X
- Kumar, D., et al., 2017. Evaluation of TRMM-precipitation with rain-gauge observation using hydrological model J2000. Journal of Hydrologic Engineering, 22 (5), E5015007. doi:10.1061/(ASCE)HE.1943-5584.0001317
- Li, Z., et al., 2015. Multiscale hydrologic applications of the latest satellite precipitation products in the yangtze river basin using a distributed hydrologic model. Journal of Hydrometeorology, 16, 407–426. doi:10.1175/JHM-D-14-0105.1
- Ma, L., et al., 2009. Evaluation of precipitation from the ERA-40, NCEP-1, and NCEP-2 Reanalyses and CMAP-1, CMAP-2, and GPCP-2 with ground-based measurements in China. Journal of Geophysical Research, 114, 1–20.
- Mei, Y., et al., 2014. Error analysis of satellite precipitation products in Mountainous Basins. Journal of Hydrometeorology, 15 (5), 1778–1793. doi:10.1175/JHM-D-13-0194.1
- Mooney, P.A., Mulligan, F.J., and Fealy, R., 2011. Comparison of ERA-40, ERA-Interim and NCEP/NCAR reanalysis data with observed surface air temperatures over Ireland. International Journal of Climatology, 31 (4), 545–557. doi:10.1002/joc.v31.4
- Moore, R.J., 2007. The PDM rainfall–runoff model. Hydrology and Earth System Sciences, 11 (1), 483–499. doi:10.5194/hess-11-483-2007
- Nash, J.E. and Sutcliffe, J.V., 1970. River flow forecasting throligh conceptual models part. Journal of Hydrology, 10, 282–290. doi:10.1016/0022-1694(70)90255-6
- Nelder, J.A. and Mead, R., 1965. A simplex method for function minimization. The Computer Journal, 7 (4), 308–313. doi:10.1093/comjnl/7.4.308
- O’Connor, K.M., 1982. Derivation of discretely coincident forms of continuous linear time-invariant models using the transfer function approach. Journal of Hydrology, 59 (1–2), 1–48. doi:10.1016/0022-1694(82)90002-6
- Pechlivanidis, I.G., Mcintyre, N.R., and Wheater, H.S., 2010. Calibration of the semi-distributed PDM rainfall – runoff model in the Upper Lee catchment, UK. Journal of Hydrology, 386 (1–4), 198–209. doi:10.1016/j.jhydrol.2010.03.022
- Rico-Ramirez, M.A. and Cluckie, I.D., 2007. A high-resolution radar experiment on the island of Jersey. Meteorological Applications, 14, 117–129. doi:10.1002/met.13
- Sharifi, E., Steinacker, R., and Saghafian, B., 2016. Assessment of GPM-IMERG and other precipitation products against gauge data under different topographic and climatic conditions in Iran: preliminary results. Remote Sensing, 8 (2), 135. doi:10.3390/rs8020135
- Shi, Y., Zhang, J., Reid, J.S., Campbell, J.R., Yung, N., Hsu, C., and Theodore, M.M., 2015. An investigation of a potential low bias in the MODIS aerosol products over asia. In: 2015 AGU fall meeting. San Francisco, CA: AGU.
- Shrestha, M.S., et al., 2011. Bias-adjusted satellite-based rainfall estimates for predicting floods: Narayani Basin. Journal of Flood Risk Management, 4 (4), 360–373. doi:10.1111/j.1753-318X.2011.01121.x
- Sorooshian, S. and Gupta, V.K., 1995. Computer models of watershed hydrology. In: Chapter model calibration. Water Resources Publications, 23–68.
- Sun, X., et al., 2000. Flood estimation using radar and raingauge data. Journal of Hydrology, 239 (1–4), 4–18. doi:10.1016/S0022-1694(00)00350-4
- Tang, G., 2016. Statistical and hydrological comparisons between TRMM and GPM level-3 products over a Midlatitude Basin: is Day-1 IMERG a good successor for TMPA 3B42V7? Journal of Hydrometeorology, 17 (1), 121–137.
- Xue, X., et al., 2013. Statistical and hydrological evaluation of TRMM-based Multi-satellite Precipitation Analysis over the Wangchu Basin of Bhutan: are the latest satellite precipitation products 3B42V7 ready for use in ungauged basins? Journal of Hydrology, 499, 91–99. doi:10.1016/j.jhydrol.2013.06.042
- Ye, J.-Y., et al., 2013. Rainfall estimation method based on multiple-doppler radar over the Huaihe river basin. Journal of Hydrologic Engineering, 18 (11), 1471–1476. doi:10.1061/(ASCE)HE.1943-5584.0000378
- Zhao, H., et al., 2015. Evaluating the suitability of TRMM satellite rainfall data for hydrological simulation using a distributed hydrological model in the Weihe River catchment in China. Journal of Geographical Sciences, 25 (2), 177–195. doi:10.1007/s11442-015-1161-3
- Zhao, T., 2006. Comparison of products from ERA-40,NCEP_@ and CRU with station Data for summer precipitation over China. Advances in Atmospheric Sciences, 23 (4), 593–604. doi:10.1007/s00376-006-0593-1
- Zhu, D., Xuan, Y., and Cluckie, I., 2014. Hydrological appraisal of operational weather radar rainfall estimates in the context of different modelling structures. Hydrology and Earth System Sciences, 18 (1), 257–272. doi:10.5194/hess-18-257-2014