
 ?Mathematical formulae have been encoded as MathML and are displayed in this HTML version using MathJax in order to improve their display. Uncheck the box to turn MathJax off. This feature requires Javascript. Click on a formula to zoom.
ABSTRACT
The origin and the chemical and isotopic evolution of dissolved inorganic carbon (DIC) in groundwater of the Okavango Delta in semi-arid Botswana were investigated using DIC and major ion concentrations and stable oxygen, hydrogen and carbon isotopes (δD, δ18O and δ13CDIC). The δD and δ18O indicated that groundwater was recharged by evaporated river water and unevaporated rain. The river water and shallow (<10 m) groundwater are Ca–Na–HCO3 type and the deep (≥10 m) groundwater is Na–K–HCO3 to HCO3–Cl–SO4 to Cl–SO4–HCO3. Compared to river water, the mean DIC concentrations were 2 times higher in shallow groundwater, 7 times higher in deep groundwater and 24 times higher in island groundwater. The δ13CDIC indicate that DIC production in groundwater is from organic matter oxidation and in island groundwater from organic matter oxidation and dissolution of sodium carbonate salts. The ionic and isotopic evolution of the groundwater relative to evaporated river water indicates two independent pools of DIC.
Editor S. Archfield Associate editor G. Chiogna
Introduction
The storage of carbon in groundwater or its release to surface water systems (rivers, lakes, oceans) that interact with atmospheric CO2(g) makes groundwater an important component of the global carbon cycle. Studies in temperate (e.g. Fritz et al. Citation1989, Aravena et al. Citation1992, Aucour et al. Citation1999, Telmer and Veizer Citation1999) and tropical and subtropical (e.g. Cai and Wang., Citation1998, Li et al. Citation2010) regions have advanced our knowledge and understanding of the source(s) of carbon and carbon evolution in groundwater, and the role of hydrological, geomicrobial and water–rock interactions in the cycling of carbon. However, limited studies have been conducted in groundwater of arid environments to understand the processes that affect the cycling of carbon, particularly its evolution (e.g. Dincer et al. Citation1979, Herczeg et al. Citation1991, Cartwright Citation2010) and the role of groundwater in local and perhaps regional carbon cycling. Groundwater in arid environments, unlike groundwater in humid temperate and tropical environments, is less likely to be discharged to the surface, and hence can be considered a reservoir for long-term storage of carbon.
Of special interest in carbon cycling in arid environments are endorheic river basins. Endorheic river basins constitute about 20–23% of the Earth’s surface (Nichols Citation2007, Nyberg et al. Citation2018). In endorheic river basins, carbon transferred from the upper watershed accumulates at the terminus of the basin. If the watershed is large (>103 km2), then a significant amount of carbon can be processed and stored at the terminus of endorheic basins. The endorheic river basin we studied is the Okavango River Basin (ORB) (e.g. Ramberg and Wolski Citation2008) which has a watershed of ~530 000 km2 and spans from subtropical Angola to the Middle Kalahari Desert in northwestern Botswana (e.g. McCarthy and Ellery Citation1998, Ellery et al. Citation2003). Near the terminus of the ORB, the Okavango River forms the Okavango Delta, where the river develops several distributaries on an alluvial fan (e.g. McCarthy et al. Citation2003). The Okavango River flows for almost 1600 km southeastward from its source in Angola before terminating in the Makgadikgadi Pans in the Middle Kalahari Desert in Botswana (Kranz and Vorwerk Citation2007). Although the ORB terminates in the Makgadikgadi Pans, water balance studies of the modern-day Okavango River suggest that less than ~4% of river water that flows into the Okavango Delta is drained into the Makgadikgadi Pans (e.g. McCarthy and Ellery Citation1998, Ramberg et al. Citation2006, Wilk et al. Citation2006, Gondwe and Masamba Citation2016). Moreover, the surface area of the Okavango Delta is less than 10% of the entire ORB. Thus, given a discharge of ~11 × 109 m3 year−1 (McCarthy and Ellery Citation1995, Shaw and Nash Citation1998, McCarthy et al. Citation2000) and 300 000 t of dissolved solutes (McCarthy and Ellery Citation1998) brought into the Okavango Delta, the amount of carbon delivered annually to the Okavango Delta over time frames of 103 year, although unknown, is potentially significant.
In spite of the potential importance of terrestrial carbon cycling in endorheic river systems, the processes that control the cycling of carbon between surface water, groundwater, land surface and the atmosphere are not well understood. DIC concentrations of up to 5 g C/L in groundwater in the Makgadikgadi Pans at the terminus of the ORB (Molwalefhe Citation2004) are almost 50 times higher than DIC concentrations measured in the Okavango River (Akoko et al. Citation2013, Atekwana et al. Citation2016). To quantify the carbon transferred to the ORB’s groundwater, the sources of DIC (river water vs soil zone) need to be identified and their importance assessed from the chemical and isotopic composition and evolution of DIC. Assessing the concentrations of DIC and the stable isotopes of carbon of DIC will allow for direct tracing of carbon flow pathways, and also provide information that can be used to assess carbon dynamics (sources, biogeochemical processes and carbon fluxes) during the cycling of carbon between reservoirs (e.g. Atekwana and Krishnamurthy Citation1998, Aucour et al. Citation1999, Telmer and Veizer Citation1999).
In this study, our goal was to investigate the source(s) and pathways of carbon in the groundwater of the Okavango Delta, which is a potential carbon sink in the ORB. Our approach involved measuring the concentrations of DIC and major ions (Ca2+, Mg2+, Na+, K+, HCO3−, Cl−, SO42−) along with the stable isotopes of DIC (δ13CDIC), hydrogen (δD) and oxygen (δ18O) of groundwater, river water and island groundwater. In addition, we used published chemical and isotopic data for groundwater from the Okavango Delta, groundwater below islands in the Okavango Delta and surface (Okavango River; surface pools) water. Our objectives were to determine (1) the role of river water vs rain in recharge of the groundwater system; (2) the source of DIC in groundwater; and (3) the evolution of DIC in groundwater. By knowing the source(s) of DIC and the processes that transform carbon in groundwater in the Okavango Delta, quantitative evaluation of groundwater carbon cycling can be initiated.
Study site
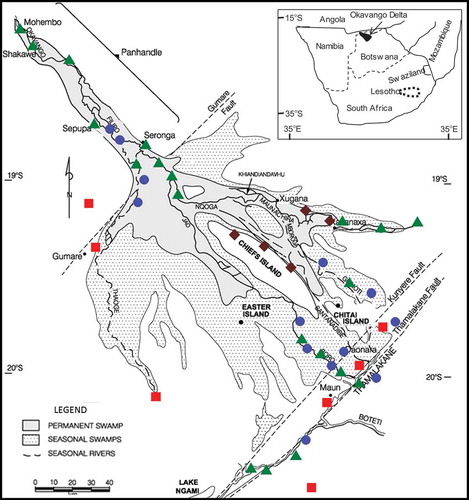
This study was conducted in the Okavango Delta (Delta) located near the terminus of the ORB. The Okavango Delta in semi-arid northwestern Botswana () is characterized by a fault-bound trough panhandle region and a delta region (McCarthy and Metcalfe Citation1990). The delta region is an alluvial fan approx. 30 000 km2 in size, consisting of about 6000 km2 of permanent swamps and another 6000–12 000 km2 of seasonal swamps (McCarthy et al. Citation1991, Bauer et al. Citation2006). Downriver from the panhandle, the delta is formed by distributaries of the Okavango River on an alluvial fan occurring within the fault-bounded trough of the Okavango Rift Zone (e.g. Modisi et al. Citation2000, Kinabo et al. Citation2007, Bufford et al. Citation2012, Leseane et al. Citation2015). A significant feature of the Delta is hundreds of thousands of islands distributed across the Okavango wetlands. Of the estimated 150 000 islands located in the wetlands, about one-third are larger than 2500 m2 (Gumbricht and McCarthy Citation2003, Gumbricht et al. Citation2004a, Citation2004b).
Figure 1. Map of the Okavango Delta, Botswana, showing selected sample locations (●: shallow groundwater, ■: deep groundwater, ♦: island groundwater and ▲: surface water). Map modified from McCarthy et al. (Citation2012).
The surficial geology of the Okavango region consists of Quaternary Kalahari alluvium and recent deposits of lacustrine, fluvial and deltaic sediments that are 300–600 m thick (McCarthy et al. Citation1993, Linn et al. Citation2003, Ringrose et al. Citation2009, Huntsman-Mapila et al. Citation2005, Reiser et al. Citation2014). The sediments are composed of quartz, feldspars and clays cemented by carbonates and silica (McCarthy and Metcalfe Citation1990, McCarthy and Ellery Citation1995, Huntsman-Mapila et al. Citation2005).
The climate of the Okavango Delta region is hot and dry with a rainy season that spans from November to March and a dry season from April to October. Mean temperatures of 35 and 25°C characterize the rainy and dry seasons, respectively (McCarthy and Ellery Citation1998, Mbongwe et al. Citation2003). The mean annual rainfall is 490 mm/year (e.g. McCarthy Citation2006, Wilk et al. Citation2006) and potential evapotranspiration estimated at 1672 mm/year exceeds annual precipitation by a factor of 3 (Wilson and Dincer Citation1976, Dincer et al. Citation1979). The Okavango Delta region receives an annual river inflow of 11 × 109 m3 and rainfall of 5 × 10⁹ m3 (McCarthy and Ellery Citation1995, Shaw and Nash Citation1998, McCarthy et al. Citation2000). Although the Okavango Delta is not the terminal basin in the ORB, water balance studies show that 96% of river water brought into the Okavango Delta is cycled in the Okavango Delta (McCarthy and Ellery Citation1998, Ramberg et al. Citation2006, Wilk et al. Citation2006, Gondwe et al. Citation2017). From a water balance standpoint, river discharge is the dominant source of groundwater recharge in the Okavango Delta region (McCarthy et al. Citation2000, McCarthy Citation2006). The Okavango Delta has several faults (Gumare, Tsau, Lecha, Kunyere, Thamalakane and Mababe) within the Okavango Rift Zone that provide conduits by which river water may recharge groundwater beyond the Okavango Delta (Bufford et al. Citation2012).
Sampling and analyses
We measured the physical, chemical and isotopic parameters of shallow groundwater, deep groundwater and island groundwater (). In the distal part of the Okavango Delta, shallow aquifers are unconfined and range from 5 to 10 m below the ground surface, while deeper aquifers between 10 and 50 m or greater depths are confined by leaky aquitards of clay, silty clays and silty sand (e.g. Linn et al. Citation2003). Shallow groundwater was collected within the floodplains at discrete depths from piezometers installed at 0.25-m intervals at Maun and Toteng (). Deep groundwater was collected from water supply wells operated by the Botswana Department of Water Affairs (DWA) in the distal portion of the Okavango Delta. We sampled island groundwater from depths of up to 6 m from multilevel piezometers installed longitudinally from the edge to the centre of the Okavango Research Institute (ORI) Island (see the Supplementary material, Tables S1 and S2, for sample locations, longitude and latitude, where available).
Groundwater samples from the shallow piezometers were pumped to the surface using a peristaltic pump. Groundwater from the water supply wells was pumped to the surface using high capacity water supply pumps operated by the staff from DWA. Readings for pH, temperature and total dissolved solids (TDS) were taken at each sampling station using a Yellow Spring Instrument (YSI) multi-parameter probe calibrated according to manufacturer’s recommendations. Water samples collected for chemical and isotopic analyses were filtered through 0.45-μM nylon syringe filters. Samples for anions were stored, unacidified, in 30-mL high-density polyethylene (HDPE) bottles, while samples for cations were stored in 60-mL HDPE bottles which were acidified with high-purity HNO3 to a pH of <2. The samples for DIC extraction and δ13CDIC measurements were collected in 15-mL pre-evacuated vacutainer tubes pre-loaded with 1 mL 85% H3PO4 and magnetic stir bars (Atekwana and Krishnamurthy Citation1998). Samples for stable isotopes of hydrogen (δD) and oxygen (δ18O) analyses were collected in 20-mL glass scintillation vials with inverted cone closure. After collection, all samples were protected from sunlight and stored under cool conditions. The samples were kept cool for 1–4 weeks before being transported to the USA, where they were refrigerated at 4°C until analyses were done. We collected rain in static collectors in Maun (20°0ʹ14.42ʺS, 23°24ʹ16.66ʺE) between 2012 and 2015. Aliquots of rainwater were transferred into 20-mL glass scintillation vials with inverted cone closures no later than 15 min after the end of each rain event.
In the field, alkalinity was determined by titration with sulphuric acid (Hach Company Citation1992). Cations (Na+, K+, Mg2+ and Ca2+) and anions (Cl−, NO3− and SO42−) were analysed by ion chromatography using a Dionex ICS-3000. The DIC was recovered as CO2(g) cryogenically from samples under vacuum using the technique of Atekwana and Krishnamurthy (Citation1998). The CO2(g) concentrations were determined manometrically and subsequently sealed in Pyrex tubes. The δ13C of the CO2(g) was measured using a Thermo Finnigan Delta Plus XL isotope ratio mass spectrometer (IRMS). Measurement of the δD and δ18O of the water and rain samples was carried out by the technique of Gehre et al. (Citation2004) using a high-temperature conversion elemental analyser (TC/EA) coupled to a Thermo Finnigan Delta Plus XL IRMS. The isotope ratios are reported in the delta notation (δ) in per mil (‰) relative to international standards:
where R is the ratio of D/H, 13C/12C or 18O/16O in the sample and standard. The δ13C is reported relative to Vienna Pee Dee Belemnite (VPDB) standard, while the δD and δ18O are reported relative to Vienna Standard Mean Ocean Water (VSMOW). In-house standards routinely measured have precision of better than 0.1‰ for δ13C and δ18O and 2.0‰ for δD.
We used additional data for shallow groundwater, deep groundwater, island groundwater and surface water in the Okavango Delta region from the published literature (Mazor et al. Citation1973, Dincer et al. Citation1979, Citation1980, McCarthy et al. Citation1991, Citation1993, Huntsman-Mapila et al. Citation2006, Bauer-Gottwein et al. Citation2007, Huntsman-Mapila et al. Citation2011, Akoko et al. Citation2013, Mladenov et al. Citation2013); these publications should be consulted for details on sampling and analyses. Groundwater samples from the published studies were classified as deep and shallow based on sampling depths. We assumed that all groundwater collected beyond the wetland area of the Delta were deep because of the expected groundwater depths (e.g. McCarthy et al. Citation1993). Wells in the Delta without depth information were classified based on our perceived purpose for the well. For example, hand-dug wells were considered shallow and water supply wells were considered deep (e.g. Linn et al. Citation2003).
Results and discussion
The results of 331 individual water sample analyses (41 shallow groundwater, 63 deep groundwater, 116 island groundwater and 111 surface water) were compiled in our database (see Tables S1 and S2); however, not all the samples were measured for all the physical, chemical and isotopic parameters. We used data from published studies that were collected between 1972 and 2012. Some surface water stations and groundwater locations were sampled multiple times. Samples from surface water (Okavango River and distributaries, lagoons, lakes and pans) and groundwater were collected across the Okavango Delta () and represent a variable spatial scale. The river and groundwater samples also represent a variable temporal (seasonal) scale as they represent both the rainy and dry seasons. The statistical summary of selected parameters (mean, minimum, maximum, standard deviation and numbers of samples) of surface water, shallow groundwater, island groundwater and deep groundwater of the Okavango Delta are listed in .
Table 1. Statistical summary of data for selected parameters for shallow groundwater, deep groundwater, island groundwater and surface water from the Okavango Delta, Botswana. Min.: minimum; Max.: maximum; SD: standard deviation. DIC: dissolved inorganic carbon; TDS: total dissolved solids.
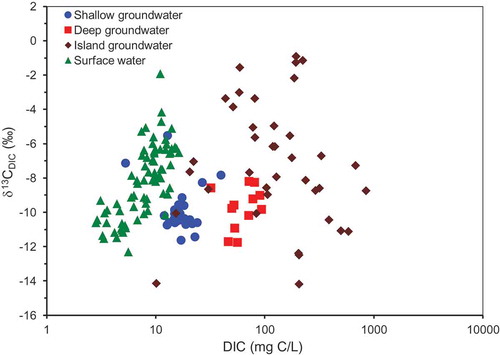
As shown in , the DIC concentrations and δ13CDIC averaged, respectively, 23.2 ± 28.5 mg C/L and −10.1 ± 01.0‰ for shallow groundwater, 67.6 ± 18.8 mg C/L and −9.3 ± 1.8‰ for deep groundwater, 192.1 ± 214.7 mg C/L and −7.2 ± 3.6‰ for island groundwater and 9.1 ± 4.5 mg C/L and −7.5 ± 2.1‰ for surface water. The DIC concentrations and the δ13CDIC for the different groups of samples are displayed in . The Okavango River samples show a concomitant increase in DIC with δ13CDIC (surface water in ). Values of DIC concentrations and δ13CDIC in the river water increased continuously from the panhandle region to the distal end of the Okavango Delta (Akoko et al. Citation2013, Atekwana et al. Citation2016). Overall, the DIC concentrations increased from surface water to shallow groundwater to deep groundwater, while the groundwater samples (shallow and deep) had correspondingly lower δ13CDIC compared to the surface (river) samples (, ). Also, island groundwater samples had higher DIC concentrations and showed both higher and lower δ13CDIC values compared to river water, shallow groundwater and deep groundwater (, ).
Figure 2. Plot of dissolved inorganic carbon (DIC) vs the stable carbon isotope composition of DIC (δ13CDIC) for shallow groundwater, deep groundwater, island groundwater and surface water.
Origin of DIC in groundwater
Conceptual model
We developed a conceptual model () as a way to explore the origin and evolution of DIC before groundwater recharge. The main pathways of introducing DIC into the groundwater (shallow and deep) are through river recharge, island groundwater recharge or rain recharge. The DIC concentrations and δ13CDIC in river water are affected by evapotranspiration, water column respiration, photo-oxidation or photosynthesis, CO2(g) evasion, exchange of carbon in DIC with atmospheric CO2(g) and carbonate precipitation or dissolution on or from the floodplains. The DIC and the δ13CDIC in island groundwater sourced from river water are modified by evapotranspiration, carbonate precipitation and carbonate dissolution (e.g. McCarthy and Metcalfe Citation1990, McCarthy et al. Citation1991, Citation1993) and microbial organic matter respiration (Mladenov et al. Citation2013). The DIC and the δ13CDIC in surface pools in the centre of the islands island are modified by evapoconcentration and exchange of carbon between DIC and atmospheric CO2(g). Beyond the wetland area of the Delta, the DIC concentrations and the δ13CDIC in rainwater in equilibrium with atmospheric CO2(g) are modified in the soil zone during recharge by the dissolution of soil CO2(g) and carbonate and silicate weathering (e.g. Clark and Fritz Citation1997). If the infiltrating water is oversaturated with respect to the mineral calcite, DIC can be removed by carbonate precipitation, causing further changes in the δ13CDIC. Note that, although rainwater DIC modification in the unsaturated zone before recharge of groundwater is shown as occurring out of the Delta in the conceptual model, rainwater DIC concentrations and the δ13CDIC will be modified in the unsaturated zone within the Delta and on the islands.
Figure 3. Conceptual model showing the pathways and processes that affect dissolved inorganic carbon (DIC) in the river water, island groundwater and the unsaturated zone prior to recharge of groundwater in the Okavango Delta, Botswana.
The conceptual model also shows that surface evaporation will enrich river water and island groundwater δD and δ18O composition. The extent of enrichment of falling rain depends on re-evaporation of rain drops and evaporation of rainwater in standing surface pools and in the shallow subsurface. The extent of evaporative enrichment of river water is controlled by the extent of exposure to evaporation across space and time (Akoko et al. Citation2013, Atekwana et al. Citation2016). For island groundwater, the δD and the δ18O enrichment will depend on that of river recharge and the extent of shallow subsurface evaporation on the island or evaporation from the surface pools in the centre of the islands.
From our conceptual model, we expect that the different sources of groundwater recharge will be chemically and isotopically distinguishable because of their unique biogeochemical and isotopic evolutionary history. Thus, we can use the DIC concentrations and the δ13CDIC, the δD and the δ18O as tracers to evaluate the source of groundwater recharge, and by implication the source(s) of DIC.
Composition of δD and δ18O in groundwater recharge
In a plot of the δ18O vs δD (), surface water samples lie on the trend of the Okavango Delta Evaporation Line (ODEL) (Atekwana et al. Citation2016) which is similar to the Okavango Swamp Evaporation Line of Dincer et al. (Citation1979). The isotopic composition of shallow groundwater below the floodplains of distributaries in the distal portion of the Okavango Delta (Maun and Toteng) was more enriched (−4.9 to 4.5‰ for δ18O and −27 to 7‰ for δD). The δ18O and δD values of shallow groundwater fall within the range of isotopic values of evaporated surface water (−7.2 to 17.4‰ for δ18O and −47 to 73‰ for δD) (, ), consistent with evaporated river water recharge of shallow groundwater. The δ18O and δD of island groundwater samples are enriched (−0.8 to 4.5‰ for δ18O and −22 to 14‰ for δD), lie along the ODEL and are within the δ18O and δD range of evaporated surface water (, ), consistent with recharge by evaporated river water and/or evaporation in the shallow subsurface or in pools in the centre of the islands (McCarthy and Ellery Citation1995, Huntsman-Mapila et al. Citation2006, Bauer-Gottwein et al. Citation2007, McCarthy et al. Citation2012, Mladenov et al. Citation2013). River water and island groundwater, which are potential sources of recharge of groundwater, are indistinguishable as their δ18O and δD compositions overlap on the ODEL.
Figure 4. Plot of the stable oxygen (δ18O) vs stable hydrogen (δD) isotopic composition for shallow groundwater, deep groundwater, island groundwater and surface water. Also shown is the Local Meteoric Water Line (LMWL) constructed from Maun rain, the Global Meteoric Water Line (GMWL; Craig and Gordon, 1965) and the Okavango Delta evaporation line (ODEL; Atekwana et al. Citation2016).
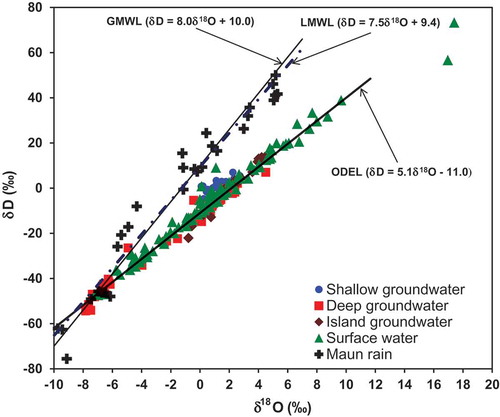
There are some deep groundwater samples, which were collected away from the floodplains and distributaries of the Okavango River, that have δ18O and δD that lie near the intersection of the ODEL, the Global Meteoric Water Line (GMWL; Craig Citation1961) and the Local Meteoric Water Line (LMWL) for Maun rain. The range of the δ18O and δD of these deep groundwater samples is similar to that for groundwater from Orapa and Serowe (−6.8 to −5.8‰ for δ18O and −48 to −37‰ for δD), approximately 500 km southeast of the Okavango Delta, where recharge is exclusively by rain (Mazor et al. Citation1977, Dincer et al. Citation1979, Stradler et al. Citation2010). It is notable that there are not many groundwater samples that lie along the major portion of the LMWL (δD of −35 to 50‰; ), consistent with groundwater recharge in the Kalahari Desert by rain dominated by isotopically light precipitation (Vogel and Van Urk Citation1975). The δ18O of −4.0 to 5.0‰ and δD of −35 to −5‰ for some deep groundwater samples that lie along the ODEL and away from the GMWL and the LMWL () is evidence of variable mixing of rain-recharged and evaporated river-recharged groundwater or groundwater recharge by variably evaporated river water.
The δ18O and δD clearly show that groundwater can be recharged from of river and island groundwater because of the overlap in their δ18O and δD values with those of shallow groundwater, river water and island groundwater. On the other hand, some deep groundwater with δ18O and δD clustering on the LMWL is recharged from unevaporated rain.
Determining the chemical evolution of DIC
Major ionic evolution
The chemical evolution of DIC in groundwater is intimately tied to the chemical evolution of the major ions. The proportions of anions and cations in shallow groundwater, deep groundwater, island groundwater and surface water samples are shown in a Piper diagram (). The water types for surface water and deep groundwater match those of Huntsman-Mapila et al. (Citation2006), and island groundwater water types match those of Huntsman-Mapila et al. (Citation2011). Shallow groundwater recharged by river water shows similar cation–anion (Ca–Na–HCO3 type) evolution as surface water because they cluster together (). Even though the δ18O and δD of some deep groundwater indicate recharge from evaporated river water (), the cation–anion evolution of all deep groundwater is different from that of surface water and shallow groundwater (). Compared to river water and shallow groundwater, the dominant cation facie of Na–K for deep groundwater indicates a more advanced chemical evolution in which Ca and Mg have been removed during ionic evolution in the aquifer. The anion evolution of deep groundwater, which shows a continuum from HCO3 to HCO3–Cl–SO4 to Cl–SO4–HCO3, is also different from that of surface water or shallow groundwater.
Figure 5. Piper plot showing the proportions of major cations and anions in shallow groundwater, deep groundwater, island groundwater and surface water.
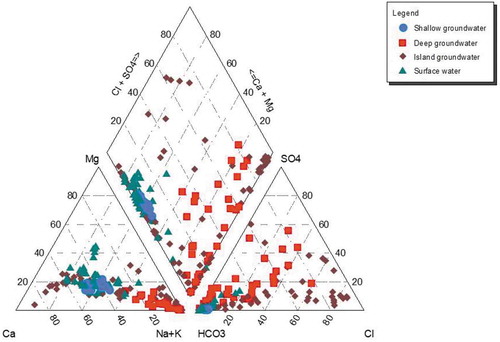
The ionic evolutionary behaviour of river recharge that is in part driven by evapoconcentration is best exhibited by island groundwater (e.g. McCarthy and Ellery Citation1995, Huntsman-Mapila et al. Citation2006, Bauer-Gottwein et al. 2006, Mladenov et al. Citation2013). The island groundwater shows: (1) a Ca–Mg facies with anion facies that evolve from HCO3 to HCO3–Cl–SO4 to Cl–SO4–HCO3 to Cl–SO4; (2) an evolving Ca–Mg to Na–Ca to Ca–Na to Na–K cation facies with predominantly HCO3 anion facies; and (3) a Na–K cation facies with anion facies that vary from HCO3 to HCO3–Cl–SO4 to Cl–SO4–HCO3 to Cl–SO4 (). We glean from the ionic evolution of island groundwater that (i) samples of predominantly Ca–Mg cation facies with anion facies evolving from HCO3 to HCO3–Cl–SO4 to Cl–SO4–HCO3 are unique to only island groundwater; (ii) that island groundwater samples that show a cation evolution though Ca–Mg to Na–Ca to Ca–Na to Na–K while maintaining a HCO3 anion facies may indicate that surface water and shallow groundwater can evolve along this pathway; and (iii) that the predominantly Na–K cation facies that evolves from HCO3 to HCO3–Cl–SO4 to Cl–SO4–HCO3 to Cl–SO4 shows that deep groundwater can also evolve along this pathway. What is intriguing about the island groundwater evolution is that sampling depths were shallow (<6 m deep) and that the chemical evolution is driven in part by evapoconcentration, biogeochemical reactions and rock–water interactions (e.g. McCarthy et al. Citation1991, McCarthy and Ellery Citation1995, Ramberg and Wolski Citation2008, Huntsman-Mapila et al. Citation2011, Mladenov et al. Citation2013). Yet the chemical evolution of island groundwater displays aspects of river water and shallow groundwater evolution, as well as showing that there is a pathway to evolve from river water and shallow groundwater to deep groundwater cation and anion facies ().
Effects of evapoconcentration on ionic evolution
The effects of evaporative concentration and water–rock interaction on the geochemical evolution of groundwater are shown in a plot of TDS vs δ18O () and TDS vs the sum of cations (Na+ + K+ + Ca2+ + Mg2+) (). shows that increases in δ18O correspond to increases in TDS from 0 to 100 mg/L in more than 95% of surface water samples. The increases in TDS for the island groundwater and deep groundwater samples are not accompanied by corresponding increases in the δ18O as observed in surface water. Atekwana et al. (Citation2016) have shown that there is a positive lognormal relationship for TDS vs δD for evaporated Okavango River water under laboratory conditions, although some river water samples showed increases in the TDS concentrations without a corresponding increase in the δD, an indication of the non-evaporative effects on river water TDS increases. Thus, the increasing TDS concentrations with little to no effect on the δ18O of island groundwater and deep groundwater may be from increases in solute concentration by transpiration and/or addition of solutes from water–rock interactions.
Figure 6. Cross plots of (a) TDS vs stable isotopic composition of oxygen (δ18O), (b) TDS vs total cations (Ca2+ + Mg2+ + Na+ + K+), (c) TDS vs alkalinity and (d) TDS vs DIC for shallow groundwater, deep groundwater, island groundwater and surface water. TDS: total dissolved solids; DIC: dissolved inorganic carbon.
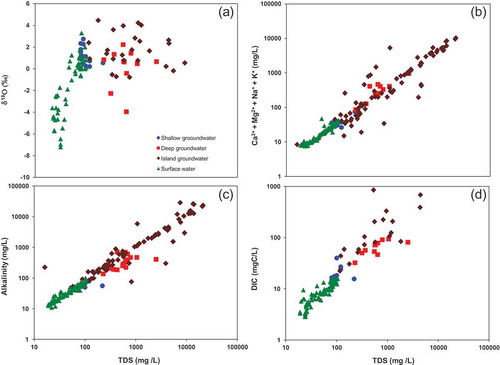
The positive increase in the TDS concentrations with an increase in the sum of the major cations makes the effect of evapoconcentration indistinguishable from the effect of water–rock interaction ( vs ). The lack of a distinction between the effect of evapoconcentration relative to water–rock interaction from the solute concentrations in surface water and groundwater is also observed in plots of the TDS vs alkalinity () and TDS vs DIC ().
Carbonate evolution
The relationships of TDS vs alkalinity () and TDS vs DIC () indicate that the processes affecting the aqueous ionic evolution have a similar effect on the carbonate evolution. The chemical evolution of groundwater in the Okavango Delta is strongly controlled by reactions involving carbonates in the Delta sediments (e.g. Huntsman-Mapila et al. Citation2011) and efflorescent precipitates on the islands and floodplains (e.g. McCarthy et al. Citation1991, Citation2012). A major control of the carbonate evolution in the aqueous phase is the pH of the solution, which is used to infer the distribution of carbonate species in the solution or, in the case of changing solution pH, the redistribution of the carbonate species during equilibrium carbonate evolution (e.g. Stumm and Morgan Citation1996). Surface water samples show a broad range of pH (4.9–10.0; ) and alkalinity concentrations (9–6319 mg/L; ) which show concomitant increases (). The concomitant increases are similarly reflected in the DIC–pH relationship (). The increases in the alkalinity concentrations with increase in pH have been observed along the longitudinal profile of the Okavango River (Hutton and Dincer Citation1976, Summerfield Citation1983, Sawula and Martins Citation1991, Akoko et al. Citation2013, Atekwana et al. Citation2016, Gondwe and Masamba Citation2016). The increasing pH and alkalinity concentrations during evapoconcentration to carbonate saturation have been observed in ponded surface water on the islands and in island groundwater (McCarthy et al. Citation1991, Citation2012).
Figure 7. Cross plots of (a) alkalinity vs pH, (b) DIC vs pH, (c) alkalinity vs Ca2+, (d) DIC vs Ca2+, (e) alkalinity vs Mg2+, (f) DIC vs Mg2+, (g) alkalinity vs Na+ and (h) DIC vs Na+, for shallow groundwater, deep groundwater, island groundwater and surface water.
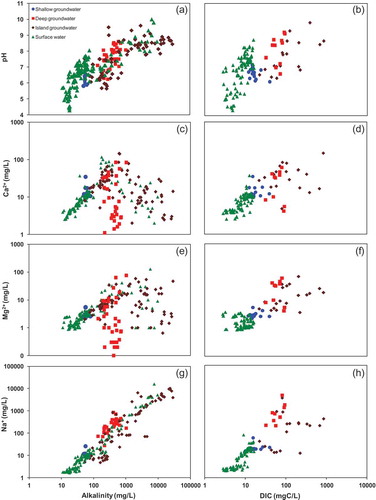
Deep groundwater shows a relatively wide range in pH and a rather narrow range in alkalinity () and DIC concentrations (). The greater change in pH with little relative change in alkalinity or DIC concentration occurs mainly in “closed system” carbonate evolution, as the total carbon concentration is conserved (e.g. Langmuir Citation1971, Stumm and Morgan 1996).
The plot of alkalinity vs Ca2+ concentrations () shows that, for surface water, increases in the alkalinity concentrations correspond to increases in the Ca2+ concentrations to about 200 mg/L, whereby further increases in alkalinity concentrations do not show any corresponding relationship with Ca2+ concentrations. The behaviour of alkalinity vs Ca2+ for island groundwater () is similar to that observed in evapoconcentrated surface water. The same behaviour for alkalinity vs Ca2+ concentrations is exhibited by alkalinity vs Mg2+ concentrations () for both surface water and island groundwater. We suggest that the behaviour where Ca2+ and Mg2+ concentrations increase with increases in alkalinity concentrations to about 200 mg/L is governed by evapoconcentration. In contrast, we suggest that the behaviour above alkalinity concentrations of 200 mg/L where further increases in alkalinity concentrations show no corresponding increases in the Ca2+ and Mg 2+ concentrations is controlled by the dissolution of sodium carbonate minerals trona (Na3(CO3)(HCO3)·2H2O) or thermonatrite (Na2CO3·H2O) (e.g. McCarthy et al. Citation1991, Citation1986, McCarthy and Ellery Citation1995). The dissolution of the efflorescent crusts of sodium carbonate minerals explains the concomitant increases in Na+ and alkalinity () without corresponding increases in Ca2+ or Mg2+ ()–(f)) in some surface water and island groundwater samples. The region of alkalinity concentrations above 200 mg/L where the positive relationship between Ca2+ or Mg2+ vs. alkalinity breaks down ()–(f)) is characterized by a positive relationship between Na+ concentrations and alkalinity concentrations for surface water and island groundwater () and (h)). Alternatively, the positive relationship between Na+ and alkalinity concentrations for alkalinity concentrations greater than 200 mg/L for surface water and island groundwater can be explained by the weathering of feldspars in the Okavango Delta sediments (Mazor et al. Citation1980, McCarthy and Metcalfe Citation1990, Huntsman-Mapila et al. Citation2005).
Although it is possible to explain the positive relationship between Na+ concentrations and HCO3− concentrations for surface water and island groundwater from feldspar weathering, it is not clear why this process will not operate in deep groundwater. This leads us to favour dissolution of sodium carbonate minerals such as trona and thermonatrite for increases in Na+ and alkalinity without corresponding increases in Ca2+ and Mg2+ concentrations ( and (h)).
For deep groundwater, there is a much greater range in Ca2+ and Mg2+ concentrations relative to alkalinity and DIC concentrations ()–(f)). Conservation of total carbonate during close system carbonate evolution results in increases in Ca2+ and Mg2+ concentrations from mineral weathering with no increase in the alkalinity or DIC concentrations (Langmuir Citation1971, Clark and Fritz Citation1997). The differences in carbonate evolution indicate an open system carbonate evolution for surface water, shallow groundwater and some island groundwater, in contrast to a closed system carbonate evolution for deep groundwater.
A much greater number of samples from the Okavango Delta had concentration values for alkalinity (n = 232) compared to DIC (n = 97). Because many fewer samples have been measured for DIC concentrations, the range in DIC concentrations does not cover the equivalent range measured for alkalinity. Nevertheless, the behaviour exhibited by alkalinity and Ca2+ at lower alkalinity concentrations (<200 mg/L) is similar to that for DIC vs Ca2+ at DIC concentrations below 50 mg C/L for island groundwater (), while the behaviour exhibited by alkalinity and Ca2+ at higher alkalinity concentrations (>200 mg/L) is similar to that for DIC vs Ca2+ at DIC concentrations greater than 50 mg C/L for island groundwater (). The behaviours of alkalinity relative to Na+ () and DIC relative to Na+ () are similar and show mostly positive relationships with each other. The island groundwater samples show exceptions where increases in alkalinity and DIC are accompanied by no increases in the Na+ concentrations. We suggest that this may be caused by degradation of organic matter (OM) which produces DIC but no Na+ (e.g. Equation (3)), as has been demonstrated in island groundwater (Mladenov et al. Citation2013):
Carbon cycling
To evaluate carbon cycling in groundwater of the Okavango Delta, we turn our attention to shallow groundwater collected below the floodplain in the distal portion of the Delta, which we know is recharged by modern-day river water. We observe that shallow groundwater immediately assumes DIC concentrations and δ13CDIC characteristics that are very different from the recharging surface water, because, by the time river water recharge infiltrates to 50 cm below the ground surface, the DIC concentrations increase and the δ13CDIC becomes more negative (, Table S1). The shallow groundwater samples have mean DIC concentrations that are about two times greater than those of river water (). Because the δ13CDIC for shallow groundwater decrease relative to those of river water, which is the recharge source for this shallow groundwater, there must be an addition of isotopically lighter carbon to the DIC from the aquifer. The deep groundwater samples have mean DIC concentrations that are about seven times greater than those of most river water and δ13CDIC values that are more negative than river water samples (), again consistent with the addition of isotopically lighter carbon from the aquifer to DIC. Although the major ionic evolution of shallow groundwater and deep groundwater is characteristically different (, ) and (e)), it is not clear how the DIC evolutionary pathways for shallow and deep ground water is different, as they both have a similar range in δ13CDIC, although their mean DIC concentrations are markedly different (, ). Since the ionic evolution of some samples of island groundwater is similar to shallow groundwater and for others similar to deep groundwater, the DIC evolution of island groundwater may provide insights into the DIC evolution of shallow groundwater and deep groundwater.
The island groundwater samples have mean DIC concentrations that are up to 20 times greater than those of surface water (), and some of the δ13CDIC compositions are heavier and others are lighter than those of river water (). Recharge by river water or rain in the island centres that equilibrate carbon in the DIC with atmospheric CO2(g) under evaporative control can explain the increase in the DIC concentrations and increases in the δ13CDIC for some of the island groundwater samples. We measured a sample of carbonate precipitate from the edge of the ORI Island and three samples in the middle of the island, which gave δ13C values of −3.8, −3.5, −3.0 and −5.1‰, respectively. Therefore, the dissolution of carbonates in the sediments of the islands (e.g. McCarthy et al. Citation1991, McCarthy and Ellery Citation1995) can also explain the increase in the DIC concentrations and increases in the δ13CDIC for some of the island groundwater samples. On the other hand, the increases in the DIC concentrations and decreases in the δ13CDIC in other island groundwater could be a result of microbial respiration of OM (Mladenov et al. Citation2013), which increases the DIC concentrations and also explains the depletion in the δ13C of DIC.
We can invoke microbial respiration of OM in aquifers as the source of increased DIC concentrations and the decrease in the δ13CDIC in shallow groundwater and in deep groundwater. In general, the δ13CDIC composition of DIC of groundwater depends on whether C3, CAM or C4 plant biomass is respired in the soil zone or the aquifer (e.g. Quade et al. Citation1989, Talbot Citation1990). The OM in the sediments in the Okavango Delta and the Kalahari Desert can originate from C3 or C4 plants that have δ13C of approx. −26.9‰ and −12.4‰, respectively (Ellery et al. Citation1992, Mladenov et al. Citation2005, Citation2007, Wang et al. Citation2007, Citation2010). The isotopic composition of OM in sediment in and around the Okavango Delta ranges from −18 to −26‰ (Bird et al. Citation2004), indicating the predominance of C3 OM in the Kalahari sediments. The δ13C of carbonates measured in the sediments range from −1.5 to −6‰ (e.g. Ringrose et al. Citation2009). Weathering of carbonates with a δ13C of −1.5 to −6‰ by CO2(g) produced from degradation of OM of −18 to −26‰ in a closed carbonate evolution at a temperature of about 25°C produces DIC with δ13CDIC of −7 to −15‰.
Studies have shown that the δ13CDIC composition of the groundwater from the Kalahari region ranges between −13.3 and −4.8‰ (Mazor et al. Citation1973, Dincer et al. Citation1979, Mazor et al. Citation1980). Groundwater directly recharged by a distributary of the Okavango River in the Shashe River valley had a δ13CDIC of between −4.8 and −7.8‰ (Bauer et al. Citation2006), suggesting that DIC in river water recharge can be traced to groundwater. Data from Mazor et al. (Citation1973) shows that, despite the variable δ13CDIC for Kalahari groundwater, deep groundwater samples in the Okavango Delta region had δ13C values between −10 and −13‰. Additionally, the deep groundwater samples from the Mazor et al. (Citation1973) study were characterized by low tritium of <1.2 TU and 14C of <60% PMC. The markedly different tritium and 14C content leads us to the hypothesis that there may be two independent groundwater carbon pools in the Okavango Delta, implying that deep groundwater has an old source of carbon not derived from modern-day Okavango River or rain recharge. This hypothesis could be tested by conducting spatial and depth-related carbon studies in groundwater in the Okavango Delta.
Conclusions
The ionic concentrations, the δD and the δ18O of water and the δ13CDIC in shallow groundwater, deep groundwater, island groundwater and surface water were used to assess the origin and evolution of carbon in groundwater of the Okavango Delta near the terminus of the Okavango River Basin in semi-arid Botswana. Our approach was to follow the carbon from recharge waters to assess its modification within the aquifer. The sources of groundwater recharge and the supply of DIC include river water, island groundwater and rain. The δ18O and δD and the major ionic evolution indicate that island groundwater, shallow groundwater and surface water can chemically evolve to an ionic composition similar to deep groundwater. The DIC concentrations in groundwater are 2–7 times higher than river water which can potentially recharge groundwater, and the δ13CDIC, which is lower in both shallow (<10 m) and deep (>10 m) groundwater, indicates the contribution of isotopically light carbon from OM respiration in aquifers.
Evaluation of the ionic evolution indicates that present-day shallow groundwater recharged by river water may not be the source of deep groundwater recharge. We use this fact to suggest different carbon evolution pathways in shallow groundwater and deep groundwater. Additionally, although island groundwater can potentially recharge deep groundwater, the very high DIC concentrations and the positive isotopic composition (δ13CDIC > −7.0‰) is not observed in the deep groundwater of the Okavango Delta.
We suggest that the Okavango Delta has a modern-day shallow groundwater reservoir recharged by river water and island groundwater with recent carbon, and a deep groundwater reservoir with old carbon (<60% PMC). We speculate that the old carbon in the deep groundwater is sourced from ancient pluvial periods. The carbon in the deep groundwater reservoir does not interact with the carbon in the shallow groundwater system and evolved under closed system carbonate evolutionary conditions; and that groundwater acts mainly as a carbon store.
Supplemental Material
Download MS Excel (39.5 KB)Supplemental Material
Download MS Excel (31.1 KB)Acknowledgements
We thank the government of Botswana (Ministry of Education) for providing us with research permits. We thank the staff of the Botswana Department of Water Affairs for providing access to water supply wells, and the Okavango Research Institute (ORI) for providing access and logistics during sampling at the ORI Island. We thank the IRES students for field assistance, and P. Abongwa and C. Geyer for laboratory assistance. We thank O. Dikole for collecting the rain samples in Maun used in this study. Comments from an anonymous reviewer and the Associate Editor helped improve this manuscript.
Disclosure statement
No potential conflict of interest was reported by the authors.
Supplementary material
Supplementary data for this article can be accessed here.
Additional information
Funding
Related Research Data
References
- Akoko, E., et al., 2013. River-wetland interaction and carbon cycling in a semi-arid riverine system: the Okavango Delta, Botswana. Biogeochemistry, 114, 359–380. doi:10.1007/s10533-012-9817-x
- Aravena, R., et al., 1992. Evaluating dissolved inorganic carbon cycling in a forested lake watershed using carbon isotopes. Radiocarbon, 343, 636–645. doi:10.1017/S003382220006392X
- Atekwana, E.A., et al., 2016. Effect of evapotranspiration on dissolved inorganic carbon and stable carbon isotopic evolution in rivers in semi-arid climates: the Okavango Delta in North West Botswana. Journal of Hydrology: Regional Studies, 7, 1–13.
- Atekwana, E.A. and Krishnamurthy, R.V., 1998. Seasonal variations of dissolved inorganic carbon and δ13C of surface waters: application of a modified gas evolution technique. Journal of Hydrology, 205, 265–278. doi:10.1016/S0022-1694(98)00080-8
- Aucour, A.M., et al., 1999. Use of 13C to trace origin and cycling of inorganic carbon in the Rhône river system. Chemical Geology, 159, 87–105. doi:10.1016/S0009-2541(99)00035-2
- Bauer, P., et al., 2006. Geoelectrical imaging of groundwater salinization in the Okavango Delta, Botswana. Journal of Applied Geophysics, 60 (2), 126–141. doi:10.1016/j.jappgeo.2006.01.003
- Bauer-Gottwein, P., et al., 2007. Okavango Delta islands: interactions between density driven flow and geochemical reactions under evapo-concentration. Journal of Hydrology, 335, 389–405. doi:10.1016/j.jhydrol.2006.12.010
- Bird, M.I., Veenendaal, E.M., and Lloyd, J.J., 2004. Soil carbon inventories and δ13C along a moisture gradient in Botswana. Global Change Biology, 10, 342–349. doi:10.1046/j.1365-2486.2003.00695.x
- Bufford, K.M., et al., 2012. Geometry and faults tectonic activity of the Okavango Rift Zone, Botswana: evidence from magnetotelluric and electrical resistivity tomography imaging. Journal of African Earth Sciences, 65, 61–71. doi:10.1016/j.jafrearsci.2012.01.004
- Cai, W.J. and Wang, Y., 1998. The chemistry, fluxes, and sources of carbon dioxide in the estuarine waters of the Satilla and Altamaha Rivers, Georgia. Limnology and Oceanography, 43, 657–668. doi:10.4319/lo.1998.43.4.0657
- Cartwright, I., 2010. The origins and behaviour of carbon in a major semi-arid river, the Murray River, Australia, as constrained by carbon isotopes and hydrochemistry. Applied Geochemistry, 25, 1734–1745. doi:10.1016/j.apgeochem.2010.08.020
- Clark, I.D. and Fritz, P., 1997. Environmental isotopes in hydrogeology. Boca Raton, FL: CRC Press, 352.
- Company, H., 1992. Water analysis handbook. Loveland, CO: Hach Company.
- Craig, H., 1961. Isotopic variations in meteoric waters. Science, 133 (3465), 1702–1703. doi:10.1126/science.133.3465.1702
- De Vries, J.J., Selaolo, E.T., and Beekman, H.E., 2000. Groundwater recharge in the Kalahari, with reference to paleo-hydrologic conditions. Journal of Hydrology, 238 (1), 110–123. doi:10.1016/S0022-1694(00)00325-5
- Dincer, T., Hutton, L.G., and Kupee, B.B.J., 1979. Study, using stable isotopes, of flow distribution, surface-groundwater relations and evapotranspiration in the Okavango Swamp, Botswana. In: Proceedings Series-International Atomic Energy Agency (IAEA). Neuherberg: IAEA.
- Ellery, K., Ellery, W.N., and Verhagen, B., 1992. The distribution of C3 plant and C4 plants in a successional sequence in the Okavango Delta. South African Journal of Botany, 58, 400–402. doi:10.1016/S0254-6299(16)30829-8
- Ellery, W.N., McCarthy, T.S., and Smith, N.D., 2003. Vegetation, hydrology, and sedimentation patterns on the major distributary system of the Okavango Fan, Botswana. Wetlands, 23, 357–375. doi:10.1672/11-20
- Fritz, P., et al., 1989. The isotope geochemistry of carbon in groundwater at Stripa. Geochimica et Cosmochimica Acta, 53, 1765–1775. doi:10.1016/0016-7037(89)90297-4
- Gehre, M., et al., 2004. Continuous flow 2H/1H and 18O/16O analysis of water samples with dual inlet precision. Rapid Communications in Mass Spectrometry, 18, 2650–2660. doi:10.1002/rcm.1672
- Gieske, A., 1997. Modelling outflow from the Jao/Boro river system in the Okavango Delta, Botswana. Journal of Hydrology, 193, 214–239. doi:10.1016/S0022-1694(96)03147-2
- Gondwe, M.J., Masamba, W., and Murray-Hudson, M., 2017. Water balance and variations of nutrients and major solutes along a river transect through the Okavango Delta, Botswana. Botswana Notes and Records, 49, 26–43.
- Gondwe, M.J. and Masamba, W.R.L., 2016. Variation of physico-chemical parameters along a river transect through the Okavango Delta, Botswana. African Journal of Aquatic Science, 41 (2), 205–215. doi:10.2989/16085914.2016.1169394
- Gumbricht, T., et al., 2004b. Forecasting the spatial extent of the annual flood in the Okavango Delta, Botswana. Journal of Hydrology, 290, 178–191. doi:10.1016/j.jhydrol.2003.11.010
- Gumbricht, T., McCarthy, J., and McCarthy, T.S., 2004a. Channels, wetlands and islands in the Okavango Delta, Botswana, and their relation to hydrological and sedimentological processes. Earth Surface Processes and Landforms, 29 (1), 15–29. doi:10.1002/(ISSN)1096-9837
- Gumbricht, T. and McCarthy, T.S., 2003. Spatial patterns of islands and salt crusts in the Okavango Delta, Botswana. South African Geographical Journal, 85, 164–169. doi:10.1080/03736245.2003.9713797
- Herczeg, A.L., et al., 1991. Geochemistry of ground waters from the Great Artesian Basin, Australia. Journal of Hydrology, 126, 225–245. doi:10.1016/0022-1694(91)90158-E
- Huntsman-Mapila, P., et al., 2005. Cryptic indicators of provenance in the geochemistry of the Okavango Delta sediments, NW Botswana. Sedimentary Geology, 174, 123–148. doi:10.1016/j.sedgeo.2004.11.001
- Huntsman-Mapila, P., et al., 2006. Characterization of arsenic occurrence in the water and sediments of the Okavango Delta, NW Botswana. Applied Geochemistry, 21, 1376–1391. doi:10.1016/j.apgeochem.2006.05.003
- Huntsman-Mapila, P., et al., 2011. Arsenic distribution and geochemistry in island groundwater of the Okavango Delta in Botswana. Sustainable Groundwater Resources, 55, 67.
- Hutton, L.G. and Dincer, T., 1976. Chemistry and stable isotope composition of Okavango Delta waters. UNDP/FAO BOT/71/506. Technical note, 23.
- Kinabo, B.D., et al., 2007. Early structural development of the Okavango rift zone, NW Botswana. Journal of African Earth Sciences, 48, 125–136. doi:10.1016/j.jafrearsci.2007.02.005
- Kranz, N. and Vorwerk, A., 2007, March. Public participation in transboundary water management. In: Amsterdam conference on the human dimensions of global environmental change, 30 March. Amsterdam: Ecologic, Institut für Internationale und Europäische Umweltpolitik.
- Langmuir, D., 1971. The geochemistry of some carbonates ground waters in central Pennsylvania. Geochimica et Cosmochimica Acta, 35, 1023–1045. doi:10.1016/0016-7037(71)90019-6
- Leseane, K., et al., 2015. Thermal perturbations beneath the incipient Okavango Rift Zone, northwest Botswana. Journal of Geophysical Research: Solid Earth, 120 (2), 1210–1228.
- Li, S.L., et al., 2010. Geochemistry of dissolved inorganic carbon and carbonate weathering in a small typical karstic catchment of Southwest China: isotopic and chemical constraints. Chemical Geology, 277 (3), 301–309. doi:10.1016/j.chemgeo.2010.08.013
- Linn, F., Masie, M., and Rana, A., 2003. The impacts on groundwater development on shallow aquifers in the lower Okavango Delta, northwestern Botswana. Environmental Geology, 44 (1), 112–118. doi:10.1007/s00254-002-0706-9
- Mazor, E., et al., 1973. Kalahari ground waters: their hydrogen, carbon and oxygen isotopes. IAEA-SM-182/18.
- Mazor, E., et al., 1977. Northern Kalahari ground waters: hydrologic, isotopic and chemical studies at Orapa, Botswana. Journal of Hydrology, 34, 203–234. doi:10.1016/0022-1694(77)90132-9
- Mazor, E., et al., 1980. Chemical composition of groundwaters in the vast Kalahari flatland. Journal of Hydrology, 48, 147–165. doi:10.1016/0022-1694(80)90072-4
- Mbongwe, B., et al., 2003. Dichlorodiphenyltrichloroethane in the aquatic ecosystem of the Okavango Delta, Botswana, South Africa. Environmental Toxicology and Chemistry, 22, 7–19. doi:10.1002/etc.5620220102
- McCarthy, J., et al., 2003. Flooding patterns in the Okavango Wetland in Botswana, between 1972 and 2000. AMBIO: A Journal of the Human Environment, 32, 453–457. doi:10.1579/0044-7447-32.7.453
- McCarthy, T.S., et al., 2000. Seasonal flooding in the Okavango Delta, Botswana-recent history and future prospects. South African Journal of Geology, 96, 25–33.
- McCarthy, T.S., 2006. Groundwater in the wetlands of the Okavango Delta, Botswana, and its contribution to the structure and function of the ecosystem. Journal of Hydrology, 320, 264–282. doi:10.1016/j.jhydrol.2005.07.045
- McCarthy, T.S., et al., 2012. Island forming processes in the Okavango Delta, Botswana. Geomorphology, 179, 249–257. doi:10.1016/j.geomorph.2012.08.016
- McCarthy, T.S. and Ellery, W.N., 1995. Sedimentation on the distal reaches of the Okavango Fan, Botswana, and its bearing on calcrete and silcrete (ganister) formation. Journal of Sedimentary Research, 65, 77–90.
- McCarthy, T.S. and Ellery, W.N., 1998. The Okavango Delta. Transactions of the Royal Society of South Africa, 53 (2), 157–182. doi:10.1080/00359199809520384
- McCarthy, T.S., Ellery, W.N., and Ellery, K., 1993. Vegetation-induced, subsurface precipitation of carbonate as an aggradational process in the permanent swamps of the Okavango Delta fan, Botswana. Chemical Geology, 107, 111–131. doi:10.1016/0009-2541(93)90105-R
- McCarthy, T.S., McIver, J.R., and Cairncross, B., 1986. Carbonate accumulation on islands in the Okavango Delta, Botswana. South African Journal of Science, 82 (10), 588–591.
- McCarthy, T.S., McIver, J.R., and Verhagen, B.T., 1991. Groundwater evolution, chemical sedimentation and carbonate brine formation on an island in the Okavango Delta swamp, Botswana. Applied Geochemistry, 6, 577–595. doi:10.1016/0883-2927(91)90071-V
- McCarthy, T.S. and Metcalfe, J., 1990. Chemical sedimentation in the semi-arid environment of the Okavango Delta, Botswana. Chemical Geology, 89, 157–178. doi:10.1016/0009-2541(90)90065-F
- Mladenov, N., et al., 2005. Effects of annual flooding on dissolved organic carbon dynamics within a pristine wetland, the Okavango Delta, Botswana. Wetlands, 25, 622–638. doi:10.1672/0277-5212(2005)025[0622:EOAFOD]2.0.CO;2
- Mladenov, N., et al., 2007. Simulation of DOM fluxes in a seasonal floodplain of the Okavango Delta, Botswana. Ecological Modelling, 205 (1), 181–195. doi:10.1016/j.ecolmodel.2007.02.015
- Mladenov, N., et al., 2013. Abiotic and biotic factors influencing the mobility of arsenic in groundwater of a through-flow island in the Okavango Delta, Botswana. Journal of Hydrology. 518, 326–341.
- Modisi, M.P., et al., 2000. Rift kinematics during the incipient stages of continental extension: evidence from the nascent Okavango rift basin, northwest Botswana. Geology, 28, 939–942. doi:10.1130/0091-7613(2000)28<939:RKDTIS>2.0.CO;2
- Molwalefhe, L.N., 2004. Geochemical evidence and origin of salinity in the shallow basinal brine from the Makgadikgadi Pans Complexes, northeastern Botswana. In: Stephenson, Shemang and Chaoka eds. Water resources of arid areas. Taylor & Francis, 409–415.
- Nichols, G., 2007. Fluvial systems in desiccating endorheic basins. In: G. Nichols, E. Williams, and C. Paola, eds. Sedimentary processes, environments and basins: a tribute to peter friend. Oxford: Blackwell Publishing, 569–589.
- Nyberg, B., Gawthorpe, R.L., and Helland-Hansen, W., 2018. The distribution of rivers to terrestrial sinks: implications for sediment routing systems. Geomorphology, 316, 1–23. doi:10.1016/j.geomorph.2018.05.007
- Quade, J., Cerling, T.E., and Bowman, J.R., 1989. Development of Asian monsoon revealed by marked ecological shift during the latest Miocene in northern Pakistan. Nature, 342 (6246), 163. doi:10.1038/342163a0
- Ramberg, L. and Wolski, P., 2008. Growing islands and sinking solutes: processes maintaining the endorheic Okavango Delta as a freshwater system. Plant Ecology, 196, 215–231. doi:10.1007/s11258-007-9346-1
- Ramberg, L., Wolski, P., and Krah, M., 2006. Water balance and infiltration in a seasonal floodplain in the Okavango Delta, Botswana. Wetlands, 26, 677–690. doi:10.1672/0277-5212(2006)26[677:WBAIIA]2.0.CO;2
- Reiser, F., et al., 2014. Constraining helicopter electromagnetic models of the Okavango Delta with seismic-refraction and seismic-reflection data Okavango Delta seismic study. Geophysics, 79, B123–B134. doi:10.1190/geo2013-0278.1
- Ringrose, S., et al., 2009. Origins of strandline duricrusts around the Makgadikgadi Pans (Botswana Kalahari) as deduced from their chemical and isotope composition. Sedimentary Geology, 219, 262–279. doi:10.1016/j.sedgeo.2009.05.021
- Sawula, G. and Martins, E., 1991. Major ion chemistry of the lower Boro River, Okavango Delta, Botswana. Journal of Freshwater Biology, 26, 449–481. doi:10.1111/fwb.1991.26.issue-3
- Shaw, P.A. and Nash, D.J., 1998. Dual mechanisms for the formation of fluvial silcretes in the distal reaches of the Okavango Delta Fan, Botswana. Earth Surface Processes and Landforms, 23, 705–714. doi:10.1002/(ISSN)1096-9837
- Stadler, S., et al., 2010. Groundwater flow regime, recharge and regional-scale solute transport in the semi-arid Kalahari of Botswana derived from isotope hydrology and hydrochemistry. Journal of Hydrology, 388 (3–4), 291–303. doi:10.1016/j.jhydrol.2010.05.008
- Stumm, W. and Morgan, J.J., 1996. Aquatic chemistry. New York: John Wiley & Sons. Inc.
- Summerfield, M.A., 1983. Silcrete as a palaeoclimatic indicator: evidence from southern Africa. Palaeogeography, Palaeoclimatology, Palaeoecology, 41, 65–79. doi:10.1016/0031-0182(83)90076-7
- Talbot, M.R., 1990. A review of the palaeohydrological interpretation of carbon and oxygen isotopic ratios in primary lacustrine carbonates. Chemical Geology: Isotope Geoscience section. 80 (4), 261–279.
- Telmer, K. and Veizer, J., 1999. Carbon fluxes, pCO2 and substrate weathering in a large northern river basin, Canada: carbon isotope perspectives. Chemical Geology, 159, 61–86. doi:10.1016/S0009-2541(99)00034-0
- Vogel, J.C. and Van Urk, H., 1975. Isotopic composition of groundwater in semi-arid regions of southern Africa. Journal of Hydrology, 25, 23–36. doi:10.1016/0022-1694(75)90036-0
- Wang, L., et al., 2007. Biogeochemistry of Kalahari sands. Journal of Arid Environments, 71, 259–279. doi:10.1016/j.jaridenv.2007.03.016
- Wang, L., et al., 2010. Patterns and implications of plant-soil δ13C and δ15N values in African savanna ecosystems. Quaternary Research, 73, 77–83. doi:10.1016/j.yqres.2008.11.004
- Wilk, J., et al., 2006. Estimating rainfall and water balance over the Okavango River Basin for hydrological applications. Journal of Hydrology, 331, 18–29. doi:10.1016/j.jhydrol.2006.04.049
- Wilson, B.H. and Dincer, T., 1976. An introduction to the hydrology and hydrography of the Okavango Delta. In: Symposium on the Okavango Delta. Botswana: Botswana Society, Gaborone, 33–48.