
 ?Mathematical formulae have been encoded as MathML and are displayed in this HTML version using MathJax in order to improve their display. Uncheck the box to turn MathJax off. This feature requires Javascript. Click on a formula to zoom.
ABSTRACT
Changes in monthly streamflow and the potential influences and feedbacks of agricultural activities are investigated. Significant decreases in streamflow are observed in northern China, including the Yellow, Huaihe and Haihe river basins, while in southern China streamflow increases significantly in the Yangtze, Pearl and South river basins. This spatial pattern of changes in streamflow indicates that the imbalance in water resources between northern (dry) and southern (wet) China has increased during past decades. On the one hand, available water resources are a controlling factor determining the expansion of irrigated land and the structure of crop plantation (i.e. rice, wheat, corn or bean); on the other hand, crop planting structure and effective irrigated areas are important determinants of changes in streamflow. The increasing effective irrigation and rice planting areas in northern China may increase water withdrawal from rivers, causing subsequent decreases in streamflow, while in southeastern China, decreasing effective irrigation areas enhance the increases in streamflow.
Editor A. Castellarin; Associate editor A. Viglione
1 Introduction
Water resources and crop production are major forces that China and the rest of the world will have to face under climate change (Döll and Siebert Citation2002). More intensive and frequent flood and drought events induced by an accelerated global water cycle under human-induced global warming will be greater threats to crop production (Allen et al. Citation2002, Dore et al. Citation2005, Viglione et al. Citation2016). Over recent decades, many studies have focused on the impacts of global warming on precipitation and streamflow (e.g. Asadieh and Krakauer Citation2017, Gu et al. Citation2017a, Citation2017b, Teklesadik et al. Citation2017). Extreme precipitation events are expected to become more frequent and intensive during warm periods, while they may be less intensive during cold periods (Richard et al. Citation2008). Spatially, global warming-induced increases in precipitation are observed in high latitudes and tropical regions and decreases are observed in arid subtropical regions (Liu et al. Citation2013).
Spatio-temporal changes in precipitation cause changes in streamflow, which plays an important role in society, economics, culture and especially agriculture. Observations indicate that precipitation intensity and flood risk increased synchronously at the end of the 20th century in the Northern Hemisphere (Schiermeier et al. Citation2011). Multi-model studies project 10–40% increases in runoff in eastern equatorial Africa, the La Plata basin (South America) and high-latitude North America and Eurasia, and 10–30% decreases in runoff in southern Africa, southern Europe, the Middle East and mid-latitude western North America by the year 2050. Regionally, significant shifts in hydrological behaviour were mostly influenced by catchment characteristics related to pre-drought (aridity index and rainfall seasonality), and were amplified by seasonal rainfall changes in southeastern Australia (Saft et al. Citation2016). Saft et al. (Citation2015) also highlighted that changing climatic conditions may affect runoff generation processes and cause changes in the rainfall–runoff relationship.
Aside from changes in precipitation, human activities have continuously strengthened in past decades, and have impacted heavily on streamflow (Haddeland et al. Citation2014). Recent studies have focused mainly on the impacts of water conservancy projects on streamflow (e.g. Zhang et al. Citation2015a, Turner et al. Citation2017, Naz et al. Citation2018). Although water conservancy has been proven to enhance the spatio-temporal heterogeneity of water resources (Poff et al. Citation2007, Zhang et al. Citation2015b), its impacts on the runoff process and annual mean streamflow are relatively small. Other studies explored the relationships between streamflow and land use/land cover (LULC), which has important effects on runoff generation (e.g. Gupta et al. Citation2015, Hassaballah et al. Citation2017, Vaighan et al. Citation2017, Wei et al. Citation2018). Most of these studies focused on the impacts of vegetation change or urbanization on streamflow at the basin scale (e.g. Gupta et al. Citation2015, Hassaballah et al. Citation2017). However, little attention has been paid to the relationship between agricultural development and streamflow changes (e.g. Villarini and Strong Citation2014, Vaighan et al. Citation2017). In fact, agricultural activities can have significant impacts on streamflow, since about 70% of water withdrawal is for agricultural irrigation (Shiklomanov and Rodda Citation2003).
China is the most populous and the third largest country in the world in terms of national territorial area. Agricultural sustainability is always a concern in China because the country relies heavily on only 7% of the world’s available arable land to feed 22% of the world’s population. Water resources management poses a great challenge for agricultural development; hence a comprehensive understanding of spatio-temporal changes in water resources and the potential links to agriculture are of great importance to achieve long-term sustainability in agriculture, economy and society. Precipitation is increasing in southwestern, northwestern and eastern China, and decreasing in central and northeastern China (Wang et al. Citation2005). However, there is a wet tendency in southern China and a dry tendency in northern China, as well as a wet tendency in winter and a dry tendency in summer due to changes in the large-scale water vapour cycle (Zhang et al. Citation2011). As a result of these changes in precipitation, significant alterations in runoff have been detected, especially in northern China. For example, significant decreases have been observed in the Haihe River Basin (Bao et al. Citation2012) and the Yellow River mainstream (He et al. Citation2013). Besides the considerable impacts on streamflow, climate change also significantly affects agricultural activities (Piao et al. Citation2010). More intensive and frequent extreme climate events under global warming have largely influenced irrigation development and crop production. For example, rare flood and drought events may severely interrupt local and regional irrigation systems and crop growth (Frederick Citation1998, De et al. Citation2004, Liu et al. Citation2009, Wrachien et al. Citation2015). Responses to changes in climate, and types of agricultural activities, such as irrigation patterns and crop species, are also constantly evolving. The effects of climate change on agriculture in some regions are positive, i.e. increasing crop production when precipitation and temperature increase to their advantage (Ashfaq et al. Citation2011, Thaler et al. Citation2012).
Although previous studies have investigated relationships of changes in streamflow and agricultural activities at regional scales (e.g. Schilling et al. Citation2008, Virrarini et al. Citation2014, Citation2015, Li et al. Citation2017), studies in China are at the national scale, which can provide an overall picture about the spatial disparity of climate change impacts on water resources and agricultural activities; however, studies within China are still limited. Therefore, the objectives of this study are: (1) to detect spatial patterns and temporal changes in monthly streamflow during recent decades based on observations of hydrological stations covering the whole of China; (2) to analyse the potential influence of agricultural activities, such as irrigation and crop planting structure on changes in streamflow; and (3) to examine the spatio-temporal changes in agricultural disasters (defined herein as crop areas with agricultural loss caused by flood or drought). This study is of theoretical and practical importance in water resources and agricultural management, as well as revealing the negative impacts of floods and droughts on agriculture in China.
The paper is organized as follows: Section 2 describes the data analysed in this study; the methods employed are introduced in detail in Section 3; the results are presented and discussed in Section 4; and the conclusions obtained are summarized in Section 5.
2 Data
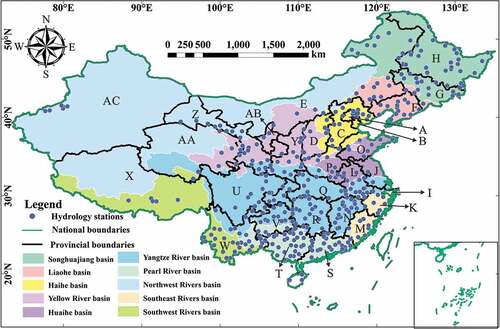
Monthly streamflow data for the period 1960–2000 from 382 hydrological stations covering the Chinese territory were obtained from the Ministry of Water Resources (Liu et al. Citation2017). The hydrological stations with missing values for more than two years were excluded, so that 370 stations remained (). The missing values were filled by the averages of the neighbouring seven years. China’s total freshwater volume is 2.81 × 10¹² m3, with 2.7 × 10¹² m3 of surface water and 0.83 × 10¹² m3 of groundwater. The amount of surface water is 3.25 times that of groundwater. Additionally, the use of groundwater is limited due to the unsustainability of groundwater resources. Therefore, surface water is the dominant water resource in China, and it is developed to meet the needs of human life, agriculture and industry. In this paper, the water resources of China are specifically the surface water because of its huge importance to China.
Figure 1. Map of China showing the locations of the 370 hydrological stations used in this study. A: Beijing; B: Tianjin; C: Hebei; D: Shanxi; E: Inner Mongolia; F: Liaoning; G: Jilin; H: Heilongjiang; I: Shanghai; J: Jiangsu; K: Zhejiang; L: Anhui; M: Fujian; N: Jiangxi; O: Shandong; P: Henan; Q: Hubei; R: Hunan; S: Guangdong; T: Guangxi; U: Sichuan; V: Guizhou; W: Yunnan; X: Tibet; Y: Shaanxi; Z: Gansu; AA: Qinghai; AB: Ningxia; AC: Xinjiang.
Flood-affected and drought-affected crop areas (defined as crop areas with agricultural loss exceeding 10% of agricultural production caused by flood or drought), flood-destroyed and drought-destroyed crop areas (defined as crop areas with agricultural loss exceeding 30% of agricultural production caused by flood or drought), the effective irrigation area, the total crop cultivated area and the cultivated area of major crops (rice, wheat, corn and beans) in 29 provinces of China from 1972 to 2000 were also collected from the Ministry of Agriculture Planting Management Division under rigorous quality control.
3 Methods
In this section we provide an overview of the methods that were used to assess the spatial patterns and temporal changes of water resources and examine the spatio-temporal changes in agricultural disasters. The modified Mann-Kendall test and seasonal Mann-Kendall test were selected to detect trends in monthly streamflow for individual stations, while the regional Mann-Kendall test was selected to detect trends in regional streamflow. Moreover, the Mann-Whitney U test was used to detect change points in the streamflow. Finally, the Getis-Ord Gi* analysis was used to detect the spatial clustering of streamflow change points.
3.1 Modified Mann-Kendall test
The Mann-Kendall (MK) test (Mann Citation1945, Kendall Citation1975), a nonparametric trend detection method, is widely used to detect trends without normality or linearity assumptions (Alan et al. Citation2003, Zhang et al. Citation2015c). Because of the influence of persistence on the detection results, the modified MK statistic (MMK) is recommended when autocorrelation coefficients significantly exist at the 95% confidence level (von Storch and Navarra Citation1995, Hamed and Rao Citation1998, Zhang et al. Citation2015c).
The magnitude of trends was calculated by Sen’s method (Gilbert Citation1987, Zhang et al. Citation2015c):
where Xi and Xj are the ith and jth values in a time series, respectively, and β is the slope indicating the magnitude the trend (Zhang et al. Citation2015c).
3.2 Seasonal Mann-Kendall test
To eliminate the influence of seasonality on the results of trend detections in monthly streamflow, the seasonal Mann-Kendall (SMK) method is used, as follows (Hirsch et al. Citation1982):
where X is the whole time series of monthly streamflow, Xi is the streamflow of the ith month, which consists of values of ni year, ni is the number of years. Then, the statistical value Si is calculated as:
where Si follows approximately a normal distribution of (0, var[S′]):
Based on S, the standardized statistics Z for the one-tailed test is formulated as:
The autocorrelation in seasonal monthly streamflow is reduced by using the method proposed by Hirsch et al. (Citation1982) and Hirsch and Slack (Citation1984).
3.3 Regional Mann-Kendall test
Both the MMK and SMK tests are used to detect the trend in an individual station, while the regional Mann-Kendall (RMK) test functions to detect the trend in a region. Based on the SMK test, the RMK test can consider the impacts of spatial correlations among stations on the results of trend detection (Helsel et al. Citation2006). The regional average of statistical value Sr is calculated as:
where m represents the number of stations within the considered region, and follows approximately a normal distribution of (0,
):
Then the standardized statistic Zr can be formulated as:
Considering the spatial correlations among stations, the variance of is modified as:
where is the mean value of correlations calculated in pairwise stations in one region. Hence, the modified standardized statistic Zr is rewritten as:
All the calculations of MMK, SMK and RMK tests were conducted in the “fume” and “rkt” packages in R language.
3.4 Mann-Whitney U test
A number of statistical tests for detecting the change point have been used in previous studies, such as the Mann-Whitney U test (Zhang et al. Citation2014a), the moving T test (Jiang et al. Citation2002) and the Pettitt test (Villarini et al. Citation2009). Among these tests, the Mann-Whitney U test was chosen in this study to detect change points for the following reasons: (a) it is a nonparametric (rank-based) test without presupposing the location of the change point; (b) it returns a single change point for a given time series considering that our time series of precipitation extremes is only 41 years; and (c) the p value of the test statistic can be computed. The Mann-Whitney U test was conducted in the “stats” package in R language.
3.5 Spatial Getis-Ord Gi* analysis
The Getis-Ord Gi* test, known as a hot-spot analysis method, is usually used to analyse the location-related tendency in the attributes of spatial data (the clustering of points or areas in space). The Getis-Ord Gi* test is commonly used to investigate the specific spatial distribution and local clusters of points without any preconceptions about their locations (Ord and Getis Citation2010, Peeters et al. Citation2015, Jana et al. Citation2016). The resultant z scores and p values present where features with either high or low values cluster spatially. Therefore, the Getis-Ord Gi* test was used in this study to detect the spatial clusters of the change points.
The Getis–Ord Gi* statistic is calculated as follows to get the z scores:
where is the attribute value for feature j, wi,j is the spatial weight between features i and j, n is the total number of features with:
and
4 Results and discussion
4.1 Spatio-temporal changes in streamflow
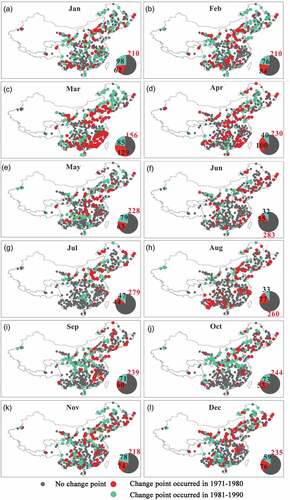
In this section we examine the abrupt change points and monotonic trends of streamflow to identify the spatio-temporal changes in streamflow. Abrupt change points are moments of discontinuity in a stochastic process, and abrupt change point analysis is widely used in hydrology and climatology (Zhang et al. Citation2014b). A change point is detected when the p value of the Mann-Whitney U test is less than 0.05 and the location of change point is 10 years away from the starting year and ending year; this makes the detection results more reliable by ensuring the sample sizes of the two sub-periods are sufficient.
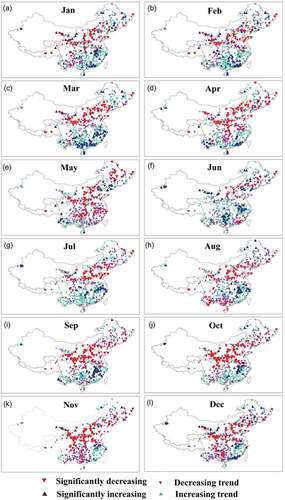
The number of stations without change points is more than 210 in most months, and the average number of stations without change points in a 12-month period is 233, which accounts for 63% of the total of 370 stations. This indicates there is no statistical evidence to support an abrupt change in streamflow in the study area (). The streamflow with a change point after 1980 tends to occur mostly in the Yellow, Hai and Huai river basins, especially in the autumn season (i.e. September–November), while the river basins in southeastern China tend to have change points before 1980, especially in March–April. The Huang-Huai-Hai Plain located in the Hai and Liao river basins is the most intensively irrigated area in China, where water resources distribution is uneven in different seasons (Qiu et al. Citation2016). Previous studies have detected streamflow with change points occurring in the year 1984 in the Hai River basin (Wang et al. Citation2009, Ma et al. Citation2010), and for the streamflow in the Liao River basin, three change points were detected: 1965, 1985 and 1996. The change points occurring after 1980 were attributed to the increase in agricultural activities, which resulted in increased agricultural water consumption (Yang and Tian Citation2009).
Overall, the distribution of stations with a change point is obviously heterogeneous for different regions and different months, implying that the potential factors causing abrupt change in streamflow are also different in the various regions and months (). For example, previous regional studies have shown that both decreases in precipitation and increases in irrigated water withdrawal accounted for the abrupt change in streamflow in the Yellow, Hai and Huai river basins (Bao et al. Citation2012, He et al. Citation2013). Significantly abrupt changes in streamflow were largely influenced by the construction of water reservoirs as well as precipitation changes in the East and Pearl river basins (Zhang et al. Citation2014b).
Figure 2. Results of change point detection in streamflow for each month using the Mann-Whitney U test.
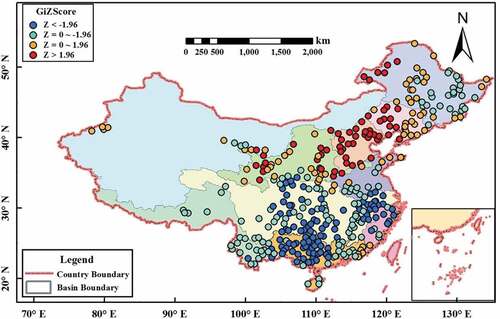
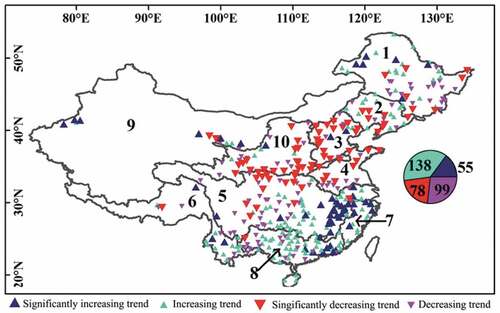
Because the results of change point detection among the 12 months () seem not to be unambiguously comparable, the Getis-Ord Gi* method (Getis and Ord Citation1992) was used to identify the region in which a change point frequently occurs. A Getis-Ord Gi* statistic greater than 1.96 indicates that a change point tends to occur in most of months, while a statistic smaller than 1.96 indicates occurrence of a change point in fewer months (). The Hai and Liao river basins are the two regions where there is a greater possibility of change points occurring in most months, while the Pearl River Basin and southeast China river basins tend to have stationary streamflow without abrupt change in most months (). The stations with change points occurring in most months are clustered in the Hai River basin (23, 100% of the stations in the basin) and the Liao River basin (11, 50% of the stations in the basin), implying that the streamflow generation process and conditions may be heavily altered in these river basins.
Figure 3. Results of clustering analysis in change points by the Getis-Ord Gi* method.
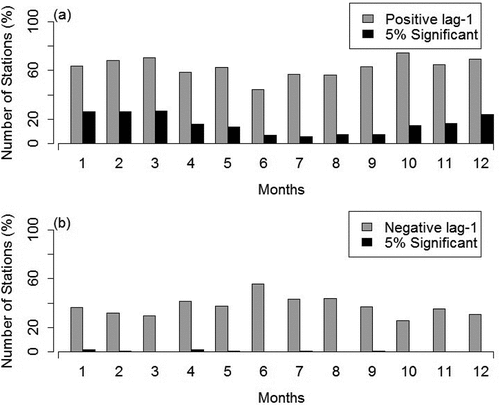
shows the lag-1 autocorrelation coefficients of monthly streamflow in the 370 stations studied. For most of the stations, we detected positive autocorrelations in each month, among which the autocorrelation in about 10–20% of stations was significant at the 5% level. In the stations with negative autocorrelation, those reaching 5% significance level were clearly fewer. Nevertheless, the autocorrelation in monthly streamflow series should be eliminated before detecting their trends.
Figure 4. Percentage of stations with (a) positive and (b) negative lag-1 autocorrelations in monthly streamflow.
Following the change point analysis, trends in monthly streamflow were detected by the MMK test to eliminate the autocorrelation (). The trends in all months show an obvious spatial pattern, with increases in streamflow in southern China and decreases in northern China. Significant decreases can be observed in the Yellow and Hai river basins for every month, indicating that the two regions may face a severe challenge of water resources shortage. Although the basins situated in southern China show increases in streamflow, the increases in most of the stations are not significant, except in the lower reaches of the Yangtze and Pearl rivers.
The Yangtze and Yellow rivers are the two largest rivers in China. Over the past 41 years, the streamflow in the Yangtze River has increased by 2.05 km3/year, while decreased streamflow at a rate of 0.7 km3/year has been detected in the Yellow River (figure not shown). Increased precipitation contributed 12% of the increased streamflow in the Yangtze River (Ren Citation2007), and increased withdrawals explained about 35% of the decreased streamflow in the Yellow River (Fu et al. Citation2004).
Figure 5. Results of trend detection in streamflow for each month using the MMK test.
We also evaluated the trends in monthly streamflow for the whole period (i.e. the time series of 1960/01, 1960/02, 1960/03, …, 2000/12), including individual months, using the SMK method (). The increasing streamflow in southern China and decreasing streamflow in northern China were detected again (). To further verify these results, trends of streamflow in major river basins in each month were evaluated using the RMK test ( and ). Decreases in streamflow were detected for the Hai River basin in all 12 months, and for most months in the Liao, Huai and Yellow river basins. All these basins are located in northern China. For the basins in southern China, such as the Yangtze, Pearl and southeast river basins, only a few months showed significantly increasing trends. Among the 12 months in 10 river basins, the number with streamflow showing a decreasing trend is 71 (59% of the total 120 trends), indicating that streamflow in most parts of China tends to be decreasing. Here, we should also note that increases in streamflow can be observed in most months in the northwest river basin, which is in line with the increases in precipitation and glacier melting in this region, due to global warming (Gu et al. Citation2017a, Xu et al. Citation2018).
Table 1. Results of the spatial correlation test of monthly runoff series in each basin showing significant correlation between two stations.
Figure 6. Results of trend detection in the whole monthly streamflow using the SMK test. 1: Songhuajiang River; 2: Liao River; 3 Hai River; 4: Huai River; 5: Yangtze River; 6: rivers in southwest China; 7: rivers in southeast China; 8: Pearl River; 9: rivers in northwest China; 10: Yellow River.
The Chinese government has implemented the South-to-North Water Diversion project to solve the deficiency in water resources in northern China by transporting river water from southern China. On the one hand, our results show that the imbalance in water resources between northern and southern China has increased during the past few decades, which shows the necessity and importance of the South-to-North Water Diversion project. On the other hand, non-significant increases in streamflow in southern China make the project seem not so reasonable. Therefore, it is imperative to evaluate the subsequent influences of the project after its operation.
4.2 Potential impacts of agricultural activities on streamflow
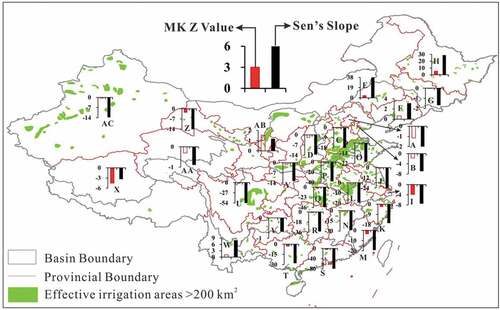
Agricultural water consumption, such as seasonal irrigation and cropping systems (e.g. perennial and annual crops), is an important factor in the changes in streamflow. Switching from annual cropping to perennial cropping will increase the demand on water resources for crop water requirements. Row crop intensity and draining row crop-dominated states were also found to have an impact on the streamflow (Schilling Citation2005, Zhang and Schilling Citation2006, Gao et al. Citation2013, Li et al. Citation2017). The Yellow, Hai and Liao river basins, where significantly decreasing trends in streamflow were detected, are also regions of China with the most intensive agricultural activities. Beside the impacts of climate change, irrigated water withdrawal is another important factor for water resources. The study by Bao et al. (Citation2012) showed that when cultivated farmland exceeded 25% of a sub-catchment area, an abrupt decline in streamflow occurred and the related agricultural water use was the most probable driving factor of streamflow decline. Although most of the provinces (16 of 29 provinces in total) in China show significantly decreasing trends in efficient irrigated areas, the reasons for these decreases are different in the various regions (; see also Supplementary material, Table S1). Although changes in efficient irrigated areas are influenced by many factors, such as “returning farmland to forests”, or urbanization, the interaction between irrigation and water resources is important. Decreases in efficient irrigated areas in the provinces situated in the Yellow and Hai river basins may be caused by a shortage of water resources, while this may not be the case for the provinces in southern China with abundant water resources.
Figure 7. Province-based results of trend detection in effective irrigated areas using the MMK test. The histograms indicate the MK results for effective irrigated areas in each province. Solid bars indicate a significant trend, while hollow bars indicate an insignificant trend.
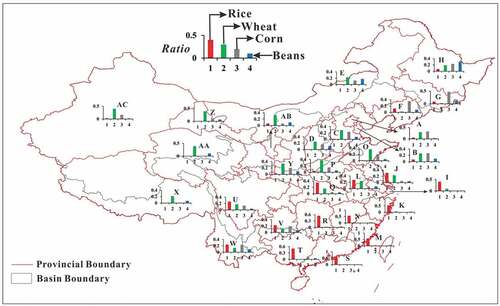
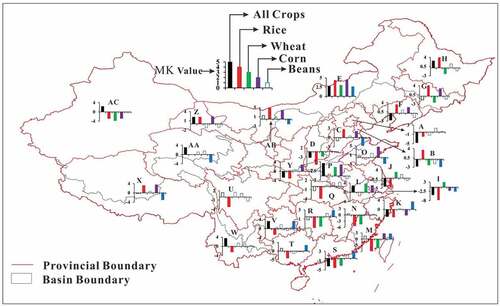
Various types of crops have different demands on water resources, having different agricultural water consumption. Rice, wheat, corn and beans are the major crop types in China. The ratios of cultivated areas growing these crops compared to total crop cultivated area in the provinces show that rice is mainly planted in southeastern China, where the water resources are abundant, while wheat, corn and beans, which are xerophytes with smaller demands on water resources, are mainly planted in northern and northwestern China (, Table S2). The spatial patterns of crops are highly consistent with that of water resources, implying that water resources play a key role in determining plantation structure at the national scale.
Figure 8. Ratios of areas cultivated with rice, wheat, corn and beans to total crop-cultivated area in each province.
However, the trends in cultivated areas of rice, wheat, corn and beans indicate the plantation structure is changing (, Table S3). In southern China, the rice-cultivated areas have significantly decreased (18 of 29 total provinces), while corn-cultivated areas have significantly increased (23 of 29 total provinces). In contrast, some of the provinces in northern China, such as Hebei, Ningxia, Gansu and Inner Mongolia, show an increasing trend in rice-cultivated areas. The trends in cultivated areas of the four crop types contradict the spatial distribution of water resources, which may be due to industrial policy, trade patterns or economic factors. For example, rice planting showed a significant northward expansion from 0.22 Mha in the early 1980s to 2.25 Mha in 2007 (China Statistics Press 2009), and, in northwest China, the growing season of cotton has increased by 9 days.
Figure 9. Province-based results of trend detections in areas cultivated with all crops, rice, wheat, corn and beans using the MMK test. Solid bars indicate a significant trend, while hollow bars indicate an insignificant trend.
These changes in plantation structure may have important influences on streamflow. For example, the increasing rice cultivated areas require more irrigated water than wheat and corn, which leads to decreases in streamflow and deteriorates the water environment. The discrepancies in spatial patterns of trends between water resources and cultivated areas increase the risk of agricultural disasters in China.
We also collected domestic, industrial, agricultural and ecological environment replenishment water use data in five river basins (Songhuajiang, Liao, Hai, Huai and Yellow rivers) for the period 2012–2016 (see Supplementary material, Figs S1–S5). It can be seen that agricultural water use is the major type of water consumption and it exceeds the sum of the other three water use types (industrial, agricultural and ecological environment replenishment water use) in all of the five basins. The average agricultural water use during the period 2012–2016 contributed to 81, 66, 65, 69 and 71% of total water use in the Songhuajiang, Liao, Hai, Huai and Yellow river basins, respectively, corresponding to 26, 35, 144, 76 and 51%, respectively, of total surface water resources. It should be noted that the amount of agricultural water use is about 1.5 times greater than that of total surface water resources in the Hai River basin, indicating that about 50% of agricultural water use comes from groundwater. The sum of industrial, agricultural and ecological environment replenishment water use contributes to only 19% 34, 35, 31 and 29% of total water use (6, 18, 80, 34 and 21% of total surface water resources) in the Songhuajiang, Liao, Hai, Huai and Yellow river basins, respectively. These results highlight the importance of the effect of agricultural activities on water resources.
4.3 Spatio-temporal changes in agricultural disasters
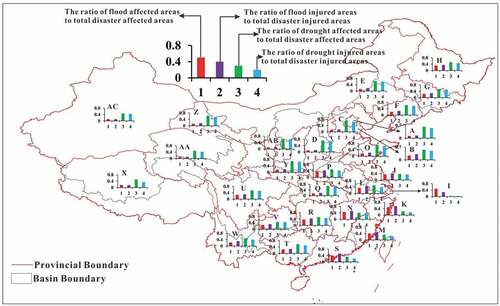
As a result of the interactions between water resources and agricultural activities, combined with climate change, agricultural disasters are receiving more and more attention in China. We consider the flood- and drought-affected and destroyed crop areas because flood and drought are the two major types of natural disasters in China (Qiu et al. Citation2016). Considering the averages of the ratios of flood- and drought-affected and flood- and drought-destroyed crop areas to total affected and destroyed crop areas in each province, it may be seen that only five of the 29 provinces (Shanghai, Zhejiang, Fujian, Jiangxi, Guangdong) suffered more flood than drought disasters (). Most provinces (24) show that drought disaster is the more serious agricultural problem in China (Qiu et al. Citation2016). The results further indicate that agricultural disasters in southern China are mainly induced by floods, while those in northern China are mostly caused by droughts (). The spatial patterns of “flood–drought” in agricultural disasters are in line with those in streamflow. From the aspect of agricultural disasters, drought-affected and drought-destroyed crop areas account for the larger percentages (82.8%) than those induced by flood in most provinces (i.e. 24 of total 29 provinces) (). Over the past few decades, many water conservancy projects (such as dams and reservoirs) have been built as flood defences, while drought-induced agricultural disasters seem not to be solved effectively. Unfortunately, the decrease in streamflow in northern China may aggravate drought-induced agricultural disasters, which may threaten the food security of China.
Table 2. Results of the RMK regional trend detection test for considering the spatial correlation: bilateral detection of p value (* indicates significance at the 10% level). Bold indicates a decreasing trend, while no bold indicates an increasing trend.
Table 3. Ratios of crop areas with flood or drought disasters to total disasters in each province (see also ). Bold indicates the five provinces in which the ratio of flood disaster areas to total disaster crop areas is greater than the ratio for drought disaster.
Figure 10. Averages of the ratios of flood-affected and drought-affected crop areas and flood- destroyed and drought-destroyed crop areas to total affected and destroyed crop areas in each province.
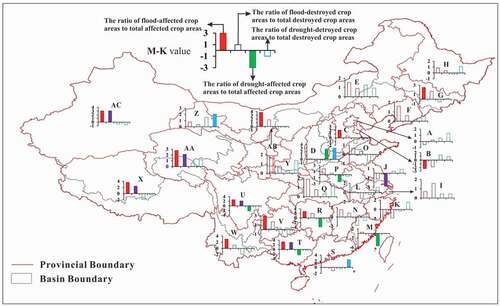
We also evaluated the trends in ratios of flood- and drought-affected and flood- and drought-destroyed crop areas compared to total affected and destroyed crop areas (, Table S4). It is interesting to note that the ratios of these flood-induced (flood-affected/flood-destroyed) agricultural disasters show increasing trends in northwestern China, especially in the provinces of Xinjiang (trends: 3.02/3.02), Qinghai (2.78/2.12), Gansu (0.77/0.34), and Inner Mongolia (1.54/0.90) (, Table S4). Extreme precipitation events have become more frequent with higher magnitude in northwest China (Gu et al. Citation2017a, Zhang et al. Citation2013). This increase in precipitation extremes triggers intensifying flood hazards in northwestern China. Moreover, in recent decades, droughts have become common in northwestern China and more attention has been paid to the mitigation of drought hazards rather than to floods. Such increases in flood-induced agricultural disasters may have negative impacts on the plantation structure. For instance, wheat and corn, the major two drought-resistant crops in northwestern China, are not suitable under flood conditions.
Figure 11. Province-based results of trend detection in the ratios of flood-affected and drought-affected crop areas and flood-destroyed and drought-destroyed crop areas to total affected and destroyed crop areas using the MMK test. Solid bars indicate a significant trend, while hollow bars indicate an insignificant trend.
5 Summary and conclusions
This study investigated the spatio-temporal changes in water resources using monthly streamflow data from 370 hydrological stations in China. The potential links between water resources and agricultural activities such as irrigation and cropping structures were analysed. The changes in agricultural disasters, including flood-affected and flood-destroyed crop areas and drought-affected and drought-destroyed crop areas were also evaluated.
The results show that northern China (excluding northwest China) is dominated by decreasing streamflow, which is the opposite of the increases in southeastern China. The abundant water resources in southeastern China have become more abundant, while the limited water resources in northern China have become scarcer. Therefore, the imbalance of water resources between northern China and southern China has increased. The decreases in water resources in northern China are the combined effects of climate change and human activities. The streamflow decreases in most months at the basin scale over China imply a deterioration of the situation of water resources at the national scale.
The interaction between water resources and agricultural activities is complex. Observations show that effective irrigated areas are decreasing in most of the provinces in China. A large amount of water resources is consumed by agricultural irrigation, which is a major cause of decreases in streamflow in northern China. In turn, the shortage of water resources limits the irrigated area expansion in northern China. One of the limitations in this paper is that the contributions of climate change and irrigation activities to changes in streamflow in China are not quantified. Separating these contributions is a huge challenge at the national scale due to the complex interactions in the driving factors, including climate change, irrigation and other factors such as land use/land cover and vegetation.
The spatial pattern of water resources is a key issue that determines plantation structure at the national scale. Rice, a crop type that has a high water demand, is mainly planted in southeastern China, while wheat, corn and beans, which are xerophytes with smaller water demands, are mainly planted in northern and northwestern China. However, some of the provinces of northern China, such as Hebei, Ningxia, Gansu and Inner Mongolia, showed an increasing trend in rice-cultivated areas. Such increases in rice plantation in the dry areas will not only aggravate water shortages through increasing water withdrawal, but may also increase the risk of agricultural disasters occurring.
Finally, we evaluated the spatio-temporal changes in agricultural disasters. These are triggered mainly by floods in southern China, and by droughts in northern China. This spatial pattern of agricultural disasters is in line with that of streamflow. Nevertheless, drought-affected and drought-destroyed crop areas account for a larger percentage of agricultural disasters than flood-induced disasters in most provinces. This can be attributed to the widely deteriorating water resources in China. The ratios of flood-induced agricultural disasters increased in the provinces of northwestern China, especially in Xinjiang, Qinghai, Gansu and Inner Mongolia. This can be explained by the wetting trend in northwestern China induced by global warming.
This study highlights the importance of mitigating and adapting changes in water resources and agricultural activities. This calls for more measures (e.g. water resources laws, water conservancy projects) to be adopted to enhance the sustainable use of water resources and development of agriculture, especially in northern China. The contradiction between the water resources shortage and substantial agriculture water use will be a huge challenge for Chinese food safety, which also serves as a warning to areas with water resources changes similar to China. Thus, advanced agriculture and biotechnology should be encouraged and developed in China to reduce the limitations of water resources shortages and their effect on agriculture development, such as the largest plant biotechnology capacity, and film drip irrigation technology. These circumstances in China can provide a reference to other regions of the world that also face the predicament of changing water resources and agricultural production.
Supplemental Material
Download MS Word (316.2 KB)Acknowledgments
Detailed information such as data can be obtained by writing to the corresponding author at [email protected]. We thank the four eminent reviewers, the associate editor Dr Alberto Viglione and the editor Dr Attilio Castellarin, whose comments and suggestions improved our study significantly.
Disclosure statement
No potential conflict of interest was reported by the authors.
SUPPLEMENTAL DATA
Supplemental data for this article can be accessed at here.
Additional information
Funding
Related Research Data
References
- Alan, D.Z., et al., 2003. Detection of intensification in global- and continental-scale hydrological cycles: temporal scale of evaluation. Journal of Climate, 16, 535–547. doi:10.1175/1520-0442(2003)0162.0.CO;2
- Allen, M. and Ingram, W.J., 2002. Constraints on future changes in climate and the hydrologic cycle. Nature, 419, 224–232. doi:10.1038/nature01092
- Asadieh, B. and Krakauer, N.Y., 2017. Global change in streamflow extremes under climate change over the 21st century. Hydrology and Earth System Sciences, 21, 5863–5874. doi:10.5194/hess-21-5863-2017
- Ashfaq, M., et al., 2011. Impact of climate change on wheat productivity in mixed cropping system of Punjab. Soil & Environment, 30 (2), 110–114. doi:10.1590/S0100-29452011005000080
- Bao, Z., et al., 2012. Attribution for decreasing streamflow of the Haihe River basin, northern China: climate variability or human activities? Journal of Hydrology, 460–461 (3), 117–129. doi:10.1016/j.jhydrol.2012.06.054
- De Wrachien, D., Ragab, R., and Schultz, B., 2004. Agricultural development and food security under climate uncertainty. Mediterranean Journal of Economics Agriculture & Environment, 3 (3), 12–19.
- Döll, P. and Siebert, S., 2002. Global modeling of irrigation water requirements. Water Resources Research, 38 (4), 8-1-8-10. doi:10.1029/2001WR000355
- Dore, H.I.M., 2005. Climate change and changes in global precipitation patterns: what do we know? Environmental International, 31 (8), 1167–1181. doi:10.1016/j.envint.2005.03.004
- Frederick, K.D., 1998. Principles and concepts for water resources planning under climate uncertainty. Journal of Contemporary Water Research & Education, 1998 (112), 41–46.
- Fu, G.B., et al., 2004. Hydro-climatic trends of the Yellow River Basin for the last 50 years. Climatic Change, 65, 149–178. doi:10.1023/b:clim.0000037491.95395.bb
- Gao, P., et al., 2013. Impact of climate change and anthropogenic activities on stream flow and sediment discharge in the Wei river basin, china. Hydrology and Earth System Sciences, 17 (3), 961–972. doi:10.5194/hess-17-961-2013
- Getis, A. and Ord, K., 1992. The analysis of spatial association by use of distance statistics. Geographical Analysis, 24, 189–206. doi:10.1111/j.1538-4632.1992.tb00261.x
- Gilbert, R.O., 1987. Sen’s nonparametric estimator of slope. Statistical methods for environmental pollution monitoring. Manhattan: John Wiley and Sons, 217–219.
- Gu, X., et al., 2017a. Changes in magnitude and frequency of heavy precipitation across China and its potential links to summer temperature. Journal of Hydrology, 547, 718–731. doi:10.1016/j.jhydrol.2017.02.041
- Gu, X., et al., 2017b. Nonstationarity in timing of extreme precipitation across China and impact of tropical cyclones. Global and Planetary Change, 149, 153–165. doi:10.1016/j.gloplacha.2016.12.019
- Gupta, S.C., et al., 2015. Climate and agricultural land use change impact seasonal streamflow in the upper midwestern United States. Water Resources Research, 51, 5301–5317. doi:10.1002/2015WR017323
- Haddeland, H., et al., 2014. Global water resources affected by human interventions and climate change. Proceedings of the National Academy of Sciences of the United States of America, 111 (9), 6251–6256. doi:10.1073/pnas.1222475110
- Hamed, K.H. and Rao, A.R., 1998. A modified Mann–kendall trend test for autocorrelated data. Journal of Hydrology, 204 (1–4), 182–196. doi:10.1016/S0022-1694(97)00125-X
- Hassaballah, K., et al., 2017. Analysis of streamflow response to land use and land cover changes using satellite data and hydrological modelling: case study of Dinder and Rahad tributaries of the Blue Nile (Ethiopia-Sudan). Hydrology and Earth System Sciences, 21, 5217–5242. doi:10.5194/hess-21-5217-2017
- He, B., Miao, C.Y., and Trend, S.W., 2013. Abrupt change, and periodicity of streamflow in the mainstream of Yellow River. Environmental Monitoring and Assessment, 185 (7), 6187–6199. doi:10.1007/s10661-012-3016-z
- Helsel, D.R. and Frans, L.M., 2006. The regional Kendall test for trend. Environmental Science and Technology, 40, 4066–4073. doi:10.1021/es051650b
- Hirsch, R.M. and Slack, J.R., 1984. A nonparametric trend test for seasonal data with serial dependence. Water Resources Research, 20 (6), 727–732. doi:10.1029/WR020i006p00727
- Hirsch, R.M., Slack, J.R., and Smith, R.A., 1982. Techniques of trend analysis for monthly water quality data. Water Resources Research, 18 (1), 107–121. doi:10.1029/WR018i001p00107
- Jana, M. and Sar, N., 2016. Modeling of hotspot detection using cluster outlier analysis and Getis-Ord Gi* statistic of educational development in upper-primary level, India. Modeling Earth Systems & Environment, 2 (2), 60. doi:10.1007/s40808-016-0122-x
- Jiang, J.M., et al., 2002. Coherency detection of multiscale significant changes in historic Nile flood levels. Geophysical Research Letters, 29 (8), 112–114. doi:10.1029/2002GL014826
- Kendall, M.G., 1975. Rank correlation methods. Griffin: London.
- Li, H., et al., 2017. Hydrological effects of cropland and climatic changes in arid and semi-arid river basins: a case study from the Yellow River basin, China. Journal of Hydrology, 549, 547–557. doi:10.1016/j.jhydrol.2017.04.024
- Liu, J., et al., 2013. Divergent global precipitation changes induced by natural versus anthropogenic forcing. Nature, 493, 656–659. doi:10.1038/nature11784
- Liu, J.Y., et al., 2017. Contribution of multiple climatic variables and human activities to streamflow changes across China. Journal of Hydrology, 545, 145–162. doi:10.1016/j.jhydrol.2016.12.016
- Liu, W.P., et al., 2009. Influence of climate change on winter wheat cropping system in Shanxi. Journal of Arid Land Resources & Environment, 23 (11), 88–92. (In Chinese).
- Ma, H., et al., 2010. Impact of climate variability and human activity on streamflow decrease in the Miyun reservoir catchment. Journal of Hydrology, 389 (3–4), 317–324. doi:10.1016/j.jhydrol.2010.06.010
- Mann, H.B., 1945. Nonparametric tests against trend. Econometrica, 13, 245–259. doi:10.2307/1907187
- Naz, B.S., et al., 2018. Effects of climate change on streamflow extremes and implications for reservoir inflow in the United States. Journal of Hydrology, 556, 359–370. doi:10.1016/j.jhydrol.2017.11.027
- Ord, J.K. and Getis, A., 2010. Local spatial autocorrelation statistics: distributional issues and an application. Geographical Analysis, 27 (4), 286–306. doi:10.1111/j.1538-4632.1995.tb00912.x
- Peeters, A., et al., 2015. Getis–ord’s hot- and cold-spot statistics as a basis for multivariate spatial clustering of orchard tree data. Computers & Electronics in Agriculture, 111 (C), 140–150. doi:10.1016/j.compag.2014.12.011
- Piao, S.L., et al., 2010. The impacts of climate change on water resources and agriculture in China. Nature, 467, 43–51. doi:10.1038/nature09364
- Poff, N.L., et al., 2007. Homogenization of regional river dynamics by dams and global biodiversity implications. Proceedings of the National Academcy of Sciences, 104, 5732–5737. doi:10.1073/pnas.0609812104
- Qiu, J., et al., 2016. Comparison of temporal trends from multiple soil moisture data sets and precipitation: the implication of irrigation on regional soil moisture trend. International Journal of Applied Earth Observations & Geoinformation, 48 (48), 17–27. doi:10.1016/j.jag.2015.11.012
- Ren, G., 2007. Climate change and China’s water resources. Beijing: Meteorological Press. (in Chinese).
- Richard, P.A. and Brian, J.S., 2008. Atmospheric warming and the amplification of precipitation extremes. Science, 321 (5895), 1481–1484. doi:10.1126/science.1160787
- Saft, M., et al., 2016. Predicting shifts in rainfall‐runoff partitioning during multiyear drought: roles of dry period and catchment characteristics. Water Resources Research, 52, 9290–9305. doi:10.1002/2016WR019525
- Saft, M., et al., 2015. The influence of multiyear drought on the annual rainfall‐runoff relationship: an Australian perspective. Water Resources Research, 51 (4), 2444–2463. doi:10.1002/2014WR015348
- Schiermeier, Q., 2011. Increased flood risk linked to global warming. Nature, 470 (7334), 378–381. doi:10.1038/470316a
- Schilling, K.E., 2005. Relation of baseflow to row crop intensity in Iowa. Agriculture Ecosystems & Environment, 105 (1), 433–438. doi:10.1016/j.agee.2004.02.008
- Schilling, K.E., et al., 2008. Impact of land use and land cover change on the water balance of a large agricultural watershed: historical effects and future directions. Water Resources Research, 44, W00A09. doi:10.1029/2007WR006644
- Shiklomanov, I.A. and Rodda, J.C., 2003. World water resources at the beginning of the 21st century. International hydrology series. Cambridge, UK: Cambridge Univ Press.
- Teklesadik, A.D., et al., 2017. Inter-model comparison of hydrological impacts of climate change on the Upper Blue Nile basin using ensemble of hydrological models and global climate models. Climatic Change, 141, 517–532. doi:10.1007/s10584-017-1913-4
- Thaler, S., Eitzinger, J., and Dubrovsky, M.T.M., 2012. Impacts of climate change and alternative adaptation options on winter wheat yield and water productivity in a dry climate in central Europe. Journal of Agricultural Science, 150 (5), 537–555. doi:10.1017/S0021859612000093
- Turner, S.W.D., et al., 2017. Complex relationship between seasonal streamflow forecast skill and value in reservoir operations. Hydrology and Earth System Sciences, 21, 4841–4859. doi:10.5194/hess-21-4841-2017
- Vaighan, A.A., Talebbeydokhti, N., and Bavani, A.M., 2017. Assessing the impacts of climate and land use change on streamflow, water quality and suspended sediment in the Kor River Basin, Southwest of Iran. Environmental Earth Sciences, 76, 543. doi:10.1007/s12665-017-6880-6
- Viglione, A., et al., 2016. Attribution of regional flood changes based on scaling fingerprints. Water Resources Research, 52 (7), 5322–5340. doi:10.1002/2016WR019036
- Villarini, G., et al., 2015. Projected changes in discharge in an agricultural watershed in Iowa. Journal of the American Water Resources Association, 51 (5), 1361–1371. doi:10.1111/1752-1688.12318
- Villarini, G., et al., 2009. On the stationarity of annual flood peaks in the continental United States during the 20th century. Water Resources Research, 45, W08417. doi:10.1029/2008WR007645
- Villarini, G. and Strong, A., 2014. Roles of climate and agricultural practices in discharge changes in an agricultural watershed in Iowa. Agriculture, Ecosystems and Environment, 188, 204–2011. doi:10.1016/j.agee.2014.02.036
- von Storch, H. and Navarra, A., Eds., 1995. Analysis of climate variability-applications of statistical techniques. New York: Springer-Verlag, 334.
- Wang, G.S., Xia, J., and Chen, J., 2009. Quantification of effects of climate variations and human activities on runoff by a monthly water balance model: a case study of the Chaobai River basin in northern china. Water Resources Research, 45 (7), 206–216. doi:10.1029/2007WR006768
- Wang, Y.Q. and Zhou, L., 2005. Observed trends in extreme precipitation events in China during 1961–2001 and the associated changes in large-scale circulation. Geophysical Research Letters, 32, 1–4. doi:10.1029/2005GL022574
- Wei, L., Hubbart, J.A., and Zhou, H., 2018. Variable streamflow contributions in nested subwatersheds of a US midwestern urban watershed. Water Resources Management, 32, 213–228. doi:10.1007/s11269-017-1804-5
- Wrachien, D.D. and Goli, M.B., 2015. Global warming effects on irrigation development and crop production: a world-wide view. Agricultural Sciences, 06, 734–747. doi:10.4236/as.2015.67071
- Xu, M., et al., 2018. Detection of spatio-temporal variability of air temperature and precipitation based on long-term meteorological station observations over Tianshan Mountains, Central Asia. Atmospheric Research, 203, 141–163. doi:10.1016/j.atmosres.2017.12.007
- Yang, Y.H. and Fei, T., 2009. Abrupt change of runoff and its major driving factors in haihe river catchment, china. Journal of Hydrology, 374 (3), 373–383. doi:10.1016/j.jhydrol.2009.06.040
- Zhang, Q., et al., 2015c. Spatio-temporal behavior of floods and droughts and their impacts on agriculture in China. Global and Planetary Change, 131, 63–72. doi:10.1016/j.gloplacha.2015.05.007
- Zhang, Q., et al., 2015a. Evaluation of flood frequency under non-stationarity resulting from climate indices and reservoir indices in the East River basin, China. Journal of Hydrology, 527, 565–575. doi:10.1016/j.jhydrol.2015.05.029
- Zhang, Q., et al., 2015b. Homogenization of precipitation and flow regimes across China: changing properties, causes and implications. Journal of Hydrology, 530, 462–475. doi:10.1016/j.jhydrol.2015.09.041
- Zhang, Q., et al., 2013. Spatio-temporal relations between temperature and precipitation regimes: implications for temperature-induced changes in the hydrological cycle. Global Planetary Change, 111, 57–76. doi:10.1016/j.gloplacha.2013.08.012
- Zhang, Q., et al., 2014b. Trend, periodicity and abrupt change in streamflow of the East River, the Pearl River basin. Hydrological Processes, 28, 305–314. doi:10.1002/hyp.9576
- Zhang, Q., et al., 2014a. Topography-based spatial patterns of precipitation extremes in the Poyang Lake basin, China: changing properties and causes. Journal of Hydrology, 512, 229–239. doi:10.1016/j.jhydrol.2014.03.010
- Zhang, Q., et al., 2011. Statistical behaviors of precipitation regimes in China and their links with atmospheric circulation 1960–2005. International Journal of Climatology, 31 (11), 1665–1678. doi:10.1002/joc.2193
- Zhang, Y.K. and Schilling, K.E., 2006. Increasing streamflow and base flow in Mississippi River since the 1940s: effect of land use change. Journal of Hydrology, 324 (1), 412–422. doi:10.1016/j.jhydrol.2005.09.033