
 ?Mathematical formulae have been encoded as MathML and are displayed in this HTML version using MathJax in order to improve their display. Uncheck the box to turn MathJax off. This feature requires Javascript. Click on a formula to zoom.
ABSTRACT
Drought events are increasing worldwide. Socio-economic drought is the least investigated type of drought, and is the only type for which water demand is taken into consideration. In this research, socio-economic drought was studied in Lake Mead, USA, using a multivariate standardized water-scarcity index (MSWSI) over the period 1990–2014, combining two water-scarcity indices based on time series of inflow, outflow, reservoir storage, and water demand. The inflow and outflow were determined from streamgage data, and reservoir storage from lake level data; demand was based on water pumped by the Southern Nevada Water Authority. Missing observations in input streamgage data were filled through regression modeling. The results indicate that Lake Mead has been in socio-economic drought since 2000, with the most severe drought occurring between 2006 and 2012, and the highest intensity drought in April–July 2014. The Lake Mead droughts revealed through the MSWSI are consistent with those reported in US Drought Monitor (USDM) products. The temporal behavior of MSWSI provides an insight into the socio-economic effects of droughts not captured by USDM products.
Editor A. Castellarin Associate editor I. Overton
1 Introduction
Recently, California, USA, experienced its worst drought in 200 years, North Korea the worst in 100 years, Brazil in 50 years, and South Africa in 20 years (Agha Kouchak et al. Citation2014, Rice Citation2015). Drought events are increasing all around the world due to two main factors: increasing water demands and changes in precipitation patterns. Drought events reduce the recharging of water storage in freshwater surface lakes, thus reducing the reliability of storage to meet water demands. Because of population growth, as well as expansion of industrial, energy, and agricultural water uses, the demand for water has increased dramatically (Mishra and Singh Citation2010, UNWWAP Citation2012). In addition, global warming has led to an increase in near-surface air temperatures due to increases in carbon dioxide (CO2) and other greenhouse gases, thus reducing the soil moisture. As a result, precipitation patterns have changed, with fewer events, greater rainfall intensity, and a greater number of dry periods in between storms (Sheffield and Wood Citation2011). Freshwater lakes play an important role in supplementing water shortage during dry periods by providing stored water and, subsequently, lake levels drop relatively more rapidly during dry periods. Freshwater lakes play a critical role in reducing the impact of drought on human activities and can be used to assess drought vulnerability.
Drought is a frequently used term with various scientific definitions; each definition, in turn, is categorized as a different type of drought (Mishra and Singh Citation2010, Balint et al. Citation2013). On the whole, a deficit of water relative to normal conditions is called drought (Sheffield and Wood Citation2011, Lloyd-Hughes Citation2014) Droughts may be classified into four categories: meteorological, hydrological, agricultural, and socio-economic; Mishra and Singh (Citation2010) introduced groundwater drought as a fifth type. Meteorological drought refers to a negative deviation from mean precipitation; hydrological drought is a deficit in the supply of surface and subsurface water; agricultural drought refers to a period with declining soil moisture and consequent crop failure; and socio-economic drought is associated with failure of water resources systems to meet water demands (Mishra and Singh Citation2010, Sheffield and Wood Citation2011). Socio-economic drought, the only type of drought for which water demand is considered, is more relevant to impacts on human populations. However, despite its close relation to human activities, socio-economic drought is the least investigated (Arab et al. Citation2010, Mehran et al. Citation2015).
The analysis of temporal variations in water availability and demand can reveal periods of socio-economic drought. Previously, drought periods have been classified into short-term (i.e. typically less than 6 months) and long-term (typically more than 6 months) (NDMC Citation2016).
The southwestern region of the USA, which depends on the Colorado River basin, recently experienced its longest drought in recorded history. Lakes Powell and Mead are the two largest lakes in the Colorado River system and are operated in tandem to ensure uninterrupted water supply to the stakeholder states. As the southern Nevada population primarily depends on Lake Mead for water supply, there has been a concern that the lake level may drop below the pumping depth in the case of a persistent drought. Therefore, the Southern Nevada Water Authority (SNWA) has taken pre-emptive measures by constructing a deeper pumping pipe in the lake. Lake Mead also provides water for the municipal, industrial, agricultural, and environmental demands of Arizona, California, and Mexico, and about 25 million people rely on its water. By volume, Lake Mead is the largest reservoir in the entire USA and has a critical role in the sustainable water supply in the southwest region. Thus, there is a need to understand its behavior in relation to drought events.
Socio-economic drought is more relevant to impacts on the human population. Despite the increasing population trend, the SNWA has adopted effective water conservation practices to lower demand and could have controlled the diversion in a constant range after ~2000. Additionally, the total inflow and outflow from Lake Mead was within a certain range to meet the Colorado River Compact policies. Thus, at this point, the driving force behind the observed socio-economic drought after 2000 is the significant decrease in Lake Mead storage. However, if the population growth continues, water conservation policies may not be sufficient to control the demand within a specific range. Furthermore, climate change is an additional factor in decreasing the Colorado River flow. Therefore, based on the population forecasts and expected subsequent water demand increase, climate change and its reduction of the Colorado River flow, and the lowering trend of Lake Mead water storage, it is likely that a critical situation will arise in southern Nevada in the future in terms of providing water for users.
Generally, assessment of the severity, intensity, duration, and spatial extent of droughts is done by indices, which have not been well developed for socio-economic drought. Typically, a threshold is applied to drought indices to detect and assess the state of drought. Usually, drought thresholds are expressed as the long-term average (Yoo et al. Citation2012), or a percentile value of the historical data (Svoboda et al. Citation2002). All in all, many indices have been developed and Keyantash and Dracup (Citation2002) have reported the most prominent indices for each type of drought evaluated in two regions in Oregon, USA. Nevertheless, socio-economic drought indices are very limited and varying (Arab et al. Citation2010, Mehran et al. Citation2015, Rajsekhar et al. Citation2015). As freshwater lakes serve as a buffer to delay the impact of drought on human systems, their mass balance can be used to develop socio-economic drought indices (Calder et al. Citation1995).
Typically, a drought index should capture the anomalous trends of water supply to help identify periods of shortage. In the last few years, many water-scarcity indices have been developed to take into consideration various facets of scarcity, water use, and supply. Water-scarcity indices measure the status of water resources based on water availability and a fixed human water demand (Brown and Matlock Citation2011). The water stress index provided by Falkenmark and Widstrand (Citation1992) is a widely used water-scarcity measurement. According to their research on arid climate areas, they proposed a threshold of 1700 m3 per capita per year for renewable water resources. Thus, when the water supply goes below the threshold, it indicates that the region is experiencing water stress (Rijsberman Citation2006). Similarly, Veldkamp et al. (Citation2015) used two indicators to quantify water-scarcity conditions, the water crowding index (WCI) and the consumption to availability ratio (CTA). The CTA investigates how much water is consumed relative to the amount of available water over a specific time period (Veldkamp et al. Citation2015). The concept of water consumption to availability has been used in a wide range of regional and global studies (e.g. Rost et al. Citation2008, Wada et al. Citation2011, Hoekstra et al. Citation2012, Falkenmark Citation2013a, Citation2013b, Kiguchi et al. Citation2015, Veldkamp et al. Citation2015). Another index, the water supply stress index (WaSSI) was proposed by McNulty et al. (Citation2007) to assess the relative magnitude of water supply and demand. In most studies, the concept of water supply to demand (similar to CTA) has been used (Vorosmarty Citation2000, Sun et al. Citation2008a, Citation2008b, McNulty et al. Citation2011). Thus, water-scarcity indices that relate supply and demand in a freshwater lake can be used to assess socio-economic drought in that lake. For high-impact water reservoirs, such as Lake Mead, which constantly deal with water supply and water demand, socio-economic drought assessment is necessary to determine the status of drought and water scarcity.
Indices used to study droughts are mostly developed using stochastic approaches and provide drought information in a probabilistic sense. This is reasonable, as drought is assessed using statistical techniques by estimating deviations from historical average behavior. Generally, it is difficult to capture multiple facets of drought behavior with a single index. Thus, techniques to stochastically combine indices that preserve underlying probability distributions have been investigated by several researchers (e.g. Yue et al. Citation1999, Shiau Citation2006, Mirabbasi et al. Citation2012, Hao and AghaKouchak Citation2013, Hao et al. Citation2014). In particular, Mehran et al. (Citation2015) provided a hybrid framework to study socio-economic drought in lakes using a multivariate index. This index captures the natural variability that governs supply, as well as a human factor that governs demand, and this approach was adopted to develop a multivariate water-scarcity index of Lake Mead.
In this research, we analyzed socio-economic drought of Lake Mead by developing a multivariate standardized water-scarcity index (MSWSI) that combines CTA and WaSSI. Historical monthly CTA and WaSSI values were calculated using inflow and outflow data from streamgages; reservoir storage from lake level data; and demand pumping data. The CTA and WaSSI indices were used to estimate empirical cumulative probability distributions that were further standardized to calculate the MSWSI, which was then used to assess socio-economic drought conditions in Lake Mead over the period 1990–2014. The socio-economic drought results were compared with the US Drought Monitor products for validation.
This paper is organized as follows. Section 2 provides a literature review of drought monitoring and assessment; Section 3 describes the study area, followed by Section 4, which describes the sources of data and data preparation methods. The methodology is described in Section 5, with the results and discussion in Section 6, and a summary and conclusions in Section 7.
2 Literature review
Drought is a multifaceted phenomenon as it can affect many parts of the environment and communities, and is often grouped according to economic, environmental, and social impacts (NDMC Citation2016). During drought, food supplies for people, plants, and animals can shrink, and habitats can be irreparably damaged; thus drought is considered to be among the world’s costliest natural disasters. According to Keyantash and Dracup (Citation2002), droughts are “causing an average [US]$6–$8 billion in global damages annually and collectively affecting more people than any other form of natural disaster.” Therefore, drought is differentiated from other natural disasters by its diverse impacts, spatial extent, intensity, magnitude, and duration (Svoboda et al. Citation2002). Droughts produce a complex and extensive set of adverse effects, and it is challenging to accurately predict the onset and duration of a drought (Mo Citation2011, Yuan and Wood Citation2013). Thus, multifaceted maps and statistics are needed to characterize a drought fully in order to decrease damage to the environment, society, and the economy (Beran and Rodier Citation1985).
Socio-economic drought refers to the relationship between the water supply and demand, and various researchers have studied its behavior. Mehran et al. (Citation2015) assessed socio-economic drought by integrating a water-demand reliability indicator and a water-storage resilience indicator. Hashimoto et al. (Citation1982) defined “reliability” as the probability of a system to fail and “resiliency” as how quickly the system can recover from failure to a satisfactory condition. The approach includes relationships among inflow, demand, and storage in a reservoir such as a freshwater lake. The two indicators are thus combined to create a multivariate statistical framework for drought vulnerability studies, where vulnerability is defined as how severe the consequences of failure may be (Hashimoto et al. Citation1982). Rossi et al. (Citation2005) presented an application of multi-criteria decision analysis (MCDA) of drought mitigation measures based on social, environmental, and economic criteria.
In order to evaluate drought severity, a threshold for a drought indicator is crucial, and water demand needs to be considered in that context. Currently, most of the studies focus on a constant threshold level. The US Drought Monitor (USDM) classifies drought severity associated with its probability of occurrence expressed as a percentile, based on the constant threshold level for the major five key indicators (Svoboda et al. Citation2002). In the case of socio-economic drought, water demand in each time step is an essential factor in threshold determination. Water demand should be considered in a drought threshold level because the volume of water required to end an extreme drought condition in two cities with identical climate conditions but different populations is not the same. Clearly, a more populated city, having higher water consumption, would have greater water demand to overcome any shortage (drought condition). Thus, water demand, which is primarily driven by population in a socio-economic context, is important to assess socio-economic drought.
The USDM maps indicate drought status from three points of view: meteorological, agricultural, and hydrological. The USDM data are produced jointly by the National Drought Mitigation Center (NDMC) at the University of Nebraska-Lincoln, the US Department of Agriculture, and the National Oceanic and Atmospheric Administration (NOAA). The USDM uses a composite index based on five key indicators, as follows:
The Palmer drought severity index (PDSI) for meteorological drought;
The CPC soil moisture model for agricultural drought;
Weekly streamflow from the US Geological Survey (USGS) for hydrological drought;
Standard precipitation index (SPI) for meteorological drought; and
Objective drought indicator blends, which are combinations of all drought types; this final drought category tends to be based on the results from the majority of the indicators (USDM Citation2016).
A review of previous studies indicates there is a demand for more comprehensive drought indicators. It has been shown that socio-economic drought has been neglected in the majority of drought studies. As populations grow, more attention needs to be given to the role of increasing water demand when monitoring for drought. Therefore, a socio-economic drought index that clearly reveals the relationship between water supply, population, and water demand would be useful to minimize drought damages to the environment, society, and the economy.
3 Study area
Lake Mead is the largest reservoir in the USA, by volume, and was formed after the construction of the Hoover Dam in the 1930s (Holdren and Turner Citation2010). Lake Mead consists of four connected basins: Gregg, Temple, Virgin, and Boulder (). Approximately 97% of the inflow to Lake Mead is provided by the Colorado River. In addition, three smaller tributaries feed Lake Mead: the Las Vegas Wash, the Muddy River, and the Virgin River. The Las Vegas Wash, which enters at the west end of Lake Mead, includes runoff from the Las Vegas metropolitan area, from nonpoint surface discharge and groundwater discharge sources, as well as from treated effluent from municipal wastewater treatment facilities of the City of Las Vegas, the City of Henderson, and Clark County (Venkatesan et al. Citation2011).
Figure 1. Location, features, and tributaries of Lake Mead
About 25 million people rely on water from Lake Mead for municipal, industrial, and irrigation purposes. In Nevada, the municipal water demand of Las Vegas, Henderson, North Las Vegas, and Boulder City is supplied from Lake Mead. Additionally, Lake Mead is the major source for downstream users. As stipulated in 1922 by the Colorado River Compact, discharges through the Hoover Dam are released to the Colorado River as needed in order to meet water deliveries to Nevada, Arizona, California, and Mexico (Hundley Citation2009). Nevada’s share of water from the Colorado River is withdrawn directly from Lake Mead, as well as from additional diversions downstream of the Hoover Dam by the SNWA.
Lake Mead and Lake Powell are the most important water reservoirs of the Colorado River Basin, storing 85% of the total water of the basin. They are operated as a system to provide users with a reliable supply of water. Even though Lake Mead and Lake Powell operate in tandem and ~97% of the inflow to Lake Mead releases from Lake Powell through the Colorado River, Lake Mead is not severely affected by drought in the Upper Basin reservoirs (Harding et al. Citation1995, Sangoyomi and Harding Citation1995). The reason for this is the three main operating criteria, which stipulate that Lake Powell has to release 8.23 million acre-feet per year (MAFY) to the Lower Basins and Mexico according to the Law of the River. The second operational strategy is the equalization of releases between Lake Powell and Lake Mead. Thus, as long as Lake Powell can release water into the Colorado River, Lake Mead and the other Lower Basin reservoirs would be unaffected by the drought in Lake Powell. In other words, operation policies are the factors that determine the inflow and outflow to Lake Mead that can influence socio-economic drought. Several studies on the operation of water resources of the Colorado River under various conditions of water shortage indicate the importance of Lake Mead and Lake Powell in the southwestern USA (Harding et al. Citation1995, Sangoyomi and Harding Citation1995, Meko et al. Citation2007, Barnett and Pierce Citation2008, Forsythe et al. Citation2012, Myers Citation2013).
4 Data preparation
The data used, including the sources and type of data, are described here, followed by an explanation of the method used to fill gaps due to missing data. Finally, a short discussion is provided about data trends.
In order to assess the status of socio-economic drought in Lake Mead, historical monthly data including water inflow, outflow, storage, and water demand were used. These data were collected for gaging stations provided by the USGS National Water Information System and the US Bureau of Reclamation, as shown in and described in . Note that Station 9 provides lake surface elevation that is converted to storage using the lake’s elevation–storage relationship. The monthly water levels and total monthly diversion were collected from the reports and webpages of the US Bureau of Reclamation.Footnote1
Table 1. USGS gaging stations at Lake Mead. Refer to for station numbers. Period of record is in the form mm/yyyy. n.c.: not continuous
As seen in , four stations (2, 4, 6, and 9) at Lake Mead have data gaps in the 1990–2014 period of study. Data are missing in the inflow at Station 2 from 1990 to 2002, at Station 4 from 1990 to 2006, and Station 6 has sporadic discontinuities. Fortunately, Station 1 on the Colorado River has no gaps, since ~97% of the inflow comes through this gage. The remaining 3% contribution comes through stations 2 (Las Vegas Wash), 4 (Virgin River), and 6 (Muddy River), which have data gaps. These gaps were filled using linear-regression analysis with the upstream stations on each tributary (3, 5, and 7, respectively) where the data have no gaps. It is expected that the downstream gages mimic the upstream gages reasonably well in a statistical sense. Moreover, the fraction of missing data is small compared to the available data used to develop the regression model. Thus, the regression model is also expected to reasonably represent the relationship between downstream and upstream gages. The three regression fits are plotted in , where dependent variables (y-axis) correspond to the inflows into Lake Mead from Las Vegas Wash, the Muddy River, and the Virgin River, while independent variables (x-axis) correspond to streamflow at the corresponding upstream gages.
Figure 2. USGS measurements of flow rate of the Las Vegas Wash, the Muddy River, and the Virgin River at Lake Mead stations versus upstream stations for each tributary. A linear regression line was used to estimate missing data
presents the coefficients for the regression model ( determined using least-squares estimation. The relevant p values and coefficient of determination (R2) are listed to assess the accuracy of the regression model. The p values are small, indicating statistically significant results of the regression model fit. However, the R2 values reveal a mixed accuracy of the result. For the Muddy and Virgin rivers, R2 can be acceptable from a hydrological point of view, but the Las Vegas Wash R2 is quite low. This is consistent with the high dispersion of data points used to develop the regression model for Las Vegas Wash, as shown in . Since the contribution of Las Vegas Wash and Muddy River to Lake Mead inflow is ~1%, we used these regression models with skepticism. Nevertheless, the comparison of time series shows high covariance between the upstream stations with available data and lake stations with missing data. As shown later, the final lake drought analysis matched reasonably well with the expected information about Lake Mead.
Table 2. Coefficients of the best-fit regression line
The regression models were used to estimate missing data points for each tributary, and shows an example of reconstructing missing discharge data for Station 6 on the Muddy River using the measured discharge at Stations 6 and 7. The available discharge values are used in regression modeling to estimate unknown data at Station 6. Similar plots were prepared for Las Vegas Wash and the Virgin River (not shown).
Figure 3. Muddy River discharge at Lake Mead (dashed line), recorded data from the upstream station (solid line), and estimated discharge for missing data at Lake Mead (dotted line)
With data gaps filled, the total inflow into Lake Mead from all tributaries was estimated and compared to the outflow. illustrates the monthly mean of total inflow and outflow to Lake Mead for the period 1990–2014. It is noted that the total inflow includes the water released from the Colorado River, the Muddy River, the Las Vegas Wash, and the Virgin River, whereas the total outflow includes the water released to the Colorado River and diverted by the SNWA. The Colorado River has the largest effect on lake storage, as 96.5% of the inflow and 96.5% of the outflow goes through it. The remaining influence on lake storage comes from the SNWA diversion of Lake Mead and inflows from the Las Vegas Wash, Virgin River, and Muddy River. The overall influence on storage varies over the study period. shows that, besides sporadic wet years, lake outflow exceeded inflow (i.e. in most years in the period 2000–2014), thus resulting in a gradual lowering of lake level.
Figure 4. Water inflows and outflows for Lake Mead
displays the annual population of Clark County and the monthly SNWA diversions at Lake Mead for the period 1990–2014. The total diversion was calculated by summation of the intake by various sectors, including the Robert B. Griffith Project, the Boulder Canyon Project Diversion, the Lake Mead National Recreation Area, Basic Water Company (Henderson, NV), the City of Henderson, the Nevada Department of Fish and Game, and Pacific Coast Building Products (Las Vegas, NV). According to , the Lake Mead diversion has increased from 1990 to approximately 2000 with an increase in population from 1990 to 2014. Typically, the highest diversions occur in summer (July–August) and lows occur in winter (December–February). Guided by the SNWA Water Resource Plan, and supported by community involvement to help early drought response, water use per capita in Las Vegas Valley dropped significantly between 2002 and 2014: “In contrast to voluntary drought response efforts, drying pools and landscapes at foreclosed properties provided strong visual cues that water use patterns had also changed as a result of economic pressures” (SNWA Citation2015). Thus, despite the increasing population trend, this area has adopted effective water conservation practices to lower demand using conservation tools such as education, incentives, regulation, and water pricing.
Figure 5. Total monthly diversion at Lake Mead from 1990 to 2015
The storage time series was estimated using the elevation–storage curve of Lake Mead. shows the water elevation for Lake Mead, as well as water storage from 1990 to 2015. Between 2000 and 2014, the water-surface elevation in Lake Mead declined by more than 140 ft (42.7 m), which was the record lowest level to date. During this period, most of the years show higher outflow than inflow into the lake (see ), as outflow was augmented by lowering lake storage. According to the SNWA (2015), the minimum water-surface elevation at which the Hoover Dam can release water downstream is 895 ft (272.8 m). In order to address the unprecedented drought conditions, and also provide long-term protection of Lake Mead, the SNWA withdraws water from Lake Mead from three intakes at three different elevations: Intake No. 1 at 1050 ft (320 m); Intake No. 2 at 1000 ft (305 m); and Intake No. 3 at an elevation of 860 ft (262 m), which is 35 ft (10.7 m) below the minimum elevation that the Hoover Dam can release water downstream (SNWA 2015). Two potential overriding issues related to water supply and demand are a decrease in the Colorado River supplies and a change in the long-term water demand. A decrease in water-surface elevation in Lake Mead on the one hand, and an increase in population in the region near Lake Mead on the other, has led to a critical situation for the SNWA in terms of planning for water conservation. This indicates the importance of socio-economic drought assessment in Lake Mead.
Figure 6. Level of water elevation and water storage volume of Lake Mead
5 Methodology
In this section we discuss the methodology used to assess socio-economic drought in Lake Mead. First, the water-scarcity indices used herein are explained. Second, we discuss the method used to standardize the water-scarcity indices and the technique to combine them. Finally, the multivariate standardized water-scarcity index (MSWSI) is defined as an index to assess socio-economic drought at Lake Mead.
5.1 Water-scarcity indices
Water scarcity refers to the imbalance between water availability and the needs for water over a specific time period and for a certain region (Van Beek et al. Citation2011). The approach to study socio-economic drought in Lake Mead relied on two individual water-scarcity indicators: CTA and WaSSI. The CTA, which indicates the relationship between water demand and available water in a reservoir (Falkenmark Citation2013a, Veldkamp et al. Citation2015), was calculated by:
where Ct is the total estimated water demand of Lake Mead in month t and At is the corresponding available water in month t. The consumption Ct includes SNWA diversions at Lake Mead and the water released to the Colorado River for water demands downstream. It is noted that, while Ct represents the water demand of Lake Mead, this is not necessarily equal to all the water demands of the people in Nevada, Arizona, California, and Mexico. This is because the end users of Lake Mead have mixed portfolios of water resources. The availability, At, in EquationEquation (1)(1)
(1) corresponds to the Lake Mead storage in month t, which was derived as follows:
where St is the reservoir storage in month t, and Omin is the minimum operational storage of 2.68 × 1011 ft3 (7.6 × 10⁹ m3) at 895 ft (272.8 m) surface elevation. If reservoir storage goes below minimum operational storage, no water is available for end users. There are other factors that can influence availability. Evaporation and infiltration would reduce reservoir storage, whereas precipitation on the lake would increase storage. The long-term average infiltration of Lake Mead is less than 1% of the evaporation (Barnett and Pierce Citation2008). The annual precipitation is ~4 inches (10 cm), whereas the evaporation rates at Lake Mead have been reported to vary between ~3 inches (7.6 cm) in winter to ~10 inches (25.4 cm) in summer (USDM Citation2006). Due to their small contributions relative to changes in the lake storage, and in order to simplify the equation, losses due to evaporation and infiltration, and gains due to precipitation are not considered in EquationEquation (2)(2)
(2) .
The other index considered in this study, WaSSI, indicates the relationship between inflow and demand (consumption) of the reservoir (Sun et al. Citation2008a). WaSSI in month t was calculated by:
where Qt is the monthly inflow to the reservoir in month t, and is the summation of inflows from the Colorado River, the Las Vegas Wash, the Muddy River, and the Virgin River.
5.2 Multivariate standardized water-scarcity index (MSWSI)
The MSWSI represents a combined effect of CTA and WaSSI, and is created by combining their empirical marginal distributions into a standardized index through empirical estimation of joint probabilities. For this purpose, we adopted an approach developed by Mehran et al. (Citation2015) in which metrics of reliability and resilience are combined to create a hybrid index called the multivariate standardized reliability and resilience index (MSRRI). In this approach, reliability is based on natural variability (inflow demand reliability) which governs inflow, and resilience is based on human demand which governs outflow (water storage resilience) (Hao et al. Citation2014, Farahmand and AghaKouchak Citation2015, Mehran et al. Citation2015). This study uses a similar approach by combining simple ratios of CTA and WaSSI and demonstrates their ability to detect socio-economic drought in Lake Mead. First, the empirical cumulative distributions of CTA and WaSSI were determined from data and converted to standardized indices using a standard normal distribution function. The standardized indices were then combined to estimate joint cumulative empirical probability, which was converted to MSWSI using a standard normal distribution function. Thus, MSWSI provides a single index to assess socio-economic drought by including monthly demand in CTA and WaSSI ratios. The MSWSI is expected to be on the conservative side, i.e. it will result in high values only if CTA and WaSSI are simultaneously high.
6 Results and discussion
The results of standardized water-scarcity indices are presented here, followed by the results of MSWSI for Lake Mead over the period 1990–2014. First, the CTA and the WaSSI standardized index for Lake Mead are compared (). Second, monthly MSWSI values for 1990–2014 are presented and discussed. Finally, US drought products are compared to the estimated socio-economic drought in Lake Mead.
Figure 7. Standardized CTA and WaSSI (1990–2014) for Lake Mead
displays standardized indices (SI) for CTA and WaSSI, where a positive value means that the water condition was satisfied and vice versa. Both indices are seen to follow seasonal trends, and the SI for CTA gradually decreases between 2002 and 2011, mainly due to a significant decrease in Lake Mead storage (see and ). The CTS index shows some recovery after 2011, although it still remains below normal. In contrast, the SI for WaSSI shows a fluctuation about zero. Seasonal trends show highs in December and January, and lows in May–July. This suggests that Lake Mead is more capable of supplying water during the winter than the summer.
Figure 8. Four possible categories, using the standardized CTA index versus the standardized WaSSI, to predict whether the demand for water can be satisfied
In order to evaluate the interplay of the two SI values, a scatter plot is shown in in which four quadrants are used to divide the SI values into four groups. If both indices are positive (quadrant 1), storage and inflow can be expected to satisfy the demand, whereas if both are negative (quadrant 4), the demand cannot be satisfied as storage and inflow are below normal. More interesting cases occur where the two indices have opposing signs: in quadrant 2, storage is above normal but inflow to reservoir cannot satisfy the demand, thus storage is projected to decrease; and in quadrant 3, water storage in the reservoir is below normal, but the inflow can satisfy demand as well as feed the storage, thus storage is projected to increase. Therefore, it is reasonable to define a socio-economic drought in quadrant 4 but in quadrants 2 and 3 there is a higher risk of facing socio-economic drought.
By design, the multivariate index MSWSI is expected to capture effects of CTA and WaSSI, especially to simplify scenarios of falling in quadrants 2 and 3. shows the time series of estimated MSWSI, where negative values indicate socio-economic drought. The time series of CTA and WaSSI standardized indices are also displayed in the background for comparison. reveals that Lake Mead has been mostly in drought since the beginning of the 21st century, with a fluctuating behavior from seasonal effects. It shows that MSWSI is a more comprehensive index compared to CTA and WaSSI, as it captures periods of low inflow relative to demand, as well as periods of low storage relative to demand. The highest severity and the longest duration drought occurred in the period 2008–2012 and a more recent episode of April–July 2014 is also seen, with a MSWSI of −2.9.
The negative values of MSWSI after 2000 were due mostly to the drastic decrease of the CTA standardized index. However, CTA did not indicate water scarcity until 2003. It is based on the relationship between demand and reservoir storage, thus, by itself, it is not a comprehensive index to determine socio-economic drought. Even though it was positive for all the time steps before 2003, and became negative after that, MSWSI oscillated around zero until 2000 and then became negative. However, with SI for CTA and WaSSI combined, MSWSI reveals socio-economic drought beginning in 2000 and not in 2003. From 2000 to 2003, the demand was still satisfied by the storage; however, the inflow to the storage was not sufficient. Thus, MSWSI is positive if the demand is satisfied by both inflow and storage. This result is consistent with the comparison of socio-economic and hydrological drought at Trinity Lake using MSRRI (Mehran et al. Citation2015).
The reason that WaSSI shows seasonal trends and does not show an overall trend is because of the Law of the River: Lake Powell is to make a minimum release of 8.23 MAFY to Lake Mead through the Colorado River, and Lake Mead is to release the Lower Basin diversions along with the delivery obligation to Mexico. Thus, the inflow and the outflow to Lake Mead through the Colorado River have been in a certain range in the period of study, and that is the reason why WaSSI does not show an overall trend.
The drastic decrease in the SI for CTA, which is the driving force behind the observed socio-economic drought after 2000, is the significant decrease in Lake Mead storage. The SNWA has been successful in achieving its water conservation goals and is currently ahead of schedule (199 gallons per capita per day by 2035). Nevertheless, because of the increase in population and subsequent increase in water demand, the decrease in the total diversion from Lake Mead is not tangible. According to , despite annual population growth from 1990 to 2015, the SNWA conservation policies have been able to control the total diversion after ~2000 (SNWA 2015). However, population growth continues, and Nevada’s share of water from Lake Mead is limited; therefore, SNWA needs to be prepared for severe socio-economic droughts and assess other water resource options to ensure that future resources are available to meet future demands.
In order to compare socio-economic drought in Lake Mead with other types of drought in the area, maps of the US Drought Monitor for the Lake Mead area in the month of August in 2000, 2003, 2007, 2010, and 2013 were compared (shown as “comparison points” in ). shows the USDM maps, which categorize the drought intensity into five clusters. According to USDM, all the maps indicate that the Lake Mead area was under drought conditions, with the lowest intensity in August 2010 (abnormally dry) and the highest intensity in August 2003 (extreme drought).
Figure 9. MSWSI for Lake Mead (1990–2014)
Figure 10. US Drought Monitor Maps in the Lake Mead area (August 2000, 2003, 2007, 2010, and 2013)
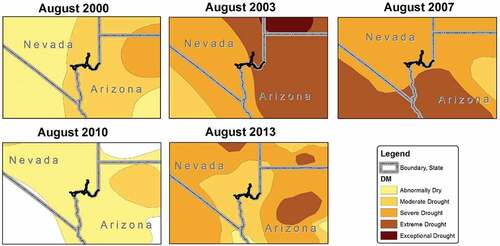
The USDM products indicate drought conditions mostly from metrological, agricultural, and hydrological viewpoints. However, MSWSI indicates a socio-economic drought with consumption included and combined using a multivariate approach. Although both methods signify the occurrence of drought after 2000 in the Lake Mead area, the estimated drought intensities are not similar. Estimated drought by the MSWSI index shows that drought severity decreased from August 2000 to August 2003. Additionally, the most severe drought experienced at Lake Mead occurred in the period 2006–2012. By contrast, the USDM maps indicate that the driest and the wettest periods were 2003 and 2010, respectively.
Indeed, it is not fully expected that USDM maps and the results from MSWSI follow the same pattern. Drought estimated by USDM is affected mainly by variations in meteorological elements, such as precipitation, soil moisture, and streamflow. In contrast, MSWSI is affected by inflow to the lake, outflow from the lake, lake storage, and demand (diversion). Various sources usually contribute to lakes in general, including various mountains in the upstream (inflow), for which the flow does not necessarily depend on the weather in the lake’s immediate area. According to the Colorado River Compact, the outflow (discharge from Lake Mead to the Colorado River) and withdrawal from Lake Mead (Nevada’s share of water) are almost constant every year, regardless of climatic conditions. Thus, the major effect of weather on socio-economic drought in Lake Mead occurs with the variation in storage volume caused by the change in precipitation on the lake’s surface, as well as evaporation from the lake. As it turns out, socio-economic drought at Lake Mead is not highly dependent on climatic conditions. In the case of high evaporation rates during summer months (i.e. during relatively hotter summers), the impact would be seen as a reduction in CTA values.
In order to address the possible issues of the method used in this study, the following points need to be taken into consideration. First, reservoir sedimentation can be considered as a key issue in sustainable water supply management (Fan and Morris Citation1992). Since sediment accumulation is an inevitable process in all reservoirs, it can have an effect on the elevation–storage curve. In general, every year, the water volume in a reservoir is getting less than it appears based on its water elevation level, because sediment reduces the reservoir capacity by accumulating at the bottom of the reservoir. Note that the effective storage calculated in this study was from 895 ft (272.8 m) and above, so that the influence of sedimentation (mostly in the lower reservoir) should be somewhat reduced. In other words, the influence of accumulated sedimentation in effective storage below 895 ft (272.8 m) is already considered. Second, because water demand is a key factor in socio-economic drought assessment, the quality of water in the reservoir is a crucial issue. Regardless of reservoir storage, if the quality of water is very low, its input and output are no longer is useful, and the treatment process becomes complicated and expensive. Finally, when calculating WaSSI, the relationship between inflow and demand to the reservoir is estimated. Not surprisingly, the reservoir can have other inputs and outputs that might vary seasonally. Evaporation from the surface of the reservoir, infiltration from the bottom of the reservoir, runoff, and other discharges from various sources are inputs and outputs that were not taken into consideration in the methods used, and could be the source of errors.
7 Conclusion
Solving critical problems such as limited water resources and providing sustainable water management approaches to support water needs are among the highest State priorities. According to Barsugli et al. (Citation2009), there is a 50% chance that Lake Mead will go dry between 2035 and 2047, with the assumption that inflow decreases by 20% due to climate change over 50 years of simulation. As the population grows, more attention needs to be given to the role of increasing water demand when monitoring for drought.
In this paper, socio-economic drought was studied in Lake Mead for the period from 1990 to 2014. Two individual water-scarcity indicators, CTA and WaSSI, were combined to create MSWSI. The CTA relates water demand to reservoir storage; therefore, less demand and more storage can lead to a lower probability of a system to fail. In contrast, WaSSI relates water inflow and water demand; thus, less demand and more inflow increase the chance that the system quickly recovers from failure to a satisfactory condition. As a result, MSWSI was used in this study as a socio-economic drought index in Lake Mead, as this indicator represents the ability of a water resources system to meet water demands. The analysis reveals that MSWSI is a more comprehensive index compared to CTA and WaSSI. The MSWSI is comparable to the MSRRI (Mehran et al. Citation2015) and captures periods of low inflow relative to demand, as well as periods of low storage relative to demand.
This research confirms that Lake Mead has been in socio-economic drought since 2000. Water elevation decrease in Lake Mead on one side and increased diversion due to population increase on the other, are what caused the situation. In addition, the highest intensity of socio-economic drought at Lake Mead occurred from April to July 2014, and the highest severity and the longest duration occurred from 2006 to 2012. The maximum value of MSWSI occurred in February 1993, when both WaSSI and CTA were maximum. The MSWSI indicates that there has been a socio-economic drought since January 2000.
A comparison with USDM maps reveals that MSWSI provides new information. The USDM products are affected mainly by variations in meteorological elements, such as precipitation, soil moisture, and streamflow. Although inflow is dependent on precipitation and climate, this is not just in the vicinity of the lake used in the USDM index. The MSWSI captures the socio-economic dimension especially due to the inclusion of demand (diversion) in addition to inflow to the lake and lake storage. Drought is a multifaceted phenomenon, and it is necessary to characterize drought fully in order to decrease damage to the environment. Ideally, the MSWSI should be used along with USDM maps and other drought indices to ensure a thorough understanding of conditions regarding water scarcity.
Water management agencies, such as the US Bureau of Reclamation – which are responsible for managing, developing, and protecting regional water – could apply the method used in this study to assess socio-economic drought for other reservoirs in the Colorado River system. As long as inflow, outflow, water storage, and water demand of the system are available, the MSWSI can be determined.
Acknowledgements
All the data used in this study were downloaded from the US Geological Survey’s National Water Information System Web Interface (http://waterdata.usgs.gov/nwis/sw).
Disclosure statement
No potential conflict of interest was reported by the authors.
Additional information
Funding
Notes
References
- Agha Kouchak, A., et al., 2014. Global warming and changes in risk of concurrent climate extremes: insights from the 2014 California drought. Geophysical Research Letters, 41 (24), 8847–8852. doi:10.1002/2014GL062308
- Arab, D., et al., 2010. Developing an integrated drought monitoring system based on socio-economic drought in a transboundary River Basin: a case study. In: World environmental and water resources congress 2010@sChallenges of change. American Society of Civil Engineers, 2754–2761. doi:10.1061/41114(371)284
- Balint, Z., et al., 2013. Kenya: A natural outlook – geo-Environmental resources and hazards. Elsevier Science: Developments in Earth Surface Processes volume 16. Available from: https://www.elsevier.com/books/kenya-a-natural-outlook/paron/978-0-444-59559-1
- Barnett, T.P. and Pierce, D.W., 2008. When will Lake Mead go dry? Water Resources Research, 44 (3). doi:10.1029/2007WR006704
- Barsugli, J.J., et al., 2009. Comment on “When will Lake Mead go dry?” by T. P. Barnett and D. W. Pierce. Water Resources Research, 45 (9). doi:10.1029/2008WR007627
- Beran, M.A. and Rodier, J.A., 1985. Hydrological aspects of drought, a contribution to the international hydrological programme. Vol. 39. Paris: Unesco, p. 149.
- Brown, A. and Matlock, M.D., 2011. A review of water scarcity indices and methodologies, White Paper, 106. The sustainability consortium [Online]. Available from: https://www.sustainabilityconsortium.org/downloads/a-review-of-water-scarcity-indices-and-methodologies/ [Accessed 6 March 2019].
- Calder, I.R., et al., 1995. The impact of land use change on water resources in sub-Saharan Africa: a modelling study of Lake Malawi. Journal of Hydrology, 170 (1–4), 123–135. doi:10.1016/0022-1694(94)02679-6
- Falkenmark, M., 2013a. Growing water scarcity in agriculture: future challenge to global water security. Philosophical Transactions of the Royal Society, 371 (2002), 20120410. doi:10.1098/rsta.2012.0410
- Falkenmark, M., 2013b. Water security: principles, perspectives and practices. London: Taylor & Francis.
- Falkenmark, M. and Widstrand, C., 1992. Population and water resources: a delicate balance. Population Bulletin, 47 (3), 1.
- Fan, J.H. and Morris, G.L., 1992. Reservoir sedimentation - 1. Delta and density-current deposits. Journal of Hydraulic Engineering, 118 (3), 354–369. doi:10.1061/(ASCE)0733-9429(1992)118:3(354)
- Farahmand, A. and AghaKouchak, A., 2015. A generalized framework for deriving nonparametric standardized drought indicators. Advances in Water Resources, 76, 140–145. doi:10.1016/j.advwatres.2014.11.012
- Forsythe, K.W., et al., 2012. Visualization of Lake Mead surface area changes from 1972 to 2009. ISPRS International Journal of Geo-Information, 1, 108–119. doi:10.3390/ijgi1020108
- Hao, Z., et al., 2014. Global integrated drought monitoring and prediction system. Scientific Data, 1, 1–10. doi:10.1038/sdata.2014.1
- Hao, Z. and AghaKouchak, A., 2013. Multivariate standardized drought index: a parametric multi-index model. Advances in Water Resources, 57, 12–18. doi:10.1016/j.advwatres.2013.03.009
- Harding, B.L., Sangoyomi, T.B., and Payton, E.A., 1995. Impacts of a severe sustained drought on Colorado River water resources. JAWRA Journal of the American Water Resources Association, 31 (5), 815–824. doi:10.1111/j.1752-1688.1995.tb03403.x
- Hashimoto, T., Stedinger, J.R., and Loucks, D.P., 1982. Reliability, resiliency, and vulnerability criteria for water resource system performance evaluation. Water Resources Research, 18 (1), 14. doi:10.1029/WR018i001p00014
- Hoekstra, A.Y., et al., 2012. Global monthly water scarcity: blue water footprints versus blue water availability. PLoS One, 7 (2), e32688. doi:10.1371/journal.pone.0032688
- Holdren, G.C. and Turner, K., 2010. Characteristics of Lake Mead, Arizona-Nevada. Lake and Reservoir Management, 26 (4), 230–239. doi:10.1080/07438141.2010.540699
- Hundley, N., 2009. Water and the West: the Colorado River compact and the politics of water in the American West. Oakland, CA: University of California Press. ISBN-13: 978-0520260115.
- Keyantash, J. and Dracup, J.A., 2002. The quantification of drought: an evaluation of drought indices. Bulletin of the American Meteorological Society, 83 (8), 1167–1180. doi:10.1175/1520-0477-83.8.1167
- Kiguchi, M., et al., 2015. Re-evaluation of future water stress due to socio-economic and climate factors under a warming climate. Hydrological Sciences Journal, 60 (1), 14–29. doi:10.1080/02626667.2014.888067
- Lloyd-Hughes, B., 2014. The impracticality of a universal drought definition. Theoretical and Applied Climatology, 117 (3–4), 607–611. doi:10.1007/s00704-013-1025-7
- McNulty, S.G., et al., 2007. Change in the Southern US water demand and supply over the next forty years. In: Wetland and water resource modeling and assessment: A watershed perspective. Boca Raton, FL: CRC Press, 43–77.
- McNulty, S.G., et al., 2011. Robbing Peter to Pay Paul: tradeoffs between ecosystem carbon sequestration and water yield. In: Proceeding of the Environmental Water Resources Institute Meeting, 103–114. doi:10.1061/41143(394)10
- Mehran, A., Mazdiyasni, O., and AghaKouchak, A., 2015. A hybrid framework for assessing socio-economic drought: linking climate variability, local resilience, and demand. Journal of Geophysical Research: Atmospheres, 120 (15), 7520–7533. doi:10.1002/2015JD023147
- Meko, D.M., et al., 2007. Medieval drought in the upper Colorado River Basin. Geophysical Research Letters, 34 (10), L10705. doi:10.1029/2007GL029988
- Mirabbasi, R., Fakheri-Fard, A., and Dinpashoh, Y., 2012. Bivariate drought frequency analysis using the copula method. Theoretical and Applied Climatology, 108 (1–2), 191–206. doi:10.1007/s00704-011-0524-7
- Mishra, A.K. and Singh, V.P., 2010. A review of drought concepts. Journal of Hydrology, 391 (1–2), 202–216. doi:10.1016/j.jhydrol.2010.07.012
- Mo, K.C., 2011. Drought onset and recovery over the United States. Journal of Geophysical Research: Atmospheres, 116 (20). doi:10.1029/2011JD016168
- Myers, T., 2013. Loss rates from Lake Powell and their impact on management of the Colorado River. JAWRA Journal of the American Water Resources Association, 49 (5), n/a-n/a. doi:10.1111/jawr.12081
- NDMC (National Drought Mitigation Center), 2016. Types of drought impacts [Online]. Available from: https://drought.unl.edu/Education/DroughtforKids/DroughtEffects.aspx [Accessed 5 March 2019].
- Rajsekhar, D., Singh, V.P., and Mishra, A.K., 2015. Integrated drought causality, hazard, and vulnerability assessment for future socio-economic scenarios: an information theory perspective. Journal of Geophysical Research: Atmospheres, 120 (13), 6346–6378. doi:10.1002/2014JD022670
- Rice, D., 2015. On four continents, historic droughts wreak havoc [Online]. Available from: http://www.usatoday.com/story/news/world/2015/07/24/historic-droughts-wreak-havoc-usa-brazil-n-korea/30513289/ [Accessed 6 March 2019].
- Rijsberman, F.R., 2006. Water scarcity: fact or fiction? Agricultural Water Management, 80 (1–3), 5–22. doi:10.1016/j.agwat.2005.07.001
- Rossi, G., Cancelliere, A., and Giuliano, G., 2005. Case study: multicriteria assessment of drought mitigation measures. Journal of Water Resources Planning and Management, 131 (6), 449–457. doi:10.1061/(ASCE)0733-9496(2005)131:6(449)
- Rost, S., et al., 2008. Agricultural green and blue water consumption and its influence on the global water system. Water Resources Research, 44 (9), 1–17. doi:10.1029/2007WR006331
- Sangoyomi, T.B. and Harding, B.L., 1995. Mitigating impacts of a severe sustained drought on Colorado-river water-resources. Water Resources Bulletin, 31, 925–938. doi:10.1111/j.1752-1688.1995.tb03411.x
- Sheffield, J. and Wood, E.F., 2011. Drought: past problems and future scenarios. Abingdon, UK: Routledge.
- Shiau, J.T., 2006. Fitting drought duration and severity with two-dimensional copulas. Water Resources Management, 20 (5), 795–815. doi:10.1007/s11269-005-9008-9
- SNWA, 2015. Water resource plan. Available from: http://www.snwa.com/ws/resource_plan.html [ Accessed 17 December 2015].
- Sun, G., et al., 2008a. Impacts of climate change, population growth, land use change, and groundwater availability on water supply and demand across the conterminous US. Watershed Update, 6, 1–30.
- Sun, G., et al., 2008b. Impacts of multiple stresses on water demand and supply across the southeastern United States. Journal of the American Water Resources Association, 44 (6), 1441–1457. doi:10.1111/j.1752-1688.2008.00250.x
- Svoboda, M., et al., 2002. The drought monitor. Bulletin of the American Meteorological Society, 83 (8), 1181–1190. doi:10.1175/1520-0477(2002)083<1181:TDM>2.3.CO;2
- UNWWAP (United Nations World Water Assessment Programme), 2012. Global water resources under increasing pressure from rapidly growing demands and climate change. UN World Water Development Report, UNESCO. [Online]. Available from: http://www.unesco.org/new/fileadmin/MULTIMEDIA/HQ/SC/pdf/WWDR4BackgroundBriefing Note_ENG.pdf [Accessed 4 March 2019].
- USDM (United States Drought Monitor), 2006. Available from: http://droughtmonitor.unl.edu/aboutus/classificationscheme.aspx [Accessed 4 December 532 2015].
- USDM (United States Drought Monitor), 2016. United States drought monitor products [Online]. Available from: http://droughtmonitor.unl.edu/ [Accessed 4 March 2019].
- Van Beek, L.P.H., Wada, Y., and Bierkens, M.F.P., 2011. Global monthly water stress: 1. Water balance and water availability. Water Resources Research, 47 (7), W07517. doi:10.1029/2010WR009791
- Veldkamp, T.I.E., et al., 2015. Changing mechanism of global water scarcity events: impacts of socio-economic changes and inter-annual hydro-climatic variability. Global Environmental Change, 32, 18–29. doi:10.1016/j.gloenvcha.2015.02.011
- Venkatesan, A.K., et al., 2011. Systems dynamic model to forecast salinity load to the Colorado River due to urbanization within the Las Vegas Valley. Science of the Total Environment, 409 (13), 2616–2625. doi:10.1016/j.scitotenv.2011.03.018
- Vorosmarty, C.J., 2000. Global water resources: vulnerability from climate change and population growth. Science, 289 (5477), 284–288. doi:10.1126/science.289.5477.284
- Wada, Y., et al., 2011. Global monthly water stress: 2. Water demand and severity of water stress. Water Resources Research, 47 (7), 1–17. doi:10.1029/2010WR009792
- Yoo, J., et al., 2012. Drought frequency analysis using cluster analysis and bivariate probability distribution. Journal of Hydrology, 420–421, 102–111. doi:10.1016/j.jhydrol.2011.11.046
- Yuan, X. and Wood, E.F., 2013. Multimodel seasonal forecasting of global drought onset. Geophysical Research Letters, 40 (18), 4900–4905. doi:10.1002/grl.50949
- Yue, S., et al., 1999. The Gumbel mixed model for flood frequency analysis. Journal of Hydrology, 226 (1–2), 88–100. doi:10.1016/S0022-1694(99)00168-7