
ABSTRACT
Based on snow-depth and measured runoff data in the 19 river basins of the cryosphere areas of China, changes in cold season snow depth (CSSD) and spring runoff, and the relationship between CSSD and spring runoff were analysed. Decreasing trends in CSSD were detected mainly in the plains (plateaus), while increasing trends were found mainly in the mountainous regions. Different combinations of precipitation and temperature may be responsible for these results. The response of spring runoff to CSSD change varied greatly under climate warming. The runoff in April and May was commonly affected by CSSD, while the runoff in March was less affected by CSSD, but more by the increasing temperature causing more snowmelt in March. Due to relatively greater snow accumulation in spring, the runoff during spring was less affected by CSSD in the southern Tienshan Mountains.
Editor R. Woods; Associate editor S. Kanae
1 Introduction
The cryosphere is highly sensitive to climate change due to the sensitivity of its environment to warming (Christensen and Pauly Citation2004). During the past few decades, climate warming has caused widespread and rapid shrinking of the cryosphere (Jorgenson et al. Citation2006, Schuur and Abbott Citation2011), including shrinking of the Greenland and Antarctic ice sheets and glaciers, reduction in the extent of snow cover, and the large-scale degradation of frozen soils in the Northern Hemisphere (IPCC Citation2013). Recently, the response of the cryosphere to climate change has become a focus of study and has spurred great research interest (Sazonova and Romanovsky Citation2003).
Figure 1. Distribution of the studied river basins and main snow zones in the cryosphere areas of China. NWC, NEC and TP represent snow zones in Northwest China, Northeast China and the Tibetan Plateau, respectively. The numbers on the map represent the different river basins of the study. See for station/basin information.
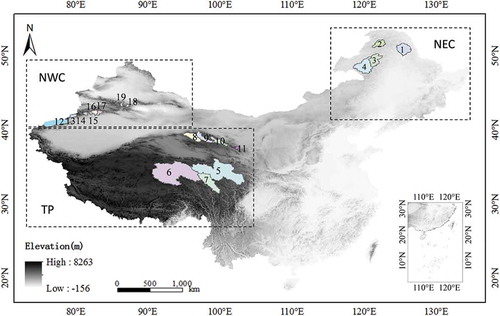
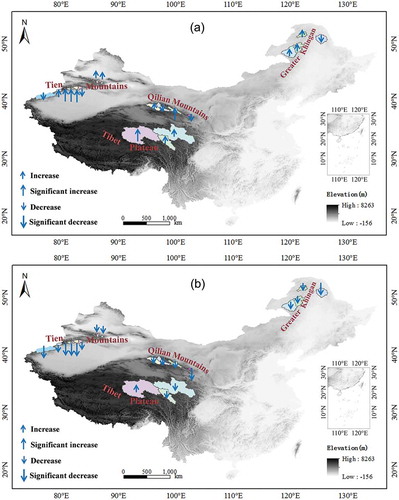
Figure 2. CSSD trends from 1979 to the 2010s in 19 river basins of the cryosphere areas of China. The significant increase/decrease denotes the trend of CSSD change for a basin is significant at p ≤ 0.1. CSSD is the average snow depth from November to the following March.
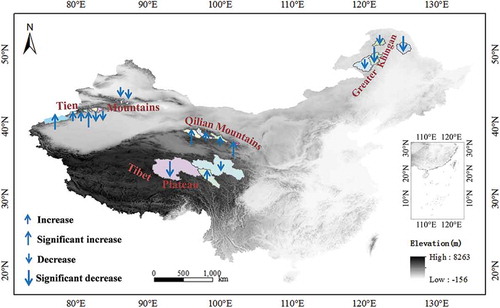
Figure 3. Spring runoff trends from 1979 to the 2010s in the 19 river basins in the cryosphere areas of China. The significant increase/decrease denotes the trend of spring runoff change for a basin is significant at p ≤ 0.1. Spring runoff refers to the average runoff during the period from March to May.
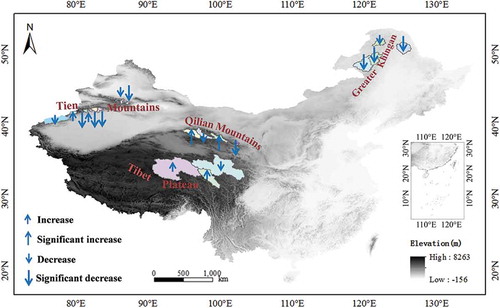
Figure 4. Snowmelt runoff changes in the main cryosphere watershed of the Northern Hemisphere, for the basins of the Lena, Yenisei and Ob rivers (Yang et al. Citation2003), the Syr Darya, Amu Darya, Indus, Ganges, Brahmaputra and Mekong rivers (Savoskul and Smakhtin Citation2013), the Colorado River (Painter et al. Citation2010), the Rhine River (Junghans et al. Citation2011) and the Tarim, Yangtze, Yellow and Hailar rivers (our study).
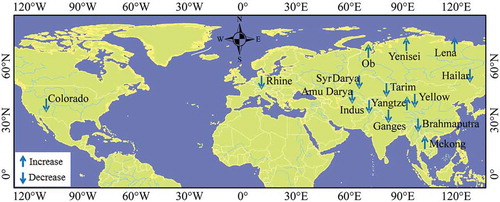
Figure 5. Changes in the index – dividing the runoff for a month (m3/s) by the CSSD (cm) – for (a) March and (b) May in the cryosphere areas of China.
Snow cover is an important component of the cryosphere. Climate warming has led to changes in snow cover at different scales, especially at watershed scales in the Northern Hemisphere, High Asia and mid-latitude mountain regions (López-Moreno et al. Citation2009, McCabe and Wolock Citation2009). The reduction in snow cover extent (SCE; Choi et al. Citation2010, Klein et al. Citation2016), snow water equivalent (SWE; Barnett et al. Citation2005, Hamlet et al. Citation2005), the proportion of precipitation falling as snow (Knowles et al. Citation2006) and earlier spring snowmelt (Mote et al. Citation2005, Choi et al. Citation2010) are all evidence of snow cover changes. The spring snow cover extent in the Northern Hemisphere decreased from 1922 to 2010 (Brown and Robinson Citation2011), and the rate of decrease from 1970 to 2010 was 0.8 × 10⁶ km2 per decade. Similarly, the length of the snowmelt season in the pan-Arctic region has been shortened by 0.6 d/year (Tedesco et al. Citation2009). There is evidence that snow melts earlier in the European part of Eurasia than in the Asian part (Takala et al. Citation2009), and the snow cover duration in the Swiss Alps in 2015 began 12 days later and ended 26 days earlier than that in 1970 (Klein et al. Citation2016). Decreasing trends in snow depth during spring were detected in the eastern Swiss Alps (Marty and Meister Citation2012), the central Spanish Pyrenees (López-Moreno and Vicente-Serrano Citation2007) and most of China (Ma and Qin Citation2012), while increasing trends during winter were observed in Northwest China (Ma and Qin Citation2012), and there was no change during winter in the eastern Swiss Alps (Marty and Meister Citation2012).
The runoff regimes of many rivers, specifically those originating from the mid and high latitudes, or high-altitude areas (e.g. the Alps, the pan-Arctic region, the Tibetan Plateau), are affected greatly by changing snowmelt runoff (Tedesco et al. Citation2009, Klein et al. Citation2016, Zhou et al. Citation2017). Reduced snow accumulation decreases the amount of snowmelt runoff in the subsequent warm season (Siderius et al. Citation2013). In Switzerland, a decrease in the maximum SWE reduced the minimum discharge in July, which was evident for basins at high elevations (Jenicek et al. Citation2016). In the Sierra Nevada of California, USA, a 10% decrease in the peak SWE reduced the annual minimum flows by 9–22% (Godsey et al. Citation2014). In Europe, the shift from a rain-and-snow combined precipitation regime towards a rainfall-dominated regime led to a decrease in summer discharge (Middelkoop et al. Citation2001). Similarly, Berghuijs et al. (Citation2014) found that an increased ratio of precipitation falling as snow also increased the mean runoff in the contiguous United States. In Northwest China, changes in precipitation and temperature altered the annual runoff by 7.69% and 14.15%, respectively (Li et al. Citation2013). The effect of a snow depth of 11–20 cm in early winter was significant on the spring runoff in the Tosh River, but not on that of the Kumalake River (Luo and Lu Citation2011).
In China, snow cover is mainly distributed in high-latitude and high-altitude areas, such as Xinjiang, Northeast China and the Tibetan Plateau (Li and Wang Citation2011). In these areas, snow is the largest component of the water that serves as a natural reservoir for cold season precipitation storage and the release of water during the warmer months. The ratio of snowmelt contribution to runoff varies between 20% and 50% in the arid and semi-arid mountainous areas of Northwest China (Xu et al. Citation2010, Sun et al. Citation2016). In spring, the snowmelt runoff accounts for more than 44% of the total runoff in typical inland rivers in the southern Tienshan Mountains, while it contributes only 27.3% of the total runoff in typical inland rivers in the northern Tienshan Mountains (Sun et al. Citation2016). The snowmelt runoff on the Tibet Plateau accounts for about 9.8–25.4% (Shen et al. Citation2007, Zhang et al. Citation2005, Ding et al. Citation2017, Yan Citation2017), and about 13.3–24.9% in Northeast China (Jiao et al. Citation2009). In the cryosphere areas of China, the effects of snow cover change on runoff may be more complex due to the great differences of the regional climate. For example, the snow runoff in the Tienshan Mountains varied in the past few decades, due to the decreasing snow cover fraction in the Middle and East Tienshan Mountains and the increasing snow cover fraction in the West Tienshan Mountains (Chen et al. Citation2016). Changes in snow cover have a great impact on spring runoff in the source regions of the Yangtze and Yellow rivers, but have little impact in the Heihe and Shule rivers (Ding and Xiao Citation2018). In the Songhua River Basin, the increase in snowfall is not enough to counteract the effects of temperature on the snowmelt (Zhu et al. Citation2015). However, little work has yet been done to investigate the effects of the snow cover change on the spring runoff of the entire cryosphere area of China. Considering that snow depth is an important parameter for hydrological modelling and meteorological forecasting (Barnett et al. Citation1988, Sun et al. Citation2015), this study primarily aims to (1) estimate the changes in cold season snow depth (CSSD) and spring runoff, and (2) analyse the relationships between CSSD and spring runoff in the cryosphere areas of China. The study of snow change and its impact on river runoff is important for understanding the water resource changes and developing effective water resource management.
2 Materials and methods
2.1 Study area
A total of 19 unregulated basins in the cryosphere areas of China were selected for analysis (). These basins are located in Northeast China (NEC), the Tibetan Plateau (TP) and Northwest China (NWC, and ), which represent higher latitude and low-altitude, lower latitude and high-altitude and middle latitude and high-altitude areas, respectively. All basins are little affected by human activities.
Table 1. Studied river basins in the cryosphere areas of China. Snow zones are NWC: Northwest China; NEC: Northeast China; and TP: Tibetan Plateau.
2.2 Data
The monthly runoff data, obtained from the local hydrology bureau, were measured at the hydrological stations of the 19 river basins in the cryosphere areas of China (see ). Most of these data series began in the 1950s and include complete records that span more than 49 years, except for Hutubi River, with only 34 years of recorded data ().
The snow-depth dataset was obtained from the Long-Term Snow Depth Products for China (LSDPC), which was derived from passive microwave remote sensing data collected from 1979 to 2016. The dataset was provided by the Cold and Arid Regions Sciences Data Center at Lanzhou (http://westdc.westgis.ac.cn). Under current conditions, the passive microwave satellite technique is the most efficient way to measure snow depth and SWE on both global and regional scales (Kelly et al. Citation2003, Kelly and Chang Citation2003, Derksen et al. Citation2010, Tedesco and Narvekar Citation2010, Hancock et al. Citation2013).
The original data used to retrieve the LSDPC were from the Scanning Multi-channel Microwave Radiometer (SMMR; 1978–1987), Special Sensor Microwave Imager (SSM/I; 1987–2007) and SSMI/S (2008–2016), which were processed by the National Snow and Ice Data Center (NSIDC; https://nsidc.org/). The radiometric characteristics of the SMMR, SSM/I (F08, F11 and F13) and SSMI/S (F17) are listed in . The accuracy of snow depth in China has been improved greatly through cross-calibration of the brightness temperatures of the different sensors, amendment of the Chang algorithm, and application of a decision-tree algorithm (Che and Li Citation2004, Che et al. Citation2008). The observed snow depths at the ground stations of China were used to calibrate the SMMR, SSM/I and SSMI/S data, which also largely improved the accuracy of the snow-depth products in China (Che and Li Citation2004, Dai et al. Citation2015). The MODIS snow products for 2000/01 winter were collected for the assessment of accuracy of passive microwave remote sensing data, and showed that the overall mean accuracy is 86% and the highest precision is 95.5% (Che and Li Citation2004). The relative biases in snow depth in China between the SSM/I and SSMI/S data decreased from 66.18% to −1.5% (Dai et al. Citation2015). This long-sequenced snow dataset has been widely used for the estimation of snow depth and SWE in Xinjiang (Dai et al. Citation2012), snow depth in Northeast China (e.g. Che et al. Citation2016) and snow cover and depth on the Qinghai–Tibetan Plateau (e.g. Dai et al. Citation2017).
Table 2. Parameters of passive microwave sensors on various satellitesa.
Based on the digital elevation model (DEM) data of the Shuttle Radar Topography Mission with a spatial resolution of 3 arcseconds, the boundaries of the river basins were extracted by using the ArcSWAT2009 model. The snow-depth value for each basin was extracted from the LSDPC according to the basin boundary. To maintain consistency, snow-depth and runoff data from 1979 to the 2010s were selected for analysis in this study.
2.3 Methods
2.3.1 Cold season snow-depth change
Based on the definitions in the related literature (Zhang and Wei Citation2002, Knowles et al. Citation2006, López-Moreno et al. Citation2009, Lei et al. Citation2016, Wang et al. Citation2017) and the local climate, the cold season is defined as the period from November to March of the following year. In this study, the changes in CSSD were estimated using the Mann-Kendall method (Mann Citation1945, Kendall Citation1975), which has been widely applied to the analysis of the trends in climate factors in time series (Yue et al. Citation2002).
2.3.2 Spring runoff change
In this study, spring runoff refers to the average runoff during the period from March to May. Similar to CSSD, the changes in spring runoff were also analysed by the Mann-Kendall test. The changes in runoff in March, April and May were also estimated separately. Considering that increased baseflow could originate from possible permafrost thawing (e.g. Walvoord and Striegl Citation2007, St Jacques and Sauchyn Citation2009, Wang et al. Citation2019), the baseflow in spring was removed using a graph separation method to eliminate the effects of permafrost thawing (Xu et al. Citation2011). The graph separation method was based on the monthly minimum average flow rate at the flow process line. When split horizontally, the annual baseflow is below the straight line.
2.3.3 Correlation analysis between CSSD and spring runoff
Snow runoff during spring should be closely related to snow cover in the cold season (Li and Wang Citation2011). Unlike the traditional analysis method, the relationship between CSSD and runoff in March, April, May and the entire spring was analysed in this study. The relationship between CSSD and spring runoff was detected using correlation analysis, which was based on the Pearson momentum correlation coefficient (r) (Zhang et al. Citation2018).
3 Results
3.1 Trends in CSSD
As shown in and , the CSSD exhibited a decreasing trend in 11 of the 19 river basins across the cryosphere areas of China. Of these 11 basins, only two were significant at the p ≤ 0.1 level and one was significant at the p ≤ 0.05 level. All basins in NEC and north of the Tienshan Mountains, and two of the three basins in the hinterland of the TP were detected to show a decreasing trend. Increasing trends were detected in eight of the 19 river basins. Of these eight basins, the trends in three were significant at the p ≤ 0.1 level and one was significant at the p ≤ 0.01 level. Three of the four basins in the Qilian Mountains and four of the six basins in the southern Tienshan Mountains were detected to show an increasing trend. In the Qilian Mountains, one basin showed increasing CSSD at the p ≤ 0.1 level, and one was significant at the p ≤ 0.01 level.
Table 3. Change trends in CSSD and spring runoff in the cryosphere areas of China. CSSD denotes cold season snow depth from November to March of the following year. CSSD change and runoff change were estimated by the Mann-Kendall test. Italic, bold and underlined values indicate statistical significance of p ≤ 0.1, p ≤ 0.05 and p ≤ 0.01, respectively. See for station/basin information.
3.2 Trends in spring runoff
As shown in , the runoff in March exhibited an increasing trend in 18 of the 19 (95%) basins across the cryosphere areas of China. Of these 18 basins, only one had a significant trend at the p ≤ 0.1 level, two were significant at the p ≤ 0.05 level, and three were significant at the p ≤ 0.01 level. A non-significant decreasing trend was detected in the Toxkan River.
The changes for the runoff in April varied greatly (), and 11 of the 19 basins were detected to show a decreasing trend. Of these 11 basins, only two showed a significant trend at the p ≤ 0.1 level. All basins in the NEC, and two of the three basins in the hinterland of the TP were detected to show a decreasing trend. Increasing trends were detected in eight of the 19 basins: three of the four basins in the Qilian Mountains and half of basins in the Tienshan Mountains. In the Qilian Mountains, one basin showed a decreasing trend at the p ≤ 0.05 level, and one was significant at the p ≤ 0.01 level.
The runoff in May exhibited a decreasing trend in 14 (74%) of the 19 basins across the cryosphere areas of China (). Of these 14 basins, only two trends were significant at the p ≤ 0.1 level, five were significant at the p ≤ 0.05 level, and one was significant at the p ≤ 0.01 level. All basins in NEC and the northern Tienshan Mountains, two of the three basins in the hinterland of the TP, four of the six basins in the southern TP and half of basins in the Qilian Mountains were detected to show a decreasing trend. Increasing trends were detected in five of the 19 basins, but none of them passed the significance test.
Similar to the runoff in May, the average spring runoff also exhibited a decreasing trend in 14 (74%) of the 19 basins across the cryosphere areas of China ( and ). Of these 14 basins, only four showed a significant trend at the p ≤ 0.1 level, and four were significant at the p ≤ 0.05 level. All basins in NEC and the northern Tienshan Mountains, five of the six basins in the southern TP and half of the basins in the Qilian Mountains were detected to show a decreasing trend. Increasing trends were detected in five of the 19 river basins, with only one significant at the p ≤ 0.1 level, and one at the p ≤ 0.05 level.
3.3 Relationship between CSSD and spring runoff
According to the correlation analysis between CSSD and the runoff in March, almost no statistical correlation was found across the cryosphere areas of China (). This may indicate that the runoff in March was not obviously affected by cold season snow cover changes.
Table 4. Correlation analysis between CSSD and the runoff during spring. CSSD denotes snow depth from November to March of the following year. Italic, bold and underlined values indicate statistical significance of p ≤ 0.1, p ≤ 0.05 and p ≤ 0.01, respectively. See for station/basin information.
The significant correlation between CSSD and the runoff in April was found in 10 of the 19 basins, which were mainly distributed in NEC and the hinterland of the TP (). This may indicate that the runoff of these basins in April was obviously affected by cold season snow cover in the plateaus, especially in the plains. Similarly, the significant correlation between CSSD and the runoff in May (spring) was also detected in 11 (13) of the 19 basins, which were mainly distributed in NEC, the hinterland of the TP, the Qilian Mountains and the northern Tienshan Mountains ().
According to the comparative analysis of the correlation between CSSD and runoff in March, April and May, and the entire spring, almost no statistical correlation was found in the south of the Tienshan Mountains (). This may indicate that the spring runoff was not obviously affected by cold season snow cover changes.
4 Discussion
The changes in CSSD observed in this study varied greatly across the cryosphere areas of China. Decreasing trends were detected mainly in the plains (plateaus), such as the river basins in NEC and the hinterland of the TP, while increasing trends were found mainly in the mountainous regions (e.g. Tienshan and Qilian mountains). Different combinations of precipitation and temperature could be responsible for the above results.
In general, climate warming can cause a lower fraction of the precipitation to fall as snow (Leung et al. Citation2004, Knowles et al. Citation2006), resulting in more frequent snowmelt events in the cold season (Mote et al. Citation2005), which could lead to a decreased snow depth in the cold season and decreased snowmelt runoff in spring. Similar results were found in NEC, where decreasing snow depth was detected under the condition of no obvious change for winter precipitation but an obvious increase for winter temperature (He et al. Citation2013). The increases in winter temperature (Han et al. Citation2013) and winter precipitation (Han et al. Citation2017, Yang et al. Citation2017) were found simultaneously in the colder and higher mountain areas of western China, where the increase in CSSD may indicate that the effect of increased precipitation has surpassed that of warmer temperature. Similar results were also observed at other high-altitude areas, where increased cold season snow cover was detected with increased cold season precipitation under climate warming (Beniston et al. Citation2003, Vincent et al. Citation2007). Essery (Citation1997) found that snowfall commonly showed an increased trend at high-latitude and high-altitude areas of the mid-latitude. Brown (Citation2000) pointed out that a 2% increase in precipitation was enough to offset the impact of large-scale SCE warming. However, the CSSD showed a decreased trend in the mountainous areas of the northern Tienshan Mountains in this study. This may be attributed to increased precipitation distribution in front of the mountains, but not in the mountains due to the development of an inversion layer (Han et al. Citation2002).
Changes in the snow cover, caused mainly by different combinations of precipitation and temperature, should lead to the different responses of spring runoff. Similar results have been detected across the Northern Hemisphere (), where the snowmelt runoff decreased in most of the river basins in the Northern Hemisphere but increased in those located in colder areas, especially in high-latitude areas. However, we found that the runoff in March exhibited an increasing trend in 18 (95%) of the 19 basins across the cryosphere areas of China, no matter how CSSD changed. Further research showed that almost no statistical correlation between CSSD and the runoff in March was found. This may indicate that the runoff in March was not obviously affected by cold season snow cover changes, but by the increasing temperature causing more snowmelt in March. The significant correlation between CSSD and the runoff in April (May) was detected in 10 (11) of the 19 basins, which indicates that the runoff in April (May) was commonly affected by cold season snow cover in NEC and the hinterland of the TP (NEC, hinterland of the TP, Qilian Mountains and northern Tienshan Mountains). Decreasing trends in the runoff in April and May were detected across the cryosphere areas of China, especially in May (). This result may indicate that more snow cover had melted in the previous months, which was consistent with our findings that 95% of basins exhibited an increasing trend in March no matter how CSSD changed. In order to verify this finding, an index was constructed by dividing the runoff in a month (m3/s) by the CSSD (cm) for each year. As shown in , the index for May showed a decreasing trend in almost 95% of the basins, which may indirectly prove that more snow cover melted during the previous months. Meanwhile, almost 74% of basins showed an increasing trend in the index for March, which may directly prove that more snow cover melted in March.
In the south of the Tienshan Mountains, almost no statistical correlation between CSSD and runoff in March, April, May and the entire spring was detected in this study. This may be attributed to the relatively greater snow accumulation in spring in the Tienshan Mountains. The high correlation (average correlation coefficient: 0.42) between spring depth and spring runoff confirmed this finding.
5 Conclusions
In the cryosphere areas of China, the changes in CSSD varied greatly. Decreasing trends in CSSD were detected mainly in the plains (plateaus), such as the river basins in NEC and the hinterland of the TP, while increasing trends were found mainly in the mountainous regions (e.g. Tienshan and Qilian mountains). Different combinations of precipitation and temperature should be responsible for the above results.
The response of spring runoff to CSSD change varied greatly under climate warming. The runoff in March exhibited an increasing trend in 95% of basins across the cryosphere areas of China, no matter how CSSD changed. This may indicate that the runoff in March was not obviously affected by cold season snow cover changes, but by the increasing temperature causing more snowmelt in March. This finding was supported by an index (monthly runoff divided by CSSD), which commonly showed an increasing trend for March but a decreasing trend for May. The runoff in April was commonly affected by cold season snow cover in the NEC and the hinterland of the TP, and the runoff for May was affected by cold season snow cover in the NEC, the hinterland of the TP, the Qilian Mountains and the northern Tienshan Mountains. However, the runoff in March, April, May and the entire spring was not affected by CSSD in the southern Tienshan Mountains, which may be attributed to the relatively greater snow accumulation in spring.
Acknowledgments
The snow-depth dataset and the digital elevation model data were provided by the Cold and Arid Regions Sciences Data Center at Lanzhou (http://westdc.westgis.ac.cn). We also thank the Hydrology Bureau of China for providing runoff data.
Disclosure statement
No potential conflict of interest was reported by the authors.
Additional information
Funding
References
- Barnett, T.P., et al., 1988. The effect of Eurasian snow cover on global climate. Science, 239 (4839), 504–507.
- Barnett, T.P., Adam, J.C., and Lettenmaier, D.P., 2005. Potential impacts of a warming climate on water availability in snow–dominated regions. Nature, 438 (7066), 303–309. doi:10.1038/nature04141
- Beniston, M., et al., 2003. Estimates of snow accumulation and volume in the Swiss Alps under changing climatic conditions. Theoretical and Applied Climatology, 76 (3–4), 125–140. doi:10.1007/s00704-003-0016-5
- Berghuijs, W.R., Woods, R.A., and Hrachowitz, M., 2014. A precipitation shift from snow towards rain leads to a decrease in streamflow. Nature Climate Change, 4 (7), 583–586. doi:10.1038/NCLIMATE2246
- Brown, R.D., 2000. Northern Hemisphere snow cover variability and change, 1915–1997. Journal of Climate, 13 (13), 2339–2355. doi:10.1175/1520-0442(2000)013<2339:NHSCVA>2.0.CO;2
- Brown, R.D. and Robinson, D.A., 2011. Northern Hemisphere spring snow cover variability and change over 1922–2010 including an assessment of uncertainty. The Cryosphere, 5 (1), 219–229. doi:10.5194/tc-5-219-2011
- Che, T., et al., 2008. Snow depth derived from passive microwave remote–sensing data in China. Annals of Glaciology, 49, 145–154. doi:10.3189/172756408787814690
- Che, T., et al., 2016. Estimation of snow depth from passive microwave brightness temperature data in forest regions of northeast China. Remote Sensing of Environment, 183, 334–349. doi:10.1016/j.rse.2016.06.005
- Che, T. and Li, X., 2004. Retrieval of snow depth in China by passive microwave remote sensing data and its accuracy assessment. Remote Sensing Technology and Application, 19 (5), 301–306.
- Chen, Y.N., et al., 2016. Changes in central Asia’s water tower: past, present and future. Scientific Reports, 1–11. doi:10.1038/srep35458
- Choi, G., et al., 2010. Changing northern hemisphere snow seasons. Journal of Climate, 23 (19), 5305–5310. doi:10.1175/2010JCLI3644.1
- Christensen, V. and Pauly, D., 2004. Placing fisheries in their ecosystem context, an introduction. Ecological Modelling, 172 (2), 103–107. doi:10.1016/j.ecolmodel.2003.09.002
- Dai, L., et al., 2012. Snow depth and snow water equivalent estimation from AMSR–E data based on a priori snow characteristics in Xinjiang, China. Remote Sensing of Environment, 127, 14–29. doi:10.1016/j.rse.2011.08.029
- Dai, L., et al., 2017. Evaluation of snow cover and snow depth on the Qinghai–Tibetan Plateau derived from passive microwave remote sensing. The Cryosphere, 11 (4), 1933–1948. doi:10.5194/tc-11-1933-2017
- Dai, L.Y., Che, T., and Ding, Y.J., 2015. Inter–Calibrating SMMR, SSM/I and SSMI/S data to improve the consistency of snow–depth products in China. Remote Sensing, 7, 7212–7230. doi:10.3390/rs70607212
- Derksen, C., et al., 2010. Development of a tundra–specific snow water equivalent retrieval algorithm for satellite passive microwave data. Remote Sensing of Environment, 114, 1699–1709. doi:10.1016/j.rse.2010.02.019
- Ding, Y. and Xiao, C., 2018. The synthesis report of cryospheric changes and their impacts. Beijing: Science Press.
- Ding, Y.J., et al., 2017. Introduction to hydrology in cold regions. Beijing: Science Press.
- Essery, R., 1997. Seasonal snow cover and climate change in the Hadley Centre GCM. Annals of Glaciology, 25, 362–366. doi:10.3189/S0260305500014282
- Godsey, S.E., Kirchner, J.W., and Tague, C.L., 2014. Effects of changes in winter snowpacks on summer low flows: case studies in the Sierra Nevada, California, USA. Hydrological Processes, 28 (19), 5048–5064. doi:10.1002/hyp.9943
- Hamlet, A.F., et al., 2005. Effects of temperature and precipitation variability on snowpack trends in the western United States. Journal of Climate, 18 (21), 4545–4561. doi:10.1175/JCLI3538.1
- Han, C., Hao, Z.,.X., and Zheng, J.Y., 2013. Regionalization of temperature changes in China and characteristics of temperature in different regions during 1951–2010. Progress in Geography, 32 (6), 887–896. doi:10.11820/dlkxjz.2013.06.005
- Han, T.D., Ye, B.S., and Jiao, K.Q., 2002. Temperature variations in the southern and northern slopes of Mt. Tianger in the Tianshan Mountains. Journal of Glaciology and Geocryology, 34 (1), 1–11.
- Han, Y.Z., et al., 2017. Climatic characteristics of rainfall change over the Qinghai–tibetan Plateau from 1980 to 2013. Plateau Meteorology, 36 (6), 1477–1486. doi:10.7522/j.issn.1000–0534.2016.00125
- Hancock, S., et al., 2013. Evaluating global snow water equivalent products for testing land surface models. Remote Sensing of Environment, 128, 107–117. doi:10.1016/j.rse.2012.10.004
- He, W., et al., 2013. Characteristics of temperature and precipitation in Northeastern China from 1961 to 2005. Acta Ecologica Sinica, 33 (2), 0519–0531. doi:10.5846/stxb201111241799
- IPCC (Intergovernmental Panel on Climate Change), 2013. Climate change 2013: the physical science basis. Cambridge, IK: Cambridge University Press. Contribution of Working Group I to the Fifth Assessment Report of the Intergovernmental Panel on Climate Change.
- Jenicek, M., et al., 2016. Importance of maximum snow accumulation for summer low flows in humid catchments. Hydrology and Earth System Sciences, 20 (2), 859–874. doi:10.5194/hess-20-859-2016
- Jiao, J., et al., 2009. Study on snowmelt runoff and sediment yields in Northeast China. Geographical Research, 28 (2), 333-344.
- Jorgenson, M.T., Shur, Y.L., and Pullman, E.R., 2006. Abrupt increase in permafrost degradation in Arctic Alaska. Geophysical Research Letters, 33 (2), L02503. doi:10.1029/2005GL024960,2006
- Junghans, N., Cullmann, J., and Huss, M., 2011. Evaluating the effect of snow and ice melt in an Alpine headwater catchment and further downstream in the River Rhine. Hydrological Sciences Journal, 56 (6), 981–993. doi:10.1080/02626667.2011.595372)
- Kelly, R.E., et al., 2003. A prototype AMSR–E global snow area and snow depth algorithm. IEEE Transactions on Geoscience and Remote Sensing, 41 (2), 230–242. doi:10.1109/TGRS.2003.809118
- Kelly, R.E. and Chang, A.T.C., 2003. Development of a passive microwave global snow depth retrieval algorithm for SSM/I and AMSR–E data. Radio Science, 38 (4), 8076. doi:10.1029/2002RS002648
- Kendall, M.G., 1975. Rank correlation methods. London: Griffin.
- Klein, G., et al., 2016. Shorter snow cover duration since 1970 in the Swiss Alps due to earlier snowmelt more than to later snow onset. Climatic Change, 139 (3–4), 637–649. doi:10.1007/s10584–016–1806–y
- Knowles, N., Dettinger, M.D., and Cayan, D.R., 2006. Trends in snowfall versus rainfall in the western United States. Journal of Climate, 19 (18), 4545–4559. doi:10.1175/JCLI3850.1
- Lei, X.J., et al., 2016. The characteristics and causes of the snow cover variation in the Taibai Mountains during 1962–2014. Journal of Glaciology and Geocryology, 38 (5), 1201–1210. doi:10.7522/j.issn.1000-0240.2016.0140
- Leung, L.R., et al., 2004. Mid-century ensemble regional climate change scenarios for the western United States. Climatic Change, 62 (1–3), 75–113. doi:10.1023/B:CLIM.0000013692.50640.55
- Li, B.F., et al., 2013. Variations of temperature and precipitation of snowmelt period and its effect on runoff in the mountainous areas of Northwest China. Journal of Geographical Sciences, 23 (1), 17–30. doi:10.1007/s11442-013-0990-1
- Li, D.L. and Wang, C.X., 2011. Research progress of snow cover and its influence on China climate. Transactions of Atmospheric Sciences, 34 (5), 627–636. doi:10.13878/j.cnki.dqkxxb.2011.05.013
- López-Moreno, J.I., Goyette, S., and Beniston, M., 2009. Impact of climate change on snowpack in the Pyrenees: Horizontal spatial variability and vertical gradients. Journal of Hydrology, 374 (3–4), 384–396. doi:10.1016/j.jhydrol.2009.06.049
- López-Moreno, J.I. and Vicente-Serrano, S.M., 2007. Atmospheric circulation influence on the interannual variability of snow pack in the Spanish Pyrenees during the second half of the 20th century. Hydrology Research, 38 (1), 33–44. doi:10.2166/nh.2007.030
- Luo, J. and Lu, X.M., 2011. Distribution characteristics of snow cover and its effect on spring–runoff in akesu region during 2004–2009. Desert and Oasis Meteorology, 5 (5), 35–38.
- Ma, L.J. and Qin, D.H., 2012. Spatial–temporal characteristics of observed key parameters for snow cover in china during 1957–2009. Journal of Glaciology and Geocryology, 34 (1), 1–11.
- Mann, H.B., 1945. Nonparametric tests against trend. The Econometric Society, 13 (3), 245–259. doi:10.2307/1907187
- Marty, C. and Meister, R., 2012. Long–term snow and weather observations at Weissfluhjoch and its relation to other high-altitude observatories in the Alps. Theor Appl Climatol, 110, 573–583. doi:10.1007/s00704–012–0584–3
- McCabe, G.J. and Wolock, D.M., 2009. Recent declines in western US snowpack in the context of twentieth–century climate variability. Earth Interactions, 13 (12), 1–15. doi:10.1175/2009EI283.1
- Middelkoop, H., et al., 2001. Impact of climate change on hydrological regimes and water resources management in the Rhine basin. Climatic Change, 49 (1–2), 105–128. doi:10.1023/A:1010784727448
- Mote, P.W., et al., 2005. Declining mountain snowpack in western North America. Bulletin of the American Meteorological Society, 86 (1), 39–49. doi:10.1175/BAMS-86-1-39
- Painter, T.H., et al., 2010. Response of Colorado River runoff to dust radiative forcing in snow. Proceedings of the National Academy of Sciences, 107 (40), 17125–17130. doi:10.1073/pnas.0913139107/-/DCSupplemental
- Savoskul, O.S. and Smakhtin, V., 2013. Glacier systems and seasonal snow cover in six major Asian river basins: hydrological role under changing climate. Colombo, Sri Lanka: International Water Management Institute (IWMI). IWMI Research Report 150. doi:10.5337/2013.204
- Sazonova, T.S. and Romanovsky, V.E., 2003. A model for regional–scale estimation of temporal and spatial variability of active layer thickness and mean annual ground temperatures. Permafrost and Periglacial Processes, 14 (2), 125–139. doi:10.1002/ppp.449
- Schuur, E.A. and Abbott, B., 2011. Climate change: high risk of permafrost thaw. Nature, 480 (7375), 32–33. doi:10.1038/nature10611
- Shen, Y.P., et al., 2007. Hydrological processes responding to climate warming in the upper reaches of Kelan river basin with snow-dominated of the Altay Mountains region, Xinjiang, China. Journal of Glaciology and Geocryology, 29 (6), 845–854.
- Siderius, C., et al., 2013. Snowmelt contributions to discharge of the Ganges. Science of the Total Environment, 468, S93–S101. doi:10.1016/j.scitotenv.2013.05.084
- St Jacques, J.M. and Sauchyn, D.J., 2009. Increasing winter baseflow and mean annual streamflow from possible permafrost thawing in the Northwest Territories, Canada. Geophysical Research Letters, 36 (1), L01401. doi:10.1029/2008GL035822
- Sun, C.J., et al., 2016. Comparative study of streamflow components in two inland rivers in the Tianshan Mountains, Northwest China. Environmental Earth Sciences, 75 (1), 1–14. doi:10.1007/s12665-016-5314-1
- Sun, Z.W., et al., 2015. Progress in study of snow parameter inversion by passive microwave remote sensing. Remote Sensing for Land&Resources, 27 (1), 9–15. doi:10.6046/gtzyyg.2015.01.02
- Takala, M., et al., 2009. Detection of snowmelt using spaceborne microwave radiometer data in Eurasia from 1979 to 2007. IEEE Transactions on Geoscience and Remote Sensing, 47 (9), 2996–3007. doi:10.1109/TGRS.2009.2018442
- Tedesco, M., et al., 2009. Pan arctic terrestrial snowmelt trends (1979–2008) from spaceborne passive microwave data and correlation with the Arctic Oscillation. Geophysical Research Letters, 36 (21), L21402. doi:10.1029/2009GL039672
- Tedesco, M. and Narvekar, P.S., 2010. Assessment of the NASA AMSR–E SWE product. IEEE Journal of Selected Topics in Applied Earth Observations and Remote Sensing, 3 (1), 141–159. doi:10.1109/JSTARS.2010.2040462
- Vincent, C., et al., 2007. Very high-elevation Mont Blanc glaciated areas not affected by the 20th century climate change. Journal of Geophysical Research: Atmospheres, 112 (D9). doi:10.1029/2006JD007407
- Walvoord, M.A. and Striegl, R.G., 2007. Increased groundwater to stream discharge from permafrost thawing in the Yukon River basin: potential impacts on lateral export of carbon and nitrogen. Geophysical Research Letters, 34 (12), L12402. doi:10.1029/2007GL030216
- Wang, X., Kvaal, K., and Ratnaweera, H., 2017. Characterization of influent wastewater with periodic variation and snow melting effect in cold climate area. Computers and Chemical Engineering, 106, 202–211. doi:10.1016/j.compchemeng.2017.06.009
- Wang, X.Q., et al., 2019. Response of low flows under climate warming in high-altitude permafrost regions in western China. Hydrological Processes, 33, 66–76. doi:10.1002/hyp.13311
- Xu, C., et al., 2010. Long‐term change of seasonal snow cover and its effects on river runoff in the Tarim River basin, northwestern China. Hydrological Processes, 23 (14), 2045–2055. doi:10.1002/hyp.7334
- Xu, L.L., et al., 2011. Baseflow separation methods in hydrological process research: a review. Chinese Journal of Applied Ecology, 22 (11), 3073–3080.
- Yan, Y.M., 2017. Simulation of water resources in the upper reaches of the Yellow river and its future evolution. Shanghai: East China Normal University, 1–85.
- Yang, D.Q., et al., 2003. Streamflow response to seasonal snow cover extent changes in large Siberian watersheds. Journal of Geophysical Research: Atmospheres, 108 (D18), ACL7-1–ACL7-14. doi:10.1029/2002JD003149
- Yang, P., et al., 2017. Temporal and spatial variations of precipitation in Northwest China during 1960–2013. Atmospheric Research, 183, 283–295. doi:10.1016/j.atmosres.2016.09.014
- Yue, S., Pilon, P., and Cavadias, G., 2002. Power of the Mann–kendall and Spearman‘s rho tests for detecting monotonic trends in hydrological series. Journal of Hydrology, 259 (1–4), 254–271. doi:10.1016/S0022-1694(01)00594-7
- Zhang, G.H., et al., 2005. Mechanism and characteristics of groundwater replenishment variation in middle reaches of Heihe river basin. Journal of Hydraulic Engineering, 36 (6), 715–720.
- Zhang, L.X. and Wei, W.S., 2002. Variation trends of snowcover in the middle mountains of western Tianshan Mts. and their relations to temperature and precipitation. Scientia Geographica Sinica, 22 (1), 67–71.
- Zhang, Y., et al., 2018. Impacts of snow on soil temperature observed across the circumpolar north. Environmental Research Letters, 13 (4), 044012. doi:10.1088/1748-9326/aab1e7
- Zhou, Y., et al., 2017. A comparative analysis of the two dynamic snow-melting process and their relationship with air temperature during 2013–2015 in the area of Maduo, Tibetan Plateau. Journal of Natural Resources, 32 (1), 101–113.
- Zhu, J., et al., 2015. Snow runoff characteristics and its influencing factors of Songhua River Basin. Bulletin of Soil and Water Conservation, 35 (2), 125–130.