
ABSTRACT
Stable isotope data are presented for precipitation, spring and stream water in a headwater catchments in the Indian Lesser Himalaya. Isotopic contents of phreatic groundwater followed the local meteoric water line and showed minimal alteration by evaporation, suggesting fast recharge. Mean isotopic values for springs and the stream were close to the weighted annual mean for precipitation, indicating recharge was in synchrony with seasonal rainfall distribution. Precipitation exhibited isotopic declines of −0.6‰ and −0.2‰ δ18O per 100 m rise in elevation in July and August (monsoon), respectively. The time lag of one month between rainfall and spring discharge, combined with the isotopic lapse rate indicated a recharge elevation of 70–165 m above the spring outflow point, implying the water originated within the catchment. Time series of electrical conductivity and temperature of spring, seepage and stream waters confirmed the rapid recharge and limited storage capacity of the shallow aquifers.
Editor A. Castellarin; Associate editor C. Abesser
1 Introduction
In contrast to the High Himalaya, where snow constitutes a significant portion of total precipitation inputs, springs and streams emanating in the Lesser Himalaya (i.e. the Middle Mountain Zone (MMZ) and adjacent Siwalik hills) are almost entirely rainfed (Bookhagen and Burbank Citation2006, Citation2010, see also Andermann et al. Citation2012). The bulk of the annual rainfall across the MMZ (typically 60–85%) occurs during the Indian summer monsoon (ISM) between June and September, with comparatively minor amounts (<10%) delivered in the winter months (Bookhagen and Burbank Citation2010). This strong seasonality, coupled with the fact that population pressures in the MMZ are amongst the highest within the Himalayas, causes water to be at a premium during the long dry season (Kadekodi et al. Citation2000, Schreier et al. Citation2006). Springs constitute the chief source of freshwater for rural communities in the MMZ, but since the 1980s spring and headwater stream discharges have been reported to be declining across the Himalayan range (Valdiya and Bartarya Citation1989, Citation1991, Kumar et al. Citation1997, Tambe et al. Citation2012, Qazi et al. Citation2017). Reasons for this decline include reduced rainfall infiltration opportunities due to forest degradation and overexploitation (Gerrard and Gardner Citation2002, Ghimire et al. Citation2014a, Qazi et al. Citation2017) as well as diminished winter rainfall (Basistha et al. Citation2009, Rahman et al. Citation2012, Tambe et al. Citation2012). In response to these negative trends in spring and stream discharges, remedial efforts, variously referred to as “spring sanctuary development” (Negi et al. Citation1998), “springshed development” (Tambe et al. Citation2012) or “spring revival” (ICIMOD Citation2015, ACWADAM Citation2017), have been proposed across the MMZ. All of these share a hands-on approach involving spring typological classification based on geological mapping to obtain a basic conceptual understanding of the situation, followed by measures to improve rainfall infiltration, including fencing off inferred recharge areas, digging contour trenches, restoring silted-up hillside pond systems, etc. (Negi et al. Citation1998, Tambe et al. Citation2012, ICIMOD Citation2015). Although spring discharges are being quantified from time to time as part of some of these remedial efforts, there is a widespread lack of insight into the inner workings of most Himalayan spring systems and headwater streams in the face of land-cover and climate change. This, in turn, limits our ability to reliably predict the impacts of continuing global change on spring water and headwater hydrological functioning in the MMZ (Andermann et al. Citation2012, Zomer et al. Citation2014, Rawat et al. Citation2016). An added complication in (especially) mountainous terrain concerns the possibility that the groundwater flow system feeding the springs may be “local” or “regional” in character (Tóth Citation1963, Dahl et al. Citation2007), depending on local topography, geology (folding and orientation of strata) and precipitation surplus (Manga Citation2001, Goderniaux et al. Citation2013). Local flow is confined within a single catchment enclosed by the surface water divide, and circulates to relatively shallow depths in the subsurface. In contrast, regional groundwater flow may circulate to greater depths and is not necessarily confined to a single basin (James et al. Citation2000, Goderniaux et al. Citation2013). Indeed, there is growing evidence from the Himalayan region that the water discharged by springs in the MMZ can originate outside the immediate surface water divide of the catchment due to the orientation of stratified rocks (Mahamuni and Kulkarni Citation2011, Wester Citation2013, ACWADAM Citation2017; see in James et al. Citation2000).
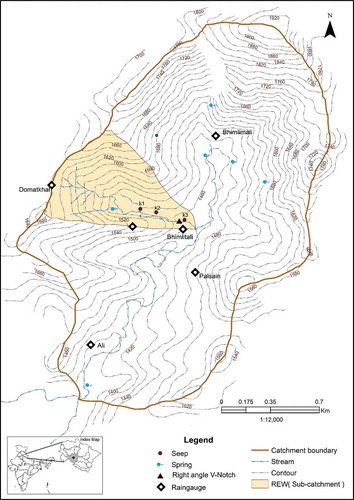
Figure 1. Map of the Dugar Gad headwater catchments showing the locations of raingauges and stream gauging sites, as well as the investigated spring and seeps (K1, K2 and K3) within the representative elementary watershed (REW).
Outside the Himalayas, process-based research has contributed to improved understanding of the internal functioning of (mostly forested) hillslopes and headwater catchments in steeplands (e.g. Noguchi et al. Citation1999, Onda et al. Citation2001, Citation2006, McGlynn et al. Citation2002, Uchida et al. Citation2002, Tromp-van Meerveld and McDonnell Citation2006a, Citation2006b, Cheng et al. Citation2017). These studies have highlighted the important role of preferential flow paths in the rapid recharge of shallow groundwater, and in the fast delivery of shallow subsurface storm flow to low-order streams. Furthermore, several recent studies on runoff generation in headwater regions have shown significant contributions by bedrock groundwater (see Salve et al. Citation2012 and references therein), indicating due emphasis needs to be given to hydrogeological controls as well (Tague and Grant Citation2004, Onda et al. Citation2006, Gabrielli et al. Citation2012). The dynamic nature of groundwater in hard rock, and the importance of highly heterogeneous fracture-dominated flow paths in sustaining streamflow, has been confirmed by many studies (see Banks et al. Citation2009, Haria and Shand Citation2004, Citation2006, Iwagami et al. Citation2010, Gabrielli et al. Citation2012, Salve et al. Citation2012). In contrast, virtually no such studies are available for the MMZ, although Andermann et al. (Citation2012) suggested transient groundwater stored in fractured basement rocks was important to maintain stream discharges in the central Himalaya. The few data available for soil water dynamics at the height of the monsoon suggest that a significant part of the soil profile may become saturated during peak rainfall events, although hillslope saturation appears to rarely extend to the soil surface (Hessel et al. Citation2007). Nevertheless, the development of perched water tables during the monsoon is bound to activate rapid lateral subsurface flow along root channels, pipes and other macropores (Sarkar and Dutta Citation2012), many of which tend to be located near the boundary between soil and weathered rock (Noguchi et al. Citation1999, Uchida et al. Citation2004, Citation2005). Shallow (local) groundwater bodies (Gabrielli et al. Citation2012) or different groundwater compartments within the bedrock (Banks et al. Citation2009, Haria and Shand Citation2004, Citation2006) may feed the springs and riparian groundwater that maintain low-order headwater streams. However, a sound understanding of the extent and nature of the groundwater systems (i.e. local versus regional) that feed the springs, seeps and low-order streams in mountainous areas such as the MMZ (Mulholland Citation1993, Winter et al. Citation2003, Wester Citation2013) is critical for the protection of these vulnerable water resources (see Mahamuni and Kulkarni Citation2011, Tambe et al. Citation2012, ACWADAM Citation2017). Stable isotopes may be used as a tracer for the identification of the elevation of recharge (James et al. Citation2000, Jeelani et al. Citation2010, Wester Citation2013), thereby giving an idea of the scale of the groundwater flow (local or regional). Additionally, monitoring the electrical conductivity (EC) and temperature of the outflowing water can provide further insights into the underlying aquifer characteristics and extent of the groundwater circulation (James et al. Citation2000, Desmarais and Rojstaczer Citation2002, Tarafdar Citation2013). Furthermore, combined hydrometric and isotope- or chemical tracer-based observations on the water in discrete landscape units (e.g. hillsides versus the riparian zone) can be instrumental in quantifying the contributions of dominant (shallow) flow paths in mountainous headwaters to overall flow using an end-member-mixing approach (McGlynn et al. Citation2002, Kurtz et al. Citation2011, Hugenschmidt et al. Citation2014).
The objectives of this study therefore were: firstly, to map geological and structural discontinuities at the micro-catchment level to understand the most probable groundwater flow directions within a typical headwater catchments underlain by fractured meta-sedimentary rock within the Indian Lesser Himalaya; secondly, to evaluate the effect of elevation on stable isotope contents of rainfall during the monsoon months of July and August to help assess the elevation of groundwater recharge areas; and thirdly, to determine the isotopic variability of rain, spring and stream waters at the scale of a “representative elementary watershed” (REW) to gain additional insight into the local groundwater flow system, along with daily measurements of the EC and temperature of spring water, seepage water and headwater stream water.
2 Study area
The study area lies in the rainfed headwaters of the Pashchimi Nayar River within the Pauri District in the Lesser Himalayas of northwest India (30°05′–30°07′N; 78°46′–78°48′E), about 12 km south of Pauri town. The 3.2 km2 Dugar Gad catchment, which is part of the Nayar headwater catchments, with elevations ranging between 1380 and 1920 m a.m.s.l., and drained by a perennial stream joined by several intermittent streams of lower order, was selected for detailed hydrogeological mapping and hydrological monitoring. The population, scattered over five villages, depends entirely on springs and seeps found at the base of the side-slopes for their daily water needs ().
The study area is underlain by stratified phyllites and quartzites of the Dudatoli group of Precambrian age (Kumar et al. Citation1974). The phyllites and quartzites are interlayered, foliated and heavily fractured. The oxidized saprolitic zone is thickest (up to 1 m) in the mid-slope parts of the mostly steep (>35%) slopes (see lower inset ). Soils consist of loamy sand whose thickness varies from a thin veneer on spurs to more than 1 m in foot-slope hollows where seepage zones tend to be concentrated (see ). Depending on elevation, the climate is subtropical to warm-temperate and dominated by the Indian Monsoon. The long-term average annual rainfall (1941–1990) for Pauri district is about 1540 mm, with the main monsoon season (June–September) contributing more than 80% (1280 mm) and the pre- (April–May) and post-monsoon (October–November) seasons and winter months (December–February) each contributing about equal amounts of rain (Indian Meteorological Department). Average seasonal temperatures vary from approx. 1°C (January) to 36°C (June), with average monthly relative humidity ranging between 12% during the pre-monsoon season and a maximum of near-100% during the main monsoon. Occasional snowfall occurred at the highest elevations of the catchment in December 2012. Vegetation on the (upper and middle) slopes of the elongated catchment is dominated by mature pine forest (Pinus roxburghii), while the central valley and foot-slopes consist of terraced agricultural lands which support two cropping seasons. In the central valley portion irrigated rice is cultivated during the rainy season, while wheat and mustard are grown during the winter season. Crops on the higher terraces are mostly rainfed rice and finger millet. However, as also observed across the state of Uttarakhand and elsewhere in the MMZ (Khanal and Watanabe Citation2006, Paudel et al. Citation2012), agricultural land use in the study area is undergoing rapid transformation, with traditional crops being replaced increasingly by fallow land due to outmigration to the plains.
3 Methodology
3.1 Geological and hydrogeological mapping
The Dugar Gad catchment was subjected to detailed geological mapping at a scale of 1:25 000, which included determination of the lithological and structural framework of the area, as well as measuring the dominant orientation of bedrock fractures and foliation present in the meta-sedimentary rocks. During the mapping, use was made of extensive exposures of rock present along roads and along the central perennial stream, as well as of any exposed outcrops. In addition, high-resolution (1:5000 scale) satellite data (Google Earth® Satellite Imagery and IRS-P6 LISS-IV, May 2008) were used. Given their hydrogeological importance, special attention was paid to identifying major tectonic features such as faults. Local smaller water resources, such as springs, seeps and near-perennial streams, were mapped as well. Various seeps present at the base of the hillslopes along the central riparian zone of the side valley that was studied in more detail (i.e. the REW, see ) represented the saturated zone within the bedrock. These acted as a reliable source of water during the driest summer months. The seeps referred to as K1and K3 turned into actively flowing wet-weather springs during the monsoon period, whereas seep K2 never started to flow fully.
3.2 Basic hydrological measurements
Rainfall was measured at five points within the Dugar Gad catchment, spanning an elevation range of 200 m (1454–1620 m a.m.s.l.; see for locations). Observations were made daily using collectors consisting of a 200 cm2 orifice and a 2-L container.
A 40-ha REW was selected within the Dugar Gad catchment, having a similar relief ratio (0.2) as the larger catchment and an elevation range of 1450–1660 m a.m.s.l. (). The REW was gauged with a 90-degree V-notch capable of accommodating a head of 0.45 m. The height of the water level behind the weir was measured daily and converted to discharge Q using Q = 1.417H2.5, where Q represents discharge in m3 s−1 and H the head in m. Although it was incised into the fractured bedrock below, the stream dried up for a brief period during the summer months of the dry years 2010 and 2012. Overall average discharge was 5.7 L s−1, with a maximum of 184 L s−1. Spring discharge was measured with a volume-calibrated bucket and stopwatch. The average of three daily readings was recorded. Average spring discharge during the 2010–2012 observation period was 0.22 L s−1, with a minimum of 0.003 L s−1, whereas during the monsoon period maxima of up to 1.7 L s−1 were recorded.
3.3 Stable isotope sampling and analysis, electrical conductivity and water temperature
Event-based rainfall samples were collected during the monsoon periods of 2010 and 2011 at the Ali, Palsain, Bhimlitali and Domatkhal stations (). Ninety-six rainfall samples were analysed for their stable isotope (δ18O and δ2H) content during the 2010 monsoon period (mid-June to September). Event-based sampling was also carried out from March to December 2011 at Palsain (1454 m a.m.s.l.) to understand the temporal variability in isotopic composition of precipitation throughout the year and to derive the local meteoric water line (LMWL). The LMWL represents the location-specific linear relationship between δ18O and δ2H present in the precipitation and is helpful in providing insight into the origin and interconnectedness of rain-dependent smaller water resources such as soil water and shallow groundwater (Gat Citation2000). A proportionally higher concentration of δ2H relative to δ18O is referred to as the d-excess value of a precipitation sample, defined as d = δ2H − 8δ18O (Dansgaard Citation1964). The d-excess value reflects the vapour source of the precipitation, with higher values indicating a greater influence of evaporation (Clark and Fritz Citation1997).
To examine the elevation effect on rainfall stable isotope signatures, rainfall was sampled at five different elevations ranging between 1380 and 1620 m a.m.s.l. during July and August 2011 (n = 150). Rainfall collectors with an orifice of 200 cm2 supported by a container of 2-L capacity were used. In the event of rainfall, the amount of rain was determined and a sample collected around 07:00–08:00 h, stored in a high-density polyethylene (HDPE) narrow-mouth bottle (15 mL) and kept in a cool dark place to avoid evaporation (Tarafdar Citation2016).
Sampling of the side-stream draining the REW was carried out at different frequencies, keeping in mind the bell-shaped distribution of flow as controlled by the monsoonal rainfall influx. A bi-weekly interval of sampling was applied during February, March, April, November and December, whereas weekly sampling was carried out during May, June, July, August, September and October. Additional event-based sampling was also conducted during the pre-monsoon and monsoon periods. The same sampling strategy was applied for studying spring-water isotopic variability; a total of 38 samples were analysed for the period between February and December 2011. The springs were also sampled on a weekly basis during the monsoon period of 2010. All precipitation, spring- and stream-water samples were analysed for δ18O and δ2H at the National Institute of Hydrology, Roorkee (India), using a dual inlet isotope ratio mass spectrometer (DIIRMS) for δ2H and a continuous flow isotope ratio mass spectrometer (CFIRMS) for δ18O following standard procedures (Epstein and Mayeda Citation1953, Brenninkmeijer and Morrison Citation1987). Measured values of δ2H and δ18O were expressed relative to VSMOW-II (Vienna Standard Mean Oceanic Water-II) and had a precision of ±1.0‰ for δ2H and ±0.1‰ for δ18O.
Electrical conductivity (EC), with temperature compensation at 25°C (in µS cm−1), and temperature (°C) were measured daily for spring and stream water and the three seeps using a conductivity meter (Eutech Instruments PCS Tester 35) from May 2011 to December 2012. Daily measurements of EC and weekly stable isotope values were plotted against corresponding discharges of the stream or spring from July to December to gain insight into the internal responses of the system at the scale of the REW. Temperature versus conductivity plots were drawn for spring, seepage and stream water for the February–December 2012 period to study possible inter-linkages between the respective systems.
3.4 Deriving the approximate elevation of groundwater recharge
The δ18O signature in precipitation tends to decrease with elevation due to depletion of the heavier isotopes and cooling effects as moist air masses rise (Dansgaard Citation1964). By inserting the mean isotopic value for spring water during the monsoon season into the equation describing the change in δ18O in monsoon rainfall with elevation (isotopic lapse rate), an estimate can be obtained of the elevation of the point of entry of the water on the mountain, thereby marking the approximate elevation of the groundwater recharge zone (Jeelani et al. Citation2010). In the present case, mean monthly isotopic values for monsoonal precipitation (July) and spring flow (August) were separated by a gap of one month to take into account the approximate transit time of the water (estimated at 30–53 days based on average post-monsoon spring flow recession rates; Farlin and Maloszewski Citation2013).
4 Results
4.1 Geological mapping
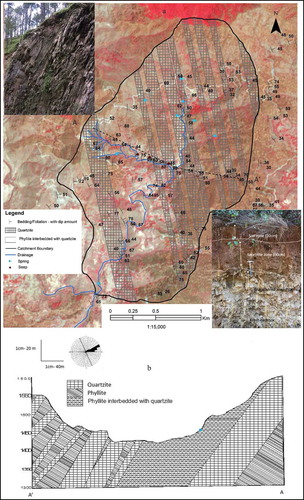
The major rock types in the study area were quartzites and phyllites of Precambrian age. Both rock types showed a predominantly NNE–SSE strike and could be mapped separately. In places, the quartzites were interlayered with thin bands of phyllites, where they were grouped together as quartzite interbedded with phyllites (). Bedding planes (S1) in the quartzites and schistosity (S2) in the phyllites were the most prominent penetrative planar structures observed. The schistosity was sub-parallel to the bedding. Plotting these planar structures in a rose diagram indicated a general NNW–SSE trend with a moderate- to high-angle dip towards the northeast (), with local variations due to minor faults or folds. No major faults were detected during the mapping. Two sets of joints were prominent in the massive quartzite, which varied in trend and dip direction. The first set of joints had a NW–SE strike that dipped 55°–87° towards the northeast, while the second set of joints exhibited a NE–SW strike, dipping 47°–85° towards the northwest. The cross-sectional diagram along the transect line between points A and A′ (see ) for location) further illustrates the main lithological contacts and their main dip directions ()).
Figure 2. (a) Simplified geological map of the study area showing the strike and dip direction of dominant lithological strata. The background satellite image of IRS-P6 LISS-IV was taken in May 2008. The two inset photographs show: (bottom right) the typical sequence of soil, saprolite, lightly weathered rock and fresh rock (quartzite); and (top left) phyllites interbedded with quartzites, with steeply inclined schistosity and fractures that may act as preferential flow paths. (b) Geological cross-section along the A–A′ transect of showing interbedded quartzite and phyllite lithology and dominant dip direction of bedrock (NE) as indicated by the rose diagram. Location of spring outflow point indicated by the (blue) dot.
4.2 Precipitation variability
The year 2009 was a moderately dry year during which the study area received only 590 mm of rainfall during the ISM, which was 46% less than the long-term average for Pauri District. In 2010, an excess monsoon year, 1500 mm of monsoonal rain was recorded in the study area with a total annual rainfall of 1780 mm. The year 2011 was a year with normal rainfall, in which 1020 mm was measured against a long-term monsoonal average of 1280 mm. In 2012, the monsoon was delayed, with only 57% of the long-term monsoonal amount of rain being recorded (i.e. 740 mm) and a low annual total of 800 mm.
4.3 Isotopic characteristics of precipitation
The stable isotopic variability of rainfall samples collected at the Palsain (1454 m a.m.s.l.) and Domatkhal (1620 m a.m.s.l.) stations for the monsoon period of 2010 is shown in . The monsoon rainfall signature for δ18O ranged from +3.64‰ to −19.77‰, while δ2H values were between +38.4‰ and −146.9‰ (). More enriched isotopic values in rainwater typically represented the onset of the southwest monsoon in mid-June, while the most depleted values were associated with the late phase of the monsoon (September). The overall volume-weighted mean δ18O value of the rainwater was −13.13‰ and that of δ2H, −92.9‰. Rainfall samples collected during the (normal) monsoon of 2011 ranged between −1.96‰ and −17.67‰ for δ18O versus −4.4‰ and −131.6‰ for δ2H. Samples taken during the (very wet) 2010 monsoon displayed greater variability in stable isotope values compared to those in 2011. Pre-monsoon rainwater collected at Palsain in 2011 showed enriched volume-weighted mean isotopic values, for both δ18O (–0.68‰, range −6.26 < δ18O < 4.70) and δ2H (+6.0‰, range −38.2 < δ2H < 44.1). Corresponding overall weighted mean values for the annual rainfall were −9.55‰ for δ18O and −67.0‰ for δ2H. An average depletion of −0.3‰ per 100 m rise in elevation was observed for δ18O in rainfall samples collected during July and August 2011.
Table 1. Summary of stable isotope signatures (δ18O and δ2H) at Dugar Gad in rainfall, stream water and spring water in 2010 and 2011. n denotes the number of samples. Monsoon: mid-June to mid-September; pre-monsoon: March to mid-June. Min: minimum; Max: maximum.
The local meteoric water line (LMWL) depicting the relationship between δ18O and δ2H in precipitation was generated using monsoon rainfall data for 2010, as measured at Palsain and Domatkhal, plus data for five different elevations during the monsoon months of July and August in 2011, as well as year-round data for one location (Palsain) for 2011. The following overall LMWL was obtained: δ2H = 8.20δ18O + 11.27 (R2 = 0.992, n = 284; ). The monsoonal data for 2011 gave an LMWL of δ2H = 8.27δ18O + 12.43 (R2 = 0.994, n = 164), whereas the non-monsoon period data (primarily pre-monsoon rainfall and a single winter rainfall) gave δ2H = 7.05δ18O + 9.72 (R2 = 0.944, n = 20). The LMWL derived for monsoon rainfall in 2010 – δ2H = 8.14δ18O + 13.65 (R2 = 0.987, n = 51) – did not differ much from that derived for 2011. The regional meteoric water line developed for the adjacent western Himalaya (δ2H = 7.95δ18O + 11.51; Kumar et al. Citation2010) compares well with the presently derived LMWL.
4.4 Isotopic characteristics of spring and stream water
shows the isotopic variability of stream-water samples in 2011 was much more pronounced than the isotopic content of spring flow. Stream-water δ18O values ranged from −10.56‰ to −5.82‰, with an average of −8.34‰, whereas δ2H values ranged from −75.2‰ to −38.7‰, with an annual average value of −58.8‰. The spring-flow samples showed a similar pattern but over a narrower seasonal range (−10.40‰ to −8.15‰), with an average value of −8.85‰ (i.e. more depleted than that observed for stream water). The spring- and stream-water isotope data plotted very close to, but slightly below, the local meteoric water line for 2011 (see ). The observed range of isotopic contents of spring and stream water is listed in .
4.5 Deuterium excess
The monsoonal rainfall data collected during the year 2010 showed d-excess values ranging between 6.83‰ and 20.36‰, with an overall median value of 11.66‰. Excess values for the precipitation samples collected at Palsain station during the monsoon of 2011 ranged between 6.34‰ and 15.45‰, with a median value of 10.14‰ (). Surprisingly, the pre-monsoon rainfall during the months of April and May 2011 had equal median values (close to 10‰), but actual values ranged considerably (between −2.07‰ and 17.20‰). A single record of winter rainfall showed a d-excess value of −6.34‰ ().
Figure 3. Temporal variation of (a) rainfall amount, (b) stable isotope content (δ18O), and (c) d-excess values in precipitation at Palsain station (1454 m a.m.s.l.) based on event sampling during the monsoon period of 2010 and year-round (March–December) sampling in 2011.
5 Discussion
5.1 Isotopic variability in precipitation, spring and stream water
The δ18O and δ2H values in precipitation samples exhibited a very close relationship (), even though rainfall showed enriched isotopic signatures during the pre-monsoon (and for a single winter sample) and gradually more depleted values from July onwards as the monsoon progressed (). This phenomenon, which has been reported for various locations across the Indian sub-continent (e.g. Breitenbach et al. Citation2010, Krishan et al. Citation2014a, Citation2014b) likely reflects the increase in the distance travelled by the monsoonal air masses originating above the Bay of Bengal and (less frequently) the Arabian Sea (Sengupta and Sarkar Citation2006, Breitenbach et al. Citation2010, Krishan et al. Citation2014a, Tarafdar Citation2016). Plots of δ18O versus d-excess values showed considerable variability for monsoon rainfall, but the scatter was especially great for non-monsoon rainfall (mostly pre-monsoon samples and a single event of winter rainfall; ). Such variation may well be caused by contrasting storm tracks and air mass origins (e.g. the Mediterranean for winter and early pre-monsoon rains associated with western disturbances; Krishan et al. Citation2014a, Citation2014b), although the influence of locally condensed orographic clouds cannot be ruled out (Kumar et al. Citation2010, see also Scholl et al. Citation2007).
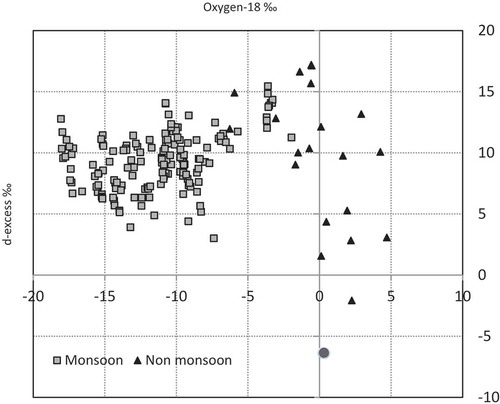
Figure 4. Variation in δ18O and δ2H contents in rainfall at Dugar Gad for the monsoon periods of 2010 and 2011 as well as the non-monsoon period of 2011. The local meteoric water line (LMWL) is shown for the monsoon of 2011 along with the weighted mean isotopic values for annual, monsoon and non-monsoon rainfall, as well as the mean annual values for spring and stream water in the REW in 2011. The region demarcated by the dotted line represents the dominant monsoonal isotopic signature, and that by the continuous line the dominant non-monsoonal isotopic signature.
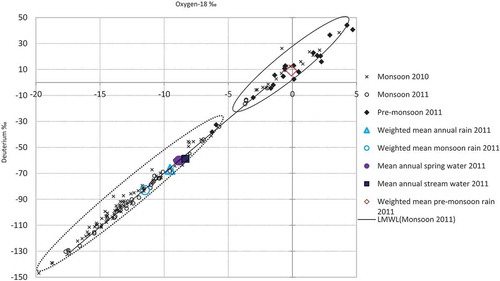
As shown in , the overall mean values of spring- and stream-water isotopic contents fell only slightly below the LMWL, indicating little evaporative enrichment of monsoon rainfall during infiltration, as can be expected in view of the very high humidity and low radiation levels prevailing during the main monsoon months (Ghimire et al. Citation2014b, Tarafdar Citation2016). Indeed, in humid temperate regions, groundwater isotopic compositions tend to follow the meteoric water line very closely (Abbott et al. Citation2000, Oxtobee and Novakowski Citation2002). The slope of the regression line linking the δ18O and δ2H values in either stream water (7.74) or spring water (7.78) at Dugar Gad is close to the slope of the LMWL (8.2), while the annual volume-weighted mean isotopic contents of rainfall and stream water differed by only 1.21‰ (). This shift decreased even further (to <1‰) when comparing the mean annual signatures for rainfall and spring water (). This very small difference between the overall annual means for streamflow and spring flow (−8.34‰ and –8.85‰ δ18O, respectively) suggests the second-order streams of the sub-catchment (REW) were dominated by hillslope groundwater and riparian groundwater, although the greater seasonal variability observed for δ18O in the stream water must reflect contributions by (near-)surface sources during times of high rainfall (see ). Indeed, the fact that the mean annual spring-flow and streamflow isotopic contents plotted more closely to the volume-weighted annual mean of precipitation than to the weighted mean of monsoonal rainfall () may indicate the mixing of new (monsoonal) water with isotopically enriched older (pre-monsoonal) water already present (see McDonnell Citation1990), or, alternatively, rapid preferential recharge by isotopically enriched rainfall during intensive non-monsoonal storm events (see Jasechko and Taylor Citation2015). At any rate, illustrates the strong influence exerted by the large monsoonal input on spring- and stream-water isotopic signatures, as has also been reported for other monsoon-dominated regions (e.g. Lee et al. Citation1999). Applying a mass-balance approach in which weighted mean isotopic signatures for monsoon- and dry-season precipitation were compared with annual average groundwater signatures of spring and stream water for the year 2011, suggested monsoonal rainfall contributed as much as 70–75% to overall groundwater recharge.
Figure 5. Temporal variability of (a) rainfall, spring and stream discharge in the REW, (b) stable isotope content (δ18O) of spring flow (green line) and streamflow (blue line), and (c) electrical conductivity of spring and streamflow during the year 2011.
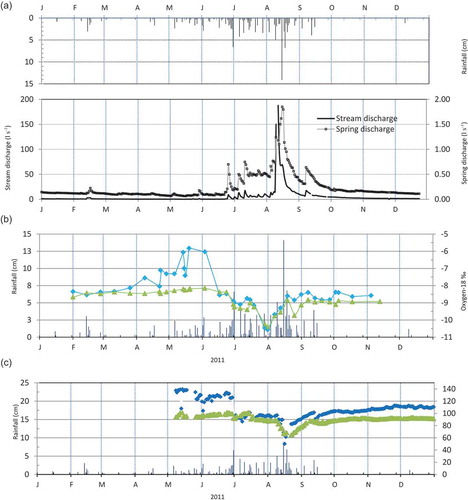
Figure 6. Plot of δ18O content versus d-excess values for monsoon and pre-monsoon rainfall at Dugar Gad for the year 2011. Solid circle indicates a single winter event sample.
The time series data shown in further show the seasonal response of streamflow to rainfall to be more pronounced than that of spring flow, in terms of both stable isotope content and EC. The contrast was observed both during the pre-monsoonal months and during the influx of monsoonal rainfall. Such seasonal variability of stable isotope contents in stream- and spring flows ()) suggests the respective groundwater bodies have limited storage capacity, while the pronounced variability in pre-monsoon stream-water isotopic content in particular is indicative of fast recharge of riparian groundwater during intensive rainfall, most likely via preferential flow through the highly fractured meta-sedimentary bedrock where it is overlain by relatively shallow soil (see insets in ).
Both the isotopic and EC responses to seasonal rainfall revealed a clear flushing phase during the pre-monsoon summer period (with enriched isotopic signatures and enhanced values of electrical conductivity EC), followed by a dilution phase during the rising limb of the seasonal hydrograph (with depletion of stable isotopes and lower EC values), and subsequently by a recovery phase during the latter part of the monsoon (mid-August–mid-September) towards more constant values of stable isotopes and EC ( and ). The flushing phase may be interpreted as pre-monsoon rainfall pushing out older shallow groundwater stored in, most likely, the fractured meta-sedimentary rock in the riparian zone, as also reported for other mountainous regions (e.g. Iwagami et al. Citation2010). The contrasting EC and isotopic patterns for spring flow and streamflow might thus indicate a piston flow-dominated recharge mechanism for the springs, with an intermittent rapid preferential flow component added for the streamflow. In the following, seasonal patterns of EC and temperature of seepage and spring water are discussed in more detail.
5.2 Seasonal stream, spring and seepage solute concentrations and temperatures
Plots of solute concentrations versus discharge during the monsoonal rising limb of the seasonal hydrograph and the subsequent recession phase during the post-monsoon season may elucidate the underlying factors controlling the behaviour of possibly different aquifer systems feeding springs and streamflow in the study area (see Evans and Davies Citation1998). Linking daily EC values to corresponding discharges between July and December (i.e. the monsoon, post-monsoon transition and early winter season) displayed a clockwise hysteresis for spring flow with higher concentrations during the rising limb of the seasonal hydrograph (), whereas that for the stream showed a counter-clockwise hysteresis loop with higher concentrations observed during the falling limb ()). As such, the response of streamflow appeared to lag behind that of spring flow during the rising limb of the seasonal hydrograph ()). A possible reason for the higher solute concentrations in stream water during the falling limb of the seasonal hydrograph could be a delayed influx during the post-monsoon period of deeper, more concentrated water originating in more distant parts higher up in the catchment (see )). By contrast, solute concentrations in spring flow – which is possibly fed by a smaller and shallower, perched aquifer system – reached equilibrium (steady-state condition) much more rapidly (i.e. already by early September; )).
Figure 7. Plots of (a) spring discharge and (b) stream discharge against electrical conductivity, and (c) spring versus stream discharge (both in L s−1) for the REW during the rising and falling limbs of the seasonal hydrograph. Arrows indicate clockwise or counter-clockwise hysteresis.
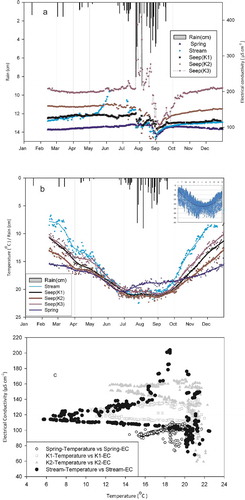
Similarly, plotting year-round EC and temperature data of spring, seepage and stream waters against each other ( and ) not only illustrated the wide variability between, but also the uniqueness of, the respective systems operating even at the scale of the REW (). Both solute concentrations (EC) and temperatures of spring flow exhibited the smallest variation with time as compared to stream water and seeps. By contrast, the seasonal trends for stream water and air temperatures (as measured at Palsain) were very similar, whereas the temperatures of seepage water were intermediate between those of spring and stream water ()). Interestingly, a plot of temperature versus EC of spring, stream and seepage waters (seeps K1 and K2, )) shows values for the two seeps to fall largely within the bounds of the stream’s EC–temperature range, which may indicate a possible interconnectedness between the two systems (e.g. hillslope and riparian groundwater). By contrast, values for the spring water fall mostly outside the range observed for stream water ()), while the straight line linking the EC and temperature values of spring water may be interpreted as representing a linear mixing of two different components (e.g. new rainwater and old perched groundwater). Thus, the seeps are likely to be fed by hillslope groundwater, and the stream by a mixture of riparian groundwater, inflow from the side slopes, as well as intermittent overland flow and rapid preferential recharge during intensive storms, together resulting in the roughly triangular shape of the EC–temperature relationship for stream water ()).
Figure 8. Time series of (a) electrical conductivity and (b) temperature of spring, stream and seepage (K1, K2 and K3) waters in the REW between mid-February and December 2012. Inset shows mean daily air temperature as measured at 1454 m a.m.s.l. (c) Plot of water temperature versus electrical conductivity of spring, stream and seepage (K1 and K2) waters.
5.3 Estimated elevation of groundwater recharge
The oxygen isotope contents in monsoonal precipitation at Dugar Gad showed a distinct altitudinal effect of −0.6‰ per 100 m rise in elevation (R2 = 0.938) in July 2011 versus −0.2‰ per 100 m (R2 = 0.377) in August 2011. As such, the correlation for the July data was very strong, while the altitudinal isotopic decline for rainfall sampled in August was statistically insignificant at the 95% confidence level. Next, the approximate recharge elevation of the local spring system was inferred from the equation describing the lapse rate for δ18O in July rainfall (H = −141.4δ18O + 149.8, where H is elevation in m a.m.s.l.) by inserting the mean isotopic value of spring water for August rather than July into the equation (). This was done to take the approximate transit time of the water (see Farlin and Maloszewski Citation2013) into account. An approximate recharge elevation of 1525 m a.m.s.l. was obtained in this way (). Taking the most depleted δ18O value observed for 2011 monsoonal rainfall instead suggested an alternative approximate recharge elevation of 1620 m a.m.s.l. (). Stream and spring waters showed very similar monthly average isotopic values during the monsoon period ()), suggesting equally similar recharge zones. Thus, springs and lower-order streams in the study area are likely to be sustained by local groundwater systems originating within the immediate topographic divide (see ).
Figure 9. Derivation of the approximate groundwater recharge elevation at Dugar Gad (REW) based on the rate of decline with elevation of δ18O in precipitation in July 2011. Average monthly isotopic values of spring water are shown for July and August. Note that the value for July plots above the best-fit line due to the time lag between rainfall and spring discharge (see text for explanation). The arrow indicates the probable maximum recharge elevation.
5.4 Towards a conceptual hydrogeological model for Lesser Himalayan headwaters
The moderately to steeply dipping meta-sedimentary rocks of the study area showed a predominantly northeast dip, suggesting groundwater flow to be mainly in this direction (). Three hydrological systems were distinguished at the scale of the REW, namely, low-order streams, springs and seepage zones at the base of the hillsides (). Continuous records of EC and temperatures of spring and stream water suggested spring flow to be fed by hillslope groundwater, whereas streamflow from the REW received contributions from both hillslope and shallow riparian groundwater bodies. The foot-slope seeps represented local permanently saturated pockets within the fractured bedrock receiving groundwater from the hillslope domain. Records of EC and temperature throughout the year further showed that these three hydrological systems maintained their individual characteristics even during the massive precipitation influx associated with the monsoon, thereby suggesting limited interconnection between the respective systems. Strong variability in stable isotope values of stream water (but not spring flow; )) during the pre-monsoon period suggested rapid recharge of shallow riparian groundwater via penetration along dominant bedding planes and fractures during intensive rainfall events (see top-left inset in ). Combining average mid-monsoonal spring- and stream-water isotope signatures with information on the isotopic decline of monsoon precipitation with elevation allowed evaluation of the approximate elevation of hillslope groundwater recharge. All water emerging as spring flow and streamflow was inferred to have originated within the REW.
6 Conclusions
Detailed geological mapping of the study catchment showed the dominant dip direction of the rock strata to be northeast. Using mid-monsoon spring- and stream-water isotopic signatures and information on the isotopic lapse rate for monsoon precipitation with elevation, it was established that all spring flow and streamflow originated within the borders of the study catchment. Based on isotopic mass balance computations it was estimated that roughly 70–75% of the annual outflow from the spring and stream was provided by monsoonal rainfall and the remainder (mostly) by pre-monsoonal rainfall. Pronounced pre-monsoonal fluctuations in stream-water (less for spring-water) isotopic contents suggested rapid recharge of the shallow riparian aquifer during intensive pre-monsoonal storms. These findings have important implications for guiding and locating measures for source area protection. Spring flow was fed primarily by (perched) hillslope groundwater, while headwater streamflow received contributions from hillslope and shallow riparian groundwater bodies alike. The foot-slope seeps represented permanently saturated pockets of fractured bedrock receiving groundwater from the hillslope domain above them. The seasonal variability in isotopic content and EC response to rainfall suggested the respective aquifers to have limited capacity, with spring flow showing a faster response to rainfall than headwater streamflow. Pertinently, even during the monsoon season with its massive rainfall inputs, the respective water resource units (spring, stream, seeps) retained their individual character, as shown by their distinct EC and temperature patterns. As such, the respective units exhibited no clear interconnectedness.
Acknowledgments
Dr L.M.S. Palni, former Director of the G.B. Pant National Institute of Himalayan Environment and Sustainable Development is acknowledged for his support and encouragement. The paper benefited from the constructive and incisive criticisms received from two anonymous reviewers.
Disclosure statement
No potential conflict of interest was reported by the authors.
Additional information
Funding
References
- Abbott, M.D., Lini, A., and Bierman, P.R., 2000. δ18O, δD and 3 H measurements constrain groundwater recharge patterns in an upland fractured bedrock aquifer, Vermont, USA. Journal of Hydrology, 228 (1), 101–112. doi:10.1016/S0022-1694(00)00149-9
- ACWADAM, 2017. Sindhupalchok spring hydrogeology. Pune, India: Advanced Centre for Water Resources Development and Management, 20. Report ACWA/HYDRO/2017/H51.
- Andermann, C. H., et al., 2012. Impact of transient groundwater storage on the discharge of Himalayan rivers. Nature Geoscience, 5, 127–132. doi:10.1038/ngeo1356
- Banks, E.W., et al., 2009. Fractured bedrock and saprolite hydrogeologic controls on groundwater/surface-water interaction: a conceptual model (Australia). Hydrogeology Journal, 17 (8), 1969–1989. doi:10.1007/s10040-009-0490-7
- Basistha, A., Arya, D.S., and Goel, N.K., 2009. Analysis of historical changes in rainfall in the Indian Himalayas. International Journal of Climatology, 29, 555–572. doi:10.1002/joc.v29:4
- Bookhagen, B. and Burbank, D.W., 2006. Topography, relief, and TRMM-derived rainfall variations along the Himalaya. Geophysical Research Letters, 33, L08405.
- Bookhagen, B. and Burbank, D.W., 2010. Toward a complete Himalayan hydrological budget: spatiotemporal distribution of snowmelt and rainfall and their impact on river discharge. Journal of Geophysical Research, 115, F03019. doi:10.1029/2009JF001426
- Breitenbach, S.F., et al., 2010. Strong influence of water vapor source dynamics on stable isotopes in precipitation observed in Southern Meghalaya, NE India. Earth and Planetary Science Letters, 292, 212–220. doi:10.1016/j.epsl.2010.01.038
- Brenninkmeijer, C.A.M. and Morrison, P.D., 1987. An automated system for isotopic equilibration of CO2 and H2O for 18-O analysis of water. Chemical Geology: Isotope Geoscience Section, 66, 21–26.
- Cheng, Y., Ogden, F.L., and Zhu, J., 2017. Earthworms and tree roots: a model study of the effect of preferential flow paths on runoff generation and groundwater recharge in steep, saprolitic tropical lowland catchments. Water Resources Research, 53, 5400–5419. doi:10.1002/2016WR020258
- Clark, I.D. and Fritz, P., 1997. Environmental isotopes in hydrogeology. Boca Raton, FL: Lewis Publishers.
- Dahl, M., et al., 2007. Review of classification systems and new multiple-scale typology of groundwater-surface water interaction. Journal of Hydrology, 344, 1–16. doi:10.1016/j.jhydrol.2007.06.027
- Dansgaard, W., 1964. Stable isotopes in precipitation. Tellus, 16, 436–468. doi:10.3402/tellusa.v16i4.8993
- Desmarais, K. and Rojstaczer, S., 2002. Inferring source waters from measurements of carbonate spring response to storms. Journal of Hydrology, 260, 118–134. doi:10.1016/S0022-1694(01)00607-2
- Epstein, S. and Mayeda, T., 1953. Variation of O-18 content of waters from natural sources. Geochimica et cosmochimica acta, 4, 213–224. doi:10.1016/0016-7037(53)90051-9
- Evans, C. and Davies, T.D., 1998. Causes of concentration/discharge hysteresis and its potential as a tool for analysis of episode hydrochemistry. Water Resources Research, 34, 129–137. doi:10.1029/97WR01881
- Farlin, J. and Maloszewski, P., 2013. On the use of spring baseflow recession for a more accurate parameterization of aquifer transit time distribution functions. Hydrology and Earth System Sciences, 17, 1825–1831. doi:10.5194/hess-17-1825-2013
- Gabrielli, C.P., McDonnell, J.J., and Jarvis, W.T., 2012. The role of bedrock groundwater in rainfall–runoff response at hillslope and catchment scales. Journal of Hydrology, 450, 117–133. doi:10.1016/j.jhydrol.2012.05.023
- Gat, J.R., 2000. Atmospheric water balance: the isotopic perspective. Hydrological Processes, 14, 1357–1369. doi:10.1002/1099-1085(20000615)14:8<1357::AID-HYP986>3.0.CO;2-7
- Gerrard, A.J. and Gardner, R.A.M., 2002. Relationships between runoff and land degradation on non-cultivated land in the Middle Hills of Nepal. International Journal of Sustainable Development and World Economy, 9, 59–73. doi:10.1080/13504500209470103
- Ghimire, C.P., et al., 2014a. The effects of sustained forest use on hillslope soil hydraulic conductivity in the Middle Mountains of Central Nepal. Ecohydrology, 7, 478–495. doi:10.1002/eco.1367
- Ghimire, C.P., et al., 2014b. Transpiration, canopy conductance and decoupling coefficient of two contrasting forest types in the Lesser Himalaya of Central Nepal. Agricultural and Forest Meteorology, 197, 76–90. doi:10.1016/j.agrformet.2014.05.012
- Goderniaux, P., et al., 2013. Partitioning a regional groundwater flow system into shallow local and deep regional flow compartments. Water Resources Research, 49, 2274–2286. doi:10.1002/wrcr.20186
- Haria, A.H. and Shand, P., 2004. Evidence for deep sub-surface flow routing in forested upland Wales: implications for contaminant transport and stream flow generation. Hydrology and Earth System Sciences Discussions, 8, 334–344. doi:10.5194/hess-8-334-2004
- Haria, A.H. and Shand, P., 2006. Near-stream soil water–groundwater coupling in the headwaters of the Afon Hafren, Wales: implications for surface water quality. Journal of Hydrology, 331, 567–579. doi:10.1016/j.jhydrol.2006.06.004
- Hessel, R., et al., 2007. Rainfall, soil moisture content and runoff in a small catchment in the Indian Himalayas. International Journal of Ecology and Environmental Sciences, 33 (2–3), 115–128.
- Hugenschmidt, C., et al., 2014. A three-component hydrograph separation based on geochemical tracers in a tropical mountainous headwater catchment in northern Thailand. Hydrology and Earth System Sciences, 18, 525–537. doi:10.5194/hess-18-525-2014
- ICIMOD, 2015. Reviving the drying springs. Reinforcing social development and economic growth in the Mid-Hills of Nepal Issue Brief, February 2015. Kathmandu, Nepal: ICIMOD, 6.
- Iwagami, S., et al., 2010. Role of bedrock groundwater in the rainfall–runoff process in a small headwater catchment underlain by volcanic rock. Hydrological Processes, 24 (19), 2771–2783. doi:10.1002/hyp.7690
- James, E.R., et al., 2000. The use of temperature and the isotopes of O, H, C, and noble gases to determine the pattern and spatial extent of groundwater flow. Journal of Hydrology, 237, 100–112. doi:10.1016/S0022-1694(00)00303-6
- Jasechko, S. and Taylor, R.G., 2015. Intensive rainfall recharges tropical groundwaters. Environmental Research Letters, 10 (12), 124015. doi:10.1088/1748-9326/10/12/124015
- Jeelani, G., Bhat, N.A., and Shivanna, K., 2010. Use of δ 18 O tracer to identify stream and spring origins of a mountainous catchment: a case study from Liddar watershed, western Himalaya, India. Journal of Hydrology, 393, 257–264. doi:10.1016/j.jhydrol.2010.08.021
- Kadekodi, G.K., Murthy, K.S.R., and Kumar, K., eds., 2000. Water in Kumaon: ecology, value and rights. Nainital, India: Gyanodaya Prakashan Press, 127–153.
- Khanal, N.R. and Watanabe, T., 2006. Abandonment of agricultural land and its consequences. A case study in the Siles area, Gandaki Basin, Nepal Himalaya. Mountain Research and Development, 26, 32–40. doi:10.1659/0276-4741(2006)026[0032:AOALAI]2.0.CO;2
- Krishan, G., et al., 2014b. Isotopic observations from two stations of North India to investigate geographical effects on seasonal air moisture. Journal of Earth Science & Climatic Change, 5, 180. doi:10.4172/2157-7617.1000180
- Krishan, G., Rao, M.S., and Kumar, C.P., 2014a. Isotope analysis of air moisture and its applications in hydrology. Journal of Climatology & Weather Forecasting, 2, 106. doi:10.4172/2332-2594.1000106
- Kumar, B., et al., 2010. Isotopic characteristics of Indian precipitation. Water Resources Research, 46 (12), W12548. doi:10.1029/2009WR008532
- Kumar, G., Prakash, G., and Singh, K.N., 1974. Geology of Deoprayag-Dwarahat area, Gahrwal, Chamoli and Almora districts, Kumaun Himalaya, Uttar Pradesh. Himalayan Geology, 4, 321–346.
- Kumar, K., Raat, D.S., and Joshi, R., 1997. Chemistry of springwater in Almora, Central Himalaya. Environmental Geology, 31, 150–156. doi:10.1007/s002540050174
- Kurtz, A.C., Lugolobi, F., and Salvucci, G., 2011. Germanium-silicon as a flow path tracer: application to the Rio Icacos watershed. Water Resources Research, 47, W06516. doi:10.1029/2010WR009853
- Lee, K.S., Wenner, D.B., and Lee, I., 1999. Using H-and O-isotopic data for estimating the relative contributions of rainy and dry season precipitation to groundwater: example from Cheju Island, Korea. Journal of Hydrology, 222, 65–74. doi:10.1016/S0022-1694(99)00099-2
- Mahamuni, K. and Kulkarni, H., 2011. Hydrogeological action research for spring recharge and development and hill-top lake restoration in parts of Southern District, State of Sikkim, India. Pune, India: Advanced Center for Water Resources Development and Management, 43. Report ACWA/Hydro/2011/H20.
- Manga, M., 2001. Using springs to study groundwater flow and active geologic processes. Annual Review of Earth and Planetary Sciences, 29 (1), 201–228. doi:10.1146/annurev.earth.29.1.201
- McDonnell, J.J., 1990. A rationale for old water discharge through macropores in a steep, humid catchment. Water Resources Research, 26, 2821–2832. doi:10.1029/WR026i011p02821
- McGlynn, B.L., McDonnel, J.J., and Brammer, D.D., 2002. A review of the evolving perceptual model of hillslope flowpaths at the Maimai catchments, New Zealand. Journal of Hydrology, 257, 1–26. doi:10.1016/S0022-1694(01)00559-5
- Mulholland, P.J., 1993. Hydrometric and stream chemistry evidence of three storm flowpaths in Walker Branch Watershed. Journal of Hydrology, 151, 129–316. doi:10.1016/0022-1694(93)90240-A
- Negi, G.C.S., et al., 1998. Spring sanctuary development to meet household water demand in the mountains: a call for action. In: D.K. Agrawal, ed. Research for mountain development: some initiatives and accomplishments. Nainital, India: Gyanodya Prakashan Press, 25–48.
- Noguchi, S., et al., 1999. Morphological characteristics of macropores and the distribution of preferential flow pathways in a forested slope segment. Soil Science Society of America Journal, 63, 1413–1423. doi:10.2136/sssaj1999.6351413x
- Onda, Y., et al., 2001. The role of subsurface runoff through bedrock on storm flow generation. Hydrological Processes, 15, 1693–1706. doi:10.1002/hyp.234
- Onda, Y., et al., 2006. Runoff generation mechanisms in high-relief mountainous watersheds with different underlying geology. Journal of Hydrology, 331, 659–673. doi:10.1016/j.jhydrol.2006.06.009
- Oxtobee, J.P. and Novakowski, K., 2002. A field investigation of groundwater/surface water interaction in a fractured bedrock environment. Journal of Hydrology, 269, 169–193. doi:10.1016/S0022-1694(02)00213-5
- Paudel, K.P., Dahal, D., and Shah, R., 2012. Abandoned agricultural land in Mid Hills of Nepal: status, causes and consequences. Kathmandu, Nepal: IUCN Nepal, 42.
- Qazi, N.Q., et al., 2017. Impact of forest degradation on streamflow regime and runoff response to rainfall in the Garhwal Himalaya, Northwest India. Hydrological Sciences Journal. doi:10.1080/02626667.2017.1308637
- Rahman, H., et al., 2012. An analysis of past three decade weather phenomenon in the mid-hills of Sikkim and strategies for mitigating possible impact of climate change on agriculture. In: H. Rahman, ed. Climate change in Sikkim: patterns, impacts and initiatives. Gangtok, India: Information and Public Relations Department, Government of Sikkim, 19–48.
- Rawat, J.S., et al., 2016. Perennial to ephemeral transformation of a Lesser Himalayan watershed. Current Science, 111, 686–693. doi:10.18520/cs/v111/i4/686-693
- Salve, R., Rempe, D.M., and Dietrich, W.E., 2012. Rain, rock moisture dynamics, and the rapid response of perched groundwater in weathered, fractured argillite underlying a steep hillslope. Water Resources Research, 48, 11. doi:10.1029/2012WR012583
- Sarkar, R. and Dutta, S., February 2012. Field investigation and modelling of rapid subsurface stormflow through preferential pathways in a vegetated hillslope of Northeast India. Journal of Hydrologic Engineering, 17, 333–341. doi:10.1061/(ASCE)HE.1943-5584.0000431
- Scholl, M.A., et al., 2007. Cloud water in windward and leeward mountain forests: the stable isotope signature of orographic cloud water. Water Resources Research, 43, W12411. doi:10.1029/2007WR006011
- Schreier, H., Brown, S., and MacDonald, J.R., 2006. Too little and too much: water and development in a Himalayan watershed. Vancouver, Canada: Institute for Resources and Environment, University of British Columbia, 238.
- Sengupta, S. and Sarkar, A., 2006. Stable isotope evidence of dual (Arabian Sea and Bay of Bengal) vapour sources in monsoonal precipitation over north India. Earth and Planetary Science Letters, 250, 511–521. doi:10.1016/j.epsl.2006.08.011
- Tague, C. and Grant, G.E., 2004. A geological framework for interpreting the low-flow regimes of Cascade streams, Willamette River Basin, Oregon. Water Resources Research, 40, W04303. doi:10.1029/2003WR002629
- Tambe, S., et al., 2012. Reviving dying springs: climate change adaptation experiments from the Sikkim Himalaya. Mountain Research and Development, 32, 62–72. doi:10.1659/MRD-JOURNAL-D-11-00079.1
- Tarafdar, S., 2013. Understanding the dynamics of high and low spring flow: a key to managing the water resources in a small urbanized hillslope of Lesser Himalaya, India. Environmental Earth Sciences, 70, 2107–2114. doi:10.1007/s12665-011-1493-y
- Tarafdar, S., 2016. The study of spatial distribution of precipitation and stable isotope content in a mountainous watershed of the Mid-Himalaya, Northern India from short- term records of monsoon period. Journal of Hydrogeology & Hydrologic Engineering, 5. doi:10.4172/2325-9647.1000138
- Tóth, J.A., 1963. A theoretical analysis of groundwater flow in small drainage basins. Journal of Geophysical Research, 68, 4795–4812. doi:10.1029/JZ068i016p04795
- Tromp-van Meerveld, H.J. and McDonnell, J.J., 2006a. Threshold relations in subsurface stormflow: 1. A 147-storm analysis of the Panola hillslope. Water Resources Research, 42, W02410. doi:10.1029/2004WR003778
- Tromp-van Meerveld, H.J. and McDonnell, J.J., 2006b. Threshold relations in subsurface stormflow: 2. The fill and spill hypothesis. Water Resources Research, 42, W02411. doi:10.1029/2004WR003800
- Uchida, T., Kosugi, K.I., and Mizuyama, T., 2002. Effects of pipe flow and bedrock groundwater on runoff generation in a steep headwater catchment in Ashiu, central Japan. Water Resources Research, 38, 7. doi:10.1029/2001WR000261
- Uchida, T., Kosugi, K.I., and Mizuyama, T., 2004. Role of upslope soil pore pressure on lateral subsurface storm flow dynamics. Water Resources Research, 40, 12. doi:10.1029/2003WR002139
- Uchida, T., Tromp-van Meerveld, H.J., and McDonnell, J.J., 2005. The role of lateral pipe flow in hillslope runoff response: an intercomparison of non-linear hillslope response. Journal of Hydrology, 311, 117–133. doi:10.1016/j.jhydrol.2005.01.012
- Valdiya, K.S. and Bartarya, S.K., 1989. Diminishing spring discharges in a part of Kumaun Himalaya. Current Science, 58, 417–426.
- Valdiya, K.S. and Bartarya, S.K., 1991. Hydrogeological studies of springs in the catchment of the Gaula river, Kumaun Lesser Himalaya, India. Mountain Research and Development, 11, 239–258. doi:10.2307/3673618
- Wester, R.G.C., 2013. Feasibility of assessing water scarcity with 3R-techniques in the Salyan District in the Middle Mountains of western Nepal. Thesis (MSc). Amsterdam, The Netherlands: VU University, 164 p.
- Winter, T.C., Rosenberry, D.O., and LaBaugh, J.W., 2003. Where does the ground water in small watersheds come from? Ground Water, 41, 989–1000. doi:10.1111/gwat.2003.41.issue-7
- Zomer, R.J., et al., 2014. Projected climate change impacts on spatial distribution of bioclimatic zones and ecoregions within the Kailash Sacred Landscape of China, India and Nepal. Climate Change, 125, 445–460. doi:10.1007/s10584-014-1176-2