
ABSTRACT
Detailed monitoring of surface atmospheric and subterranean microclimatic conditions has provided a new opportunity to interpret drip water temperature changes associated with climate variability. High-resolution multi-index monitoring was conducted in Xiaoyan Cave, Guilin, southwest China, for a period of four years (2011–2014) to identify the processes that control drip water temperature. The results show that variations in drip water temperature are mainly coupled to changes in the cave air temperature unless large drip discharge occurs. The controls on cave air temperature depend on the ventilation modes that eventually affect drip water. The multiple thermal mechanisms are winter ventilation, heat conduction in summer and water flow-induced convection derived from subsurface water percolation into the cave due to fast preferential flow during heavy rain events. Drip water response to extreme temperature anomalies is shown to be sensitive to outside climate.
Editor R. Woods Associate editor X. Chen
1 Introduction
Although dozens of studies published over the past decades have dealt with cave microclimate monitoring, only a few investigations have addressed the controls on cave drip water temperature (Genthon et al. Citation2005, Fairchild et al. Citation2006, Cuthbert et al. Citation2014a, Rau et al. Citation2015). However, this parameter is of fundamental importance considering that it controls hydrochemistry (Drake and Wigley Citation1975, Bonacci et al. Citation2008), biological activity (Kurylyk et al. Citation2015), biodiversity (Smithson Citation1993) and speleothem growth (Sondag et al. Citation2003, Luetscher et al. Citation2008, Kowalczk and Froelich Citation2010, Faimon et al. Citation2012, Faimon and Lang Citation2013, James et al. Citation2015). Understanding rainfall infiltration and the mechanisms of water temperature variation in subterranean cave drips is thus crucial in interpreting the climatic signal (i.e. temperature, rainfall, etc.) preserved by speleothems. Drip water temperature is influenced by multiple factors, consisting of surface and subterranean conditions. The primary heat sources/sinks for drip water are cave air and the surrounding rock (Rau et al. Citation2015). Thermal conduction is regarded as the dominant mechanism responsible for subsurface heat transfer (Domínguez-Villar et al. Citation2013). At the long-term scale, drip temperatures are mainly driven by the annual surface temperature signal, but damped with depth, and a certain delay for the signal to reach the cave depth is expected. However, caves dominated by conduction can be out of equilibrium with surface air temperature (Fairchild and Baker Citation2012b). Latent heat exchange processes, such as condensation or evaporation, can alter the thermal energy content of drip water due to water phase shifts (De Freitas and Schmekal Citation2003) and result in cooling of speleothems (Cuthbert et al. Citation2014a). Evaporation and condensation can be the result of air inflow at the cave entrance, air advection, tourists entering the cave, barometric pressure changes, or temperature difference due to a local geothermal source (Fairchild and Baker Citation2012b). In general, the type of vegetation cover, soil depth, bedrock thickness, karst architecture, cave morphology, drip water position, and hydrological and meteorological conditions are known to strongly affect signal transfer from surface to caves (Domínguez-Villar et al. Citation2013, Breitenbach et al. Citation2015, Rau et al. Citation2015). Numerous studies have focused on the relationship between the cave and external air temperature (Domínguez-Villar et al. Citation2013), and others on factors contributing to mine ventilation (Luetscher and Jeannin Citation2004b, Fairchild and Baker Citation2012b), rock-art preservation (Fernández et al. Citation1986, Hoyos et al. Citation1998), cave microclimate (De Freitas et al. Citation1982, De Freitas and Littlejohn Citation1987, Smithson Citation1991, Hoyos et al. Citation1998, Sondag et al. Citation2003, Badino Citation2004, Šebela and Turk Citation2011, Breitenbach et al. Citation2015), heat and mass transfer (Wigley and Brown Citation1971, De Freitas and Littlejohn Citation1987). However, few studies have reported on the interactive relationship between exterior air temperature and drip water temperature. A detailed observation of cave microclimate is essential for identifying the controls on drip water temperature variations.
Although most studies on water temperature response to climate change have focused on stream and river temperature (Mohseni and Stefan Citation1999, Tague et al. Citation2007, Bonacci et al. Citation2008, Webb et al. Citation2008, Isaak et al. Citation2012), several recent investigations have highlighted the complex interactions that occur in the epikarst and caves between processes that are directly related to climate change. Kurylyk et al. (Citation2015) investigated shallow groundwater thermal sensitivity to climate change. Badino (Citation2004) discussed the effects of global climate changes on cave temperature, and Domínguez-Villar et al. (Citation2015) questioned whether global warming can affect cave temperature. A recent study conducted by Rau et al. (Citation2015) investigated the controls on cave drip water temperature, and presented a conceptual model to explain drip water temperature signals. Drip water temperature is a natural tracer and provides a means to better understand climate signal transfer processes, incorporating surface information into the carbonate speleothems (Breitenbach et al. Citation2015, Motta and Motta Citation2015). However, such investigations are hindered by the limited availability of high-resolution and long-term monitoring of drip water temperature in sub-aerial caves.
In this study, we present multi-annual cave monitoring data from Xiaoyan Cave in Guilin, southwest China, to explain the mechanisms that control drip water temperature. The main objectives of the study were to analyse time series of cave air and drip water temperatures to identify drip water temperature trends and their relationship with surface air temperature variations, and to confirm the presence and timing of conduction, ventilation and inversion airflow. The series comprises several anomalous temperature events, which provide an opportunity to verify the sensitivity of drip water temperature response to climate variability.
2 Study area
Xiaoyan Cave (25°14′53″N, 110°22′33″E), in Yaji Village, approximately 8 km southeast of Guilin City, Guangxi Province, southwest China, is one of the caves in the Yaji Karst Experimental Site. In 1986, the Yaji Experimental Site on karst hydrogeology was established by the Institute of Karst Geology of Chinese Academy of Geological Sciences, based on Sino-French scientific and technological cooperation projects (Yuan et al. Citation1996). It is located at the boundary between a cluster of adjacent peaks and the peak forest plain, which makes up a hydrological system with a recharge area of about 2 km2 (Liu et al. Citation2004). The recharge area is in the peak cluster region with dolines and numerous shallow epikarst springs (e.g. S54, S56, S58). The output of the site is composed of one perennial spring (S31) and three intermittent springs (S29, S291 and S32) at the eastern border of the Guilin peak forest plain (). The altitude of the plain is approximately 150 m a.s.l. (above sea level), whereas the highest peak in the recharge area reaches 652 m a.s.l. and those of doline bottoms range between 250 and 400 m a.s.l. The lithology is mainly Upper Devonian limestone with a bioclastic sparite to micrite texture and the limestone belt generally dips southeast at about 5–10°. A major fault striking NNE is found on the western boundary of the peak cluster region. Xiaoyan Cave is on the mountain slope east of spring S291, which is an intermittent spring at the eastern border of the Guilin peak forest plain (). The NEE trending major joints and fractures have a strong influence on cave orientation and evolution, along with the flow direction of infiltration water (Yuan et al. Citation1990, Liu et al. Citation2008). The entrance of Xiaoyan Cave is at an elevation of 197 m a.s.l., approx. 46 m above the mean outlet of the system (S291). The main cave passage is about 100 m long, 5–30 m in height and 1–50 m wide, with around 20–150 m thickness of rock overlying the cave. Average temperature and humidity in the cave are about 15.8°C and 95%, respectively.
Figure 1. Location of the study site. (a) Topographic map of the landscape around Xiaoyan Cave and location of the meteorological station close to spring S31 (contour interval: 10 m). (b) Setting of drip XY5. (c) Plan view of Xiaoyan Cave with drip site XY5 and monitoring points A–C. (d) Profile map of Xiaoyan Cave with the distribution of monitoring sites.
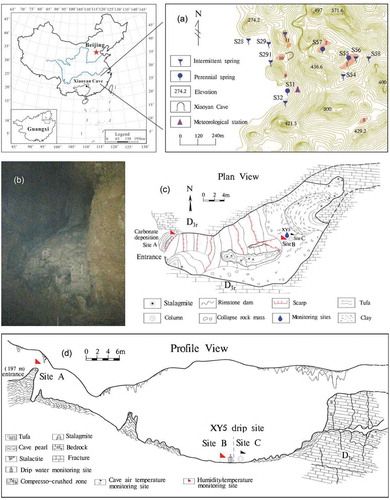
The cave consists of a narrow gallery and relatively large chamber, and the exit is a narrow fissure passage with restricted (crawling) access ( and ). A carbonate deposition is stacked at the cave entrance (), which has an influence on air circulation between the outside and inside of the cave. The cave floor is slightly inclined downward into the cave, with a minimum height of 3.4 m about 10 m away from the cave entrance, and broadens out into the chamber to a height of approximately 20 m. Drip XY5 is a perennial drip point with different drip rates, situated in the middle of the chamber approx. 50 m from the cave entrance. The infiltration water first flows through a steep flowstone and subsequently over the speleothem surface before arriving at the drip source characterized by a large stalactite (). The flow pathway connecting drip XY5 to the surface is uncertain (more than 50 m below the ground surface), but it is likely connected to a relatively large water reservoir in the epikarst zone to maintain a persistent and steady drip rate in the dry season. The soil over the cave consists of beige or isabelline sandy clay with variable depth (0–1 m). The vegetation cover is mainly shrubland with some sparse tree cover, including Vitex negundo, Loropetalum chinnensis, Bauhinia championii, Phyllostachys sulphurea, Rose cymosa and Pterolobium punctatum.
The Guilin area is characterized by a subtropical monsoon climate, which is dominated by the East Asian Monsoon with two distinct seasons, a cold, dry winter and a hot, rainy summer. Mean annual precipitation is 1886 mm, with the rainy season from April to August accounting for 70% of total rainfall, while the period from September to March is drier. Mean monthly precipitation ranges from 359 mm in June to 50 mm in December. Mean annual air temperature is approx. 19.0°C, with a minimum of 17.9°C in 1984 and a maximum of 20.1°C in 2007. The hottest month is July with an average temperature of 28.2°C, while the coldest month is January, which has a mean of 7.9°C at Guilin City between1951 and 2014 (Guo et al. Citation2015).
3 Methods
3.1 Climate monitoring
Surface climate parameters were continuously measured at the weather station approx. 300 m from the cave entrance () for the period from 2011 to 2014 and ongoing. Surface air temperature was monitored at 15-min intervals using a Mini-Diver data logger (DI501-10 m), with a resolution of 0.01°C. However, there were several data gaps due to battery deficit or instrument failure. Precipitation amount was recorded by a tipping bucket raingauge connected to a HOBO® datalogger at the weather station (300 m from Xiaoyan Cave entrance), with a resolution of 0.2 mm. Solar radiation data for Guilin city were obtained from the China Meteorological Data Sharing Service System (http://cdc.nmic.cn/home.do).
3.2 Drip water and cave microclimate monitoring
Drip water was collected in a large rectangular canopy constructed from an assembled steel plate placed under a giant stalactite at the XY5 drip site (Guo et al. Citation2017). This integrates drips scattered over an area incorporating a flowstone draining on to the tip of the stalactite forming the drip sources. The rectangular canopy sloped steeply toward a bucket to minimize flow time over the canopy surface. Two holes were drilled in the side of the bucket at heights of 20 and 40 cm, allowing water to drain out under free-flow conditions. A CTDP300 multi-parameter datalogger (Greenspan Technology Pty. Ltd., Australia) was placed vertically inside the bucket to record drip water temperature and water level at 15 min intervals, with resolutions of 0.01°C and 0.01 cm, respectively. Water level was used to calculate drip water discharge, which was calculated using a hydraulic formula for steady orifice outflow theory. However, under rainstorm conditions, discharge flowed from the bucket into a triangular weir sited below and was measured using the triangular weir empirical equation. Details about the method for this deployment may be referred to in Guo et al. (Citation2014).
Cave climate monitoring sites consisting of relative humidity and temperature proxies were measured at two different locations to record the cave air. Relative humidity and air temperature at the cave entrance were measured at Site A every hour using an iButton datalogger (DS1923-F5). The device incorporates temperature and humidity sensors in a stainless steel container, similar in size to a coin. The device was installed hanging by the cave entrance () in an attempt to investigate airflow ventilation modes through the cave entrance. The digital thermometer measures temperature with an accuracy greater than ±0.5°C from −10 to +65°C, and 11-bit (0.0625°C) resolution. The measuring range of the relative humidity sensor is 0–100%, with a resolution of 0.04%. The thermal response time of iButton dataloggers is 130 s, which ensures rapid sensor equilibration with cave air (Gázquez et al. Citation2016). An iButton DS1923-F5 logger was also deployed at Site B near the XY5 drip site () to record relative humidity of the cave interior at 1-h intervals. Cave air temperature were recorded at 15-min intervals at Site C using a Baro-Diver, close to drip site XY5 (). The measurable temperature range for this sensor is −20 to 80°C, with a precision of ±0.1°C and a resolution of 0.01°C.
4 Results
4.1 Inter-annual and seasonal surface air temperature variability
External air temperature at the Yaji Experimental Site from 2011 to 2014 ranged from 1.2 to 37.0°C, with a mean value of 19.8°C, and exhibited significant inter-annual and seasonal variations (, and ) related to solar irradiation changes (Sondag et al. Citation2003, Stoeva et al. Citation2006, Tague et al. Citation2007, Isaak et al. Citation2012). presents a summary of surface air, drip water and cave air temperature trends during the monitoring period and shows that mean annual surface air temperature varied by 2.0°C over the years, ranging between 20.8 and 18.8°C.
Table 1. Maximum, minimum and mean temperatures, difference and amplitude of surface air and drip water temperatures for 2011–2014. The data on cave air temperature were only available for 2014. ΔT = surface air temperature − drip water temperature.
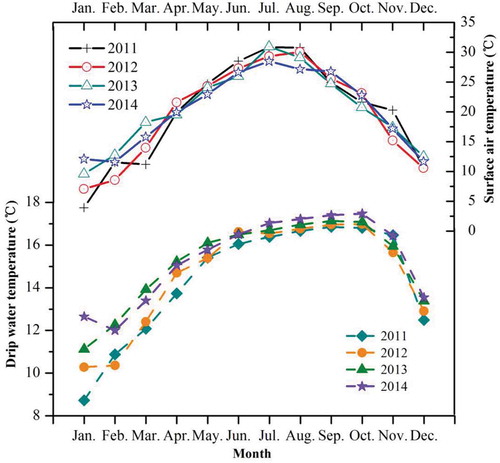
shows inter-annual and seasonal scale variations. The time difference in occurrence of maximum monthly temperature between surface air and drip water exhibits homogenization via mixing, infiltrating and transferring processes through soil and epikarst zones. The mean annual amplitude was 33.7°C, with maximum air temperature recorded in July or August and the minimum temperature in January (). It is noteworthy that January air temperature increased gradually from 3.9 to 12.1°C, with an amplitude of 8.2°C, during the study period. Particularly, the air temperature in January 2014 was significantly higher than in the other years. Air temperature fluctuated in synchrony with precipitation in Guilin, where the climate was characterized by rain and heat in the same period.
Figure 2. Monthly air temperature and cave water temperature for the period 2011–2014.
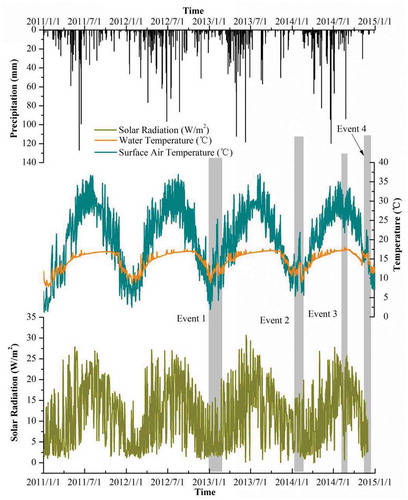
Long time series monitoring data for the four study years, including precipitation, surface air temperature, drip water temperature and solar radiation, are presented in . The drip water temperature fluctuated synchronously with outside air temperature, but buffered signals with an attenuation magnitude of 4.8°C, on average. Vertical grey bars in show temperature anomalous events with a sudden increase in surface air temperature, except for Event 3, which was characterized by a cold event.
Figure 3. Long time series monitoring data for the four study years, including precipitation, surface air temperature, drip water temperature and solar radiation.
4.2 Drip water temperature
Drip water temperature showed inter-annual and seasonal variations in accordance with surface air temperature ( and ). The annual average drip water temperature was 15.0°C and recorded values were slightly lower than the mean cave air temperature (15.2°C). Maximum and minimum drip water temperatures were 18.0 and 7.8°C, respectively. A trend of increasing minimum and maximum annual drip water temperature was detected, with an increase of +1.2 and +0.7°C, respectively. Winter drip water temperature showed an increasing trend over the study period, as well as surface air temperature.
A reproducible drip water temperature was observed in the cave (). However, the temperature signal was damped in comparison with surface air temperature, and similar results could be found in other caves (Sondag et al. Citation2003, Kowalczk and Froelich Citation2010, Breitenbach et al. Citation2015). The attenuation of temperature between surface air and the drip water was around 4.8°C and the amplitude of annual water temperature variation was 9.1°C (), which was much smaller than that of the outside air temperature.
Drip water temperature also responded to individual precipitation events, with increased fluctuation () due to heat and mass exchange as water percolated through the soil and bedrock. Rapid infiltration water containing the surface temperature signal can propagate into the subsurface via fractures or vertical shafts. Detailed analysis of the temperature characteristics of an individual rainfall event is discussed later.
4.3 Cave microclimate
Meteorological characteristics at the surface, cave entrance and inside the cave were monitored to determine the airflow mode and the results are presented in Figure 4. Cave air temperature was monitored at Site C, situated near drip site XY5 ( and ), 50 m from the cave entrance, between 25 November 2013 and 31 December 2014. The cave air temperature record showed a marked seasonal variability, ranging from 10.0°C in winter to 18.4°C in summer (). Mean cave air temperature was 15.2°C during the monitoring period, which was lower than the annual mean air temperature of 19.0°C in Guilin City. In general, cave air temperature is close to the annual mean air temperature (Smithson Citation1991, Badino Citation2004, Breitenbach et al. Citation2015). The lowest cave air temperature in this study was recorded in February 2014, with the highest in October 2014, and cave air temperature was slightly higher than surface air temperature in winter and much lower in summer (). Cave air temperature progressively increased from March to July, then stabilized until the end of October, with a maximum in October. However, surface and cave air maximum temperatures are not synchronous, the latter being recorded more than two months later and following not the classical sinusoidal seasonal pattern but an asymptotic thermal increase ().
Figure 4. Comparison between (a) surface air and cave air temperatures, (b) cave air and water temperatures, (c) external and in-cave temperatures recorded at the entrance and drip site XY5 (31 January and 10 March 2015, due to loss of instrument at entrance), and (d) relative humidity of the cave interior near XY5 (31 January to 2 May 2015).
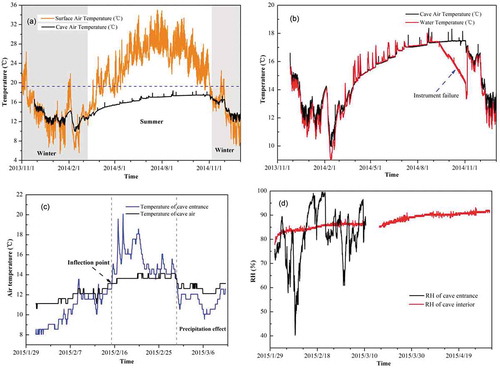
Relative humidity was measured in the cave interior between January and May 2015 and showed a seasonal rotation from winter to summer, varying from 78 to 93%, with a median of approx. 87%, which increased logarithmically (). Although no data are provided for summer, relative humidity can sometimes reach saturation point then due to higher drip discharge along with the arrival of the rainy season.
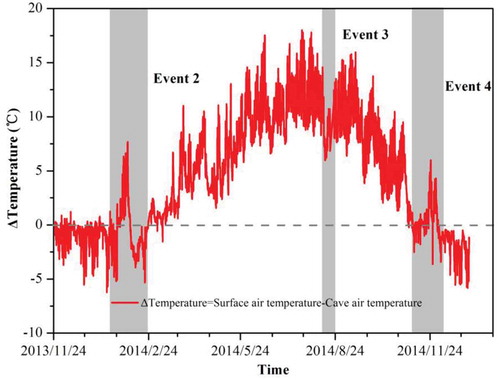
Temperature differences between the outside atmosphere and the cave air were measured during the period 24 November 2013 to 31 December 2014, and are presented in Figure 5. Negative temperature differences were prone to initiate cave ventilation prevailing in winter, while positive temperature differences were attributed to limited ventilation. Three anomalous events were captured to provide detailed insight into the influences of climate change. A positive temperature difference was observed in Event 2 and Event 4, while a decreased temperature difference was observed in Event 3.
The difference between air temperature outside and inside the cave initially became negative until February, peaking on 22 July, and largely positive thereafter (). The temperature differences confirm a damped temperature signal (Breitenbach et al. Citation2015). It is particularly interesting that cave air temperature was characterized by greater oscillations between November and January, ranging from 16.5 to 10.9°C, coinciding with external cold temperature variations.
Figure 5. Temperature differences between outside atmosphere and cave air (24 November 2013 to 31 December 2014).
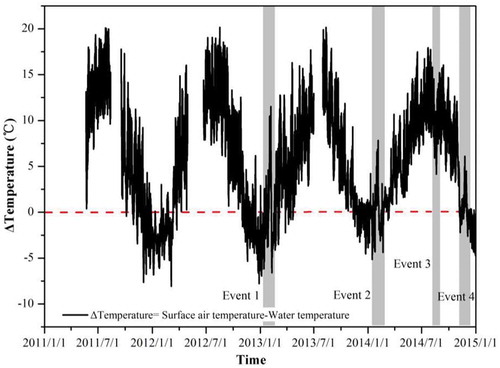
Temperature difference in time series between surface air temperature and drip water temperature from 2011 to 2014 are presented in Figure 6. The temperature difference displays annual cycles and seasonal variation, with temperature varying between −8.1 and 20.2°C. Event 1, Event 2 and Event 4 show increased temperature differences, while the decreased difference for Event 3 was caused by a cold snap.
5 Discussion
5.1 Relationships between surface air temperature and drip water temperature
The differences between drip water and surface air temperature in the study period are summarized in , which shows that surface air temperature was 4.8°C higher on average. In comparison, the ranges in drip water temperature were relatively smaller throughout the year, with an average annual amplitude of 9.1°C compared with 33.7°C for surface air temperature. The narrow range of drip water temperature is attributed to homogenization via mixing, infiltration and transfer of percolation water through the soil and epikarst zone above the cave, related to vadose zone characteristics and hydrological processes. The shield effect of vegetation, soil and epikarst acts as a buffer against evaporation, and direct heat exchange between atmosphere and rock plays an essential role in drip water temperature. Domínguez-Villar et al. (Citation2013) previously investigated the impact of changes in vegetation cover over Eagle Cave on cave air temperature, and found that a decoupling of surface air temperature and cave air was observed with approx. 2°C cave cooling due to afforestation. Therefore, changes in land use, vegetation cover and human activity (Breitenbach et al. Citation2015) can be recorded in cave air and eventually could imprint on the speleothem archives.
Maximum surface air temperature was recorded in July or August, whereas drip water temperature peaked in September or October (). It is of interest that the maximum drip water temperature was not synchronous with maximum surface air temperature, with a lag time of two or three months. Minimum air temperature usually occurred in January, except in 2014 when it occurred in February. The timing of minimum drip water temperature inside the cave followed that of surface air temperature. The good correlation between air temperatures inside and outside the cave is attributed to the greater air density differences prevailing during winter, which promote cave convection where cooler external air is drawn into the cave (Atkinson et al. Citation1983, Luetscher and Jeannin Citation2004a, Kowalczk and Froelich Citation2010, Šebela and Turk Citation2011, Faimon et al. Citation2012, Fairchild and Baker Citation2012b, Breitenbach et al. Citation2015, James et al. Citation2015).
5.2 Seasonal airflow patterns and mechanisms
As discussed above, during winter, the drip water temperature was coupled to surface air temperature, and it displayed similar inter-annual and seasonal variations (). This could be attributed to the active air circulation between the cave and exterior atmosphere. As shown in , the temperature trends of both drip water and surface air coincided with solar irradiation trends.
Variations in surface air temperature, relative humidity and cave air temperature in Xiaoyan Cave suggest that seasonal airflow patterns control the temperature of drip water. Here, we critically analyse the factors contributing to the generation of different air flows and how they affect drip water temperature. The timing and duration of different airflow modes are identified through the interaction of surface air temperature, cave air temperature and drip water temperature, and temperature thresholds for airflow conversion are determined for winter/summer and summer/winter modes.
Cave air temperature is consistent with surface air temperature in winter due to the enhanced ventilation caused by the density gradient between external and cave air. During summer, cave air temperature is equilibrated with the cave walls, which tend to have the multi-annual average temperature slightly modified by local factors. As shown in , drip water temperature closely matched cave air temperature, with a mean difference of 0.2°C, which likely resulted from the latent heat exchange of evaporation and localized water film convection (Rau et al. Citation2015). In general, drip water temperature followed the cave air temperature due to a heat exchange that favoured thermal equilibration. However, latent heat exchange processes such as condensation or evaporation can alter the thermal energy content of drip water. Cuthbert et al. (Citation2014a) and Rau et al. (Citation2015) identified significant in-cave evaporation in Cathedral Cave, resulting in drip water cooling, which is most prevalent at near entrance areas even under conditions of unsaturated cave air in water (e.g. approx. 90%). In a study of radon mass balance in Hollow Ridge Cave, Florida, USA, Kowalczk and Froelich (Citation2010) suggested that the most rapid ventilation occurs inside the cave around 25 m from the entrance. For Xiaoyan Cave, Guo et al. (Citation2015) concluded that the average isotopic composition of drip water was relatively enriched by up to +11‰ for δD and up to +1.0‰ for δ18O, compared to the weighted average for precipitation, demonstrating that water infiltrating into the subsurface to the exfiltrate point and forming drip water both experience evaporative processes (either subsurface or within-cave). In addition, due to its variable humidity and near-entrance location, drip water temperature at drip site XY5 was susceptible to evaporation processes. Cuthbert et al. (Citation2014b) and Markowska et al. (Citation2016) demonstrated that subsurface evaporation was the most dominant control on drip water δ18O composition, and non-equilibrium evaporative conditions at a shallow site can be observed under a less humid environment (e.g. <95%). This implies that potential evaporation does exist in caves. As long as cave atmospheric water vapour is low, or sufficient air exchange occurs, conditions will be conducive to promoting evaporation coinciding with decreased relative humidity or increased air flow (Cuthbert et al. Citation2014a).
The dotted arrow in ) shows an anomaly with an inconsistent variation of cave air temperature, resulting from a malfunction of the collection instrument. Cave climate, especially cave air temperature, is presumed to be the predominant influence on drip water temperature variations when infiltrating water enters the cave and before forming drips, and the temperature signals that are ultimately captured in speleothem-based archives. The assumption of an equilibrium between drip water and cave air temperature would generally be expected; it reflects long-term variations of the mean annual surface atmosphere temperature but damped with increasing distance from the entrance. However, drip water temperature may be significantly out of equilibrium with cave air and rock temperature (Cuthbert et al. Citation2014a, Rau et al. Citation2015). Causes for the thermal disequilibrium between water and the surrounding material are still not very well understood, since the heat transport processes and hydrological flow regimes have yet to be systematically explored in karst systems. Therefore, in our study a more detailed and continuous monitoring of cave microclimatic, hydrological conditions, including in-cave evaporation, is imperative to better understand the heat transfer mechanisms that act on speleothem-forming drip water.
Temperatures were measured at the cave entrance and cave interior from January to March 2015 to verify airflow exchange across the cave entrance. The pattern of temperature variations recorded suggests that airflow was subject to multiple superimposed influences, including seasonal effects and single precipitation events ().The airflow mode switched in mid-February, when the temperature difference between air in and out of the cave was close to zero (). Significantly, water flow-induced convection occurred during the transitional period (February and March), and arose in a precipitation event (1–7 March), characterized by air mass cooling. This behaviour can change airflow direction, when external air temperature drops below that of the cave interior (Breitenbach et al. Citation2015, Gázquez et al. Citation2016, ).
Relative humidity was recorded simultaneously at sites A (cave entrance) and B (cave interior) during the period 31 January–10 March 2015, and experienced seasonal rotation from dry season to rainy season. Relative humidity at the cave entrance fluctuated at a relatively high frequency, ranging from 40 to 100% (), with the mean value of 82%, which was clearly controlled by diurnal changes in the surface atmosphere, including the influence of precipitation. However, inside the cave, relative humidity continuously increased over the period from 78 to 88%, reflecting the progressive wetting of the cave as discharge increased with the onset of the rainy season.
Overall, cave air circulation is mainly controlled by the density gradient between atmospheres inside and outside the cave. Temperature is regarded as the dominant parameter affecting the density difference. It is assumed that pressure variations played a minor role in controlling drip water temperature in Xiaoyan Cave. James et al. (Citation2015) modelled the factors controlling cave ventilation and showed that a 3 kpa increase in pressure at 20°C yields only a 3.2% increase in density, while a temperature increase of 25°C at 65% humidity induces an approximately 11% increase in density. Therefore, temperature differences between atmospheric and cave air can be used as a proxy for interpreting ventilation regimes (De Freitas et al. Citation1982, Smithson Citation1991, Citation1993, Kowalczk et al. Citation2008, Kowalczk and Froelich Citation2010, Faimon et al. Citation2012, Faimon and Lang Citation2013, Breitenbach et al. Citation2015, Rau et al. Citation2015). Seasonal airflow patterns in the karst cave system trigger different airflow directions and heat transfer processes that exert controls on drip water temperature changes. Consequently, two major ventilation regimes are identified in Xiaoyan Cave.
During the winter season, cold dense air pushing into the cave is the primary driver of enhanced ventilation, displacing the warmer, lighter cave air (Kowalczk and Froelich Citation2010, Oster et al. Citation2012, James et al. Citation2015). A widespread mixing of airflow in the capacious chamber cools the cave air and reduces the temperature difference (). Thus, during winter, cave air temperature synchronously decreases with external air temperature () muted to some proportion and slightly biased due to latent heat exchanges, and negative temperature differences between November and February strengthen the ventilation (). Therefore, drip water temperature in winter is closely related to external temperature by cave venting.
During summer, cave air is cooler and denser than that of the outside air resulting in limited ventilation of the cave atmosphere (Faimon et al. Citation2012). The reduced air ventilation regime during the summer results in the cave walls being the principal source of heat for the cave air to exchange with. Thus, in the absence of significant air advection, the cave air equilibrates with the cave wall temperature, and the heat transfer mechanism during this season is dominated by conduction. As shown in ), the cave air temperature during the summer ventilation mode does not follow a sinusoidal signal instead of an asymptotic signal. Typically, the temperature differences in summer () are of longer duration and greater magnitude (James et al. Citation2015), which can be attributed to restricted ventilation, resulting in prolonged temperature equilibration between air and host rock in the summer season (Breitenbach et al. Citation2015). As thermal conduction is primarily a function of heat and mass transfer, drip water temperature and cave air temperature consistently respond to surface environment variations in summer, with a mean damped temperature signal of 7.4°C (Domínguez-Villar et al. Citation2013). The attenuation of external temperature variability with depth and a certain delay are the essential characteristics of conduction-dominated thermal signals.
The timing and threshold of airflow conversion can be determined through comparison between surface air temperature and cave air temperature () and ). From the datasets of surface air temperature, cave air temperature and drip water temperature, and taking the cave morphology into account, air may normally be expected to flow into the cave from November to March, driven by density differences caused by temperature differences between outside and inside air. However, from mid-March to early November, the density gradient does not favour the inflow of surface air into the cave and the exchange of air in the cave with the surface is drastically reduced. In an assessment of airflow and ventilation in Glowworm Cave, New Zealand, De Freitas et al. (Citation1982) suggested that reversal of airflow occurs when the air density gradient in the cave is zero rather than when the internal and external temperatures are equal. Temperature difference directly affects density difference between atmosphere and cave air, modulating airflow direction. Therefore, temperature difference can be used as an appropriate indicator to evaluate airflow conversion time and thresholds. There is a slight difference in the temperature thresholds for the different airflow modes, with a threshold of approximately 13°C for winter to summer mode and 16°C for summer to winter mode (, and ), respectively. Faimon et al. (Citation2012) also indicated the switching of ventilation modes in the transitional periods between winter and summer, at a range of external temperatures from 9.5 to 11.1°C. In Xiaoyan Cave, the transitional periods generally occurred in March or November.
Figure 6. Temperature difference in time series between surface air temperature and drip water temperature from 2011 to 2014.
5.3 Storm response
In Xiaoyan Cave, a network of high-density fissures and large fractures in the overlain rock leads to high permeability and active connection with the surface atmosphere. This allows rapid transfer of surface signals into the cave, making the cave sensitive to weather conditions. Flood events have strong potential to impact heat convection due to subsurface water percolation caused by fast recharge (Luetscher and Jeannin Citation2004b, Rau et al. Citation2015), and this may provide another reason for drip water temperature fluctuations.
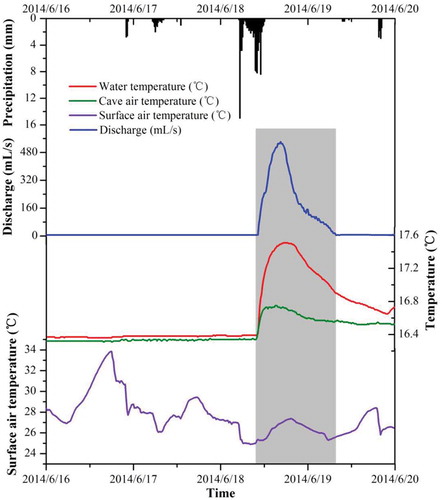
A typical recharge event was chosen to further understand heat conduction between percolation water and rock. Drip water temperature can be affected through heat convection due to subsurface water percolation through fractures and conduits. Figure 7 presents the variations in precipitation, discharge, and the temperatures of drip water, cave air and the atmosphere recorded at Xiaoyan Cave for the event of 16–20 June 2014. The total rainfall was 146.6 mm over the monitoring period, and a key rainfall event of 94.4 mm on 18 June was effective in terms of discharge response. Discharge appears to correlate directly with this event, whereas other smaller events, 5.8 mm on 16 June and 9 mm on 17 June, did not trigger a discharge response. Interception processes and retention of water within the soil and epikarst zone may play an important role in initiating drip response, indicating that a threshold precipitation amount is required to exceed the soil capacity and residual capacity of the epikarst zone (Guo et al. Citation2015), which is similar to the drip discharge observations in Markowska et al. (Citation2016). Nonlinearity in cave discharge responses have been observed due to epikarst dynamics in Xiaoyan Cave. This nonlinear behaviour has also been confirmed through tracer tests, and hydrochemical and discharge dynamics (e.g. conductivity, pH, water temperature and drip rate); the results can be found in Guo et al. (Citation2017). For Xiaoyan Cave, 74.4 mm precipitation is the minimum amount required to initiate a drip discharge response after experiencing a prolonged dry period of 71 days (Guo et al. Citation2017), where soil moisture deficits must be overcome for the transitional period from the late dry season to the onset of the rainy season.
Discharge increased markedly in the event, varying from 0.36 to 541 mL/s. Prior to the storm, mean drip discharge was 5.9 mL/s; however, discharge increased rapidly to a maximum of 541 mL/s within 11.5 h of the concentrated rainfall, which demonstrates the high peaking hydraulic response function in the unsaturated zone. The drip water temperature curve showed a marked high-frequency perturbation associated with the rain event (). Before the precipitation episode, the mean drip water and cave air temperatures were 16.4 and 16.3°C, respectively. It is interesting to note that the timing of drip water temperature and cave air temperature response to the increase in discharge is consistent. However, the maximum water temperature was higher than the maximum cave air temperature by 0.76°C, with a delay of 2.25 h (), probably contributed to heat advection due to the large volume of water that is not negligible in the heat and mass balance to equilibrate with the cave atmosphere. Drip water temperature increased by 1.1°C and cave air temperature by 0.4°C compared to mean temperatures before the event, subsequently characterized by an exponential recession. Therefore, this thermal disequilibrium confirms the role of heat convection from subsurface water percolation in controlling the response of water temperature to rainstorm flow due to fast preferential and conduit flow triggered by heavy rain events. We suggest that the response time of drip water temperature to this rainstorm was estimated at 12.25 h. However, water residence time from infiltration to drip waters cannot be generalized for the whole cave system due to the inherent heterogeneity of vadose zone and antecedent moisture conditions, making the estimation of recharge runoff and hydrological behaviour complicated and associated with high uncertainty.
Figure 7. Variations in precipitation, discharge, and temperatures of drip water, cave air and the atmosphere recorded in Xiaoyan Cave for the rainstorm event of June 2014.
As discussed above, drip water temperature approximates cave air temperature over the long-term scale. However, at the scale of individual precipitation events, thermal exchange is not capable of reaching equilibrium between cave and water temperature, due to fast runoff recharge through conduits and fractures and shorter water–rock interaction time. During a heavy rain period, not only does heat convection play a key role in controlling the drip water temperature, but water–rock heat exchange is an important thermal process. When drip discharge is large, the drip water temperature is a mixture of rainwater temperature and temperature in the karst system. We hypothesize that the redundant thermal exchange might generate heat radiation between infiltration water and rock along flow paths. Covington et al. (Citation2011) developed a model of heat transport in karst conduits, demonstrating that radiative heat exchange between water and rock is important in open channel conduits. We acknowledge that soil thickness, length of flow path, conduit diameter, rainfall amount, flow velocity, interaction time and surface meteorological conditions all play an important role in controlling drip water temperature. In addition, Gázquez et al. (Citation2016) suggested that the intensity of air turbulence generated by waterfalls in a cave also produces variations in cave air temperature. Subsurface temperature is coupled to precipitation signals by heat advection through the soil and rock mass (Pflitsch and Piasecki Citation2003, Šebela and Turk Citation2011). Many studies have shown that high flow inputs can play a key role in determining cave air and drip water temperature (Genthon et al. Citation2005, Luetscher et al. Citation2008, Šebela and Turk Citation2011, Zajíček et al. Citation2011, Fairchild and Baker Citation2012a, Breitenbach et al. Citation2015, Motta and Motta Citation2015). The temperature of water input, from both precipitation and the epikarst reservoir, directly impacts groundwater temperature through heat exchange and advection.
5.4 Extreme temperature events
The sensitivity of drip water temperature response to climate variation can be evaluated by studying extreme temperature events. Four temperature anomalies in the study period of 2011–2014 were extracted, including three warming events (Events 1, 2 and 4) and one cooling event (Event 3) (, and ).
The data in highlight that both surface air and cave drip water temperature variations are consistent with solar irradiation. An increase in solar irradiation was associated with a positive temperature anomaly, while a decrease caused cooling of atmospheric and drip water temperature.
Events 1 and 2 peaked in early February (2013 and 2014, respectively) with associated oscillations ranging from mid-January to mid-February, to give total durations of 34 d and 31 d, respectively. It is of interest that the maximum air temperatures in both events occurred at the vernal equinox, with 25.3 and 21.9°C, representing an increase of 3.3 and 2.1°C, respectively, compared to the average annual February air temperature. Drip water temperature changes were consistent with those of the air, with maximum drip water temperatures of 13.9 and 14.1°C, representing a rise of 3.6 and 2.3°C on temperatures prior to the events, although still below the surface air temperature (). These winter temperature events might be related to solar irradiation; however, there was a lag between drip water and the atmosphere response of 42 h for Event 1 and 9 h for Event 2, which was affected by the duration and amplitude of the temperature anomaly and seasonal airflow modes.
Event 3, which occurred from 12 to 22 August 2014, was characterized by a marked lowering of temperature (), decreasing the monthly average air temperature by 0.8°C. A critical factor contributing to the decrease was a weaker than normal subtropical anticyclone to the east, integrated with cold northerly air. These meteorological conditions caused a significant reduction in temperature differences ( and ). External air temperature oscillated around 28°C before the event, then decreased to 21.8°C on 20 August (). However, the response of drip water and cave air temperature was inconsistent, with both increasing. This may be related to the timing of the event in the summer season, when external air temperature is commonly higher than cave air temperature. Also, a precipitation event with a total rainfall volume of 34 mm occurred on 18 August, which may have enhanced cave temperatures through transfer of atmospheric heat into the cave via convection along preferential flow paths.
Event 4 was characterized by warming, with a maximum air temperature of 22.5°C in November 2014, and a duration of 33 d over the period from 5 November to 8 December. The temperature increase heralded the pronounced warm winter of 2014/15, associated with El Niño, with a monthly anomaly of 1.6°C compared to the average November temperature. Air and drip water temperature maxima of 22.5 and 17.0°C were recorded. As a consequence, an airflow conversion was observed from 20 to 30 November, which provides supporting evidence for a positive temperature difference between surface and cave air ().
6 Conclusions
A multi-annual monitoring study, initiated in 2011 in Xiaoyan Cave, Guilin, southwest China, gives a detailed identification of the controls on temperature variations in cave drip water. Understanding of cave ventilation processes and extreme anomalous events captured by drip water provides useful information on drip water temperature response to climate variability. Analysis of cave drip water temperature has proven to be a powerful tool for documenting air temperature fluctuations and improved understanding of high-resolution palaeoclimate reconstruction from speleothem-based archives.
Marked seasonal variations of drip water and cave air temperature are observed in response to external atmospheric conditions. The subsurface drip water temperature fluctuates synchronously with surface temperature, characterized by a damped signal of 4.8°C on account of the karst architecture. The key mechanisms that act upon infiltrating water to control drip water temperature are confirmed as airflow modes, individual precipitation events and temperature anomalies. The two main heat sources for drip water are the surrounding rock walls and cave air. The subsurface temperature is coupled to the surface temperature by conduction through the cave walls during summer, whereas during winter the drip water temperature is synchronous with surface temperature by cave convection.
A long-term summer airflow mode prevails from mid-March to November and cave air temperature follows an asymptotic signal instead of a sinusoidal signal. During this time period, drip water adopts the temperature of the cave air, the signal of which dominates this heat exchange, whereas cave air temperature is equilibrated with the temperature of the cave walls due to limited ventilation. Thus, during summer, the heat transport that dominates the thermal signal in the cave is dominated by conduction through the bedrock instead of by advection through the atmosphere. The significant thermal capacity of rock conduction can be indirectly hinted at under rainstorm conditions, which trigger a rapid increase in drip discharge and a rapid change in drip water temperature caused by subsurface water percolation through preferential flow paths (Rau et al. Citation2015). However, non-equilibrium thermal conditions between drip water and cave air can be observed with a temperature difference of 0.76°C. We presume that radiation may play an important role in controlling the thermal exchange processes between infiltration water and rock during the high flow period. The drip water temperature is a mixture of rain water temperature and temperature in the karst system. However, in the winter airflow mode, surface air temperature is the principal control on drip water temperature due to enhanced ventilation driven by temperature-induced air density differences between surface and cave atmospheres. Therefore, cave advection is the main thermal mechanism that dominates cave drip water temperature. In Xiaoyan Cave, airflow conversion generally occurs in March and November, with thresholds of cave air temperature approximately 13°C for winter/summer mode and 16°C for summer/winter mode, respectively.
The study demonstrates that event-based anomalous temperature signals are captured by cave drip water, which contributes to improved understanding and has implications for interpretation of speleothem-based palaeoclimate reconstructions. The possibility and sensitivity of drip water response to climate have been clearly identified in extreme temperature events for the first time. It is of considerable interest that the maximum anomalous air temperatures were frequently observed to occur at the vernal equinox or near the end of summer, which may help interpretation of temperature anomalies in palaeoclimate records. Continuous and high-resolution thermal monitoring in the future would allow quantitative investigation and simulation of drip water temperature variations with respect to climate change.
Acknowledgments
The authors especially thank Yushi Lin for providing guidance to achieve deep knowledge of the cave. We would like to thank Editage for English language editing. Special thanks to Jianjun Yin for helpful discussions and suggestions. We also thank Qingjia Tang, Jie Zeng, Guofu Chen and Huasheng Zhang for field work assistance. Finally, thanks to Professor David Domínguez-Villar, Professor Xi Chen and the editors for their detailed and extremely valuable comments and suggestions, which have greatly improved this manuscript.
Disclosure statement
No potential conflict of interest was reported by the authors.
Additional information
Funding
References
- Atkinson, T.C., Smart, P.L., and Wigley, T.M.L., 1983. Climate and natural radon levels in Castleguard Cave, Columbia Icefields, Alberta, Canada. Arctic and Alpine Research, 15, 487–502. doi:10.2307/1551235
- Badino, G., 2004. Cave temperatures and global climatic change. International Journal of Speleology, 33, 103–113. doi:10.5038/1827-806X
- Bonacci, O., Trninić, D., and Roje-Bonacci, T., 2008. Analysis of the water temperature regime of the Danube and its tributaries in Croatia. Hydrological Processes, 22, 1014–1021. doi:10.1002/(ISSN)1099-1085
- Breitenbach, S.F.M., et al., 2015. Cave ventilation and rainfall signals in dripwater in a monsoonal setting- a mnitoring study from NE India. Chemical Geology, 402, 111–124. doi:10.1016/j.chemgeo.2015.03.011
- Covington, M.D., et al., 2011. Mechanisms of heat exchange between water and rock in karst conduits. Water Resources Research, 47, W10514. doi:10.1029/2011WR010683
- Cuthbert, M.O., et al., 2014a. Evaporative cooling of speleothem drip water. Scientific Reports, 4 (1), 5162. doi:10.1038/srep05162
- Cuthbert, M.O., et al., 2014b. Drip water isotopes in semi-arid karst: implications for speleothem paleoclimatology. Earth and Planetary Science Letters, 395, 194–204. doi:10.1016/j.epsl.2014.03.034
- De Freitas, C.R., et al., 1982. Cave climate: assessment of airflow and ventilation. Journal of Climatology, 2, 383–397. doi:10.1002/joc.v2:4
- De Freitas, C.R. and Littlejohn, R.N., 1987. Cave climate: assessment of heat and moisture exchange. Journal of Climatology, 7, 553–569. doi:10.1002/joc.v7:6
- De Freitas, C.R. and Schmekal, A., 2003. Condensation as a microclimate process: measurement, numerical simulation and prediction in the Glowworm Cave, New Zealand. International Journal of Climatology, 23 (5), 557–575. doi:10.1002/(ISSN)1097-0088
- Domínguez-Villar, D., et al., 2013. Reconstruction of cave air temperature based on surface atmosphere temperature and vegetation changes: implications for speleothem palaeoclimate records. Earth and Planetary Science Letters, 369–370, 158–168. doi:10.1016/j.epsl.2013.03.017
- Domínguez-Villar, D., et al., 2015. Is global warming affecting cave temperatures? Experimental and model data from a paradigmatic case study. Climate Dynamics, 45, 569–581. doi:10.1007/s00382-014-2226-1
- Drake, J.J. and Wigley, T.M.L., 1975. The effect of climate on the chemistry of carbonate groundwater. Water Resources Research, 11, 958–962. doi:10.1029/WR011i006p00958
- Faimon, J., et al., 2012. Air circulation and its impact on microclimatic variables in the Cisarska Cave (Moravian Karst, Czech Republic). International Journal of Climatology, 32, 599–623. doi:10.1002/joc.v32.4
- Faimon, J. and Lang, M., 2013. Variances in airflows during different ventilation modes in a dynamic U-shaped cave. International Journal of Speleology, 42, 115–122. doi:10.5038/1827-806X
- Fairchild, I.J., et al., 2006. Modification and preservation of environmental signals in speleothems. Earth-Science Reviews, 75, 105–153. doi:10.1016/j.earscirev.2005.08.003
- Fairchild, I.J. and Baker, A., 2012a. Speleothem science. London: Wiley-Blackwell. Transfer processes in karst. In chap 4, 122–127.
- Fairchild, I.J. and Baker, A., 2012b. Speleothem science: from processes to past environment. London: Wiley-Blackwell. Heat flux. In chap 4, 137–145.
- Fernández, P.L., et al., 1986. Natural ventilation of the Paintings Room in the Altamira cave. Nature, 321, 586–588. doi:10.1038/321586a0
- Gázquez, F., Calaforra, J.M., and Fernández-Cortés, Á., 2016. Flash flood events recorded by air temperature changes in caves: A case study in Covadura Cave (SE Spain). Journal of Hydrology, 541, 136–145. doi:10.1016/j.jhydrol.2015.10.059
- Genthon, P., et al., 2005. Temperature as a marker for karstic waters hydrodynamics. Inferences from 1 year recording at La Peyrére cave (Ariège, France). Journal of Hydrology, 311, 157–171. doi:10.1016/j.jhydrol.2005.01.015
- Guo, X.J., et al., 2014. Analysis to hydrological process of drip water in the aeration zone of a typical karst stone hill. Carsologica Sinica, 33, 176–183.
- Guo, X.J., et al., 2015. Recharge processes on typical karst slopes implied by isotopic and hydrochemical indexes in Xiaoyan Cave, Guilin, China. Journal of Hydrology, 530, 612–622. doi:10.1016/j.jhydrol.2015.09.065
- Guo, X.J., et al., 2017. Research on hydrological processes of Cave dripping water in a typical karst vadose zone: a case study of Xiaoyan Cave, Guilin. Acta Geoscientica Sinica, 38, 537–548.
- Hoyos, M., et al., 1998. Microclimatic characterization of a karst cave: human impact on microenvironmental parameters of a prehistoric rock art cave (Candamo Cave, northern Spain). Environmental Geology, 33, 231–242. doi:10.1007/s002540050242
- Isaak, D.J., et al., 2012. Climate change effects on stream and river temperatures across the northwest U.S. From 1980-2009 and implications for salmonid fishes. Climatic Change, 113, 499–524. doi:10.1007/s10584-011-0326-z
- James, E.W., Banner, J.L., and Hardt, B., 2015. A global model for cave ventilation and seasonal bias in speleothem paleoclimate records. Geochemistry, Geophysics, Geosystems, 16, 1044–1051. doi:10.1002/2014GC005658
- Kowalczk, A.J., et al., 2008. High resolution time series cave ventilation processes and the effects on cave air chemistry and drip waters: speleoclimatology and proxy calibration. American Geophysical Union, Fall Meeting.
- Kowalczk, A.J. and Froelich, P.N., 2010. Cave air ventilation and CO2 outgassing by radon-222 modeling: how fast do caves breathe? Earth and Planetary Science Letters, 289, 209–219. doi:10.1016/j.epsl.2009.11.010
- Kurylyk, B.L., et al., 2015. Shallow groundwater thermal sensitivity to climate change and land cover disturbances: derivation of analytical expressions and implications for stream temperature modeling. Hydrology and Earth System Sciences, 19, 2469–2489. doi:10.5194/hess-19-2469-2015
- Liu, Z.H., et al., 2004. Hydrochemical variations during flood pulses in the south-west China peak cluster karst: impacts of CaCO3-H2O-CO2 in teractions. Hydrological Processes, 18, 2423–2437. doi:10.1002/(ISSN)1099-1085
- Liu, Z.H., Liu, X.L., and Liao, C.J., 2008. Daytime deposition and nighttime dissolution of calcium carbonate controlled by submerged plants in a karst spring-fed pool: insights from high time-resolution monitoring of physico-chemistry of water. Environmental Geology, 55, 1159–1168. doi:10.1007/s00254-007-1062-6
- Luetscher, M. and Jeannin, P.-Y., 2004a. The role of winter air circulations for the presence of subsurface ice accumulations: an example from Monlesi ice cave (Switzerland). Theoretical and Applied Karstology, 17, 19–25.
- Luetscher, M. and Jeannin, P.-Y., 2004b. Temperature distribution in karst systems: the role of air and water fluxes. Terra Nova, 16, 344–350. doi:10.1111/ter.2004.16.issue-6
- Luetscher, M., Lismonde, B., and Jeannin, P.-Y., 2008. Heat exchanges in the heterothermic zone of a karst system: monlesi cave, Swiss Jura Mountains. Journal of Geophysical Research, 113, 1–13. doi:10.1029/2007JF000892
- Markowska, M., et al., 2016. Semi-arid zone caves: evaporation and hydrological controls on δ18O drip water composition and implications for speleothem paleoclimate reconstructions. Quaternary Science Reviews, 131, 285–301.
- Mohseni, O. and Stefan, H.G., 1999. Stream temperature/air temperature relationship: a physical interpretation. Journal of Hydrology, 218, 128–141. doi:10.1016/S0022-1694(99)00034-7
- Motta, L. and Motta, M., 2015. The climate of the Borna Maggiore di Pugnetto Cave (Lanzo Valley, Western Italian Alps). Universal Journal of Geoscience, 3, 90–102. doi:10.13189/ujg.2015.030303
- Oster, J.L., Montañez, I.P., and Kelley, N.P., 2012. Response of a modern cave system to large seasonal precipitation variability. Geochimica et Cosmochimica Acta, 91, 92–108. doi:10.1016/j.gca.2012.05.027
- Pflitsch, A. and Piasecki, J., 2003. Detection of an airflow system in Niedzwiedzia (Bear) Cave, Kletno, Poland. Journal of Cave and Karst Studies, 65 (3), 160–173.
- Rau, G.C., et al., 2015. Controls on cave drip water temperature and implications for speleothem-based paleoclimate reconstructions. Quaternary Science Reviews, 127, 19–36.
- Šebela, S. and Turk, J., 2011. Local characteristics of Postojna Cave climate, air temperature, and pressure monitoring. Theoretical and Applied Climatology, 105, 371–386. doi:10.1007/s00704-011-0397-9
- Smithson, P.A., 1991. Inter-relationships between cave and outside air temperatures. Theoretical and Applied Climatology, 44, 65–73. doi:10.1007/BF00865553
- Smithson, P.A., 1993. Vertical temperature structure in a cave environment. Geoarchaeology: An International Journal, 8, 229–240. doi:10.1002/(ISSN)1520-6548
- Sondag, F., et al., 2003. Monitoring present day climatic conditions in tropical caves using an Environmental Data Acquisition System (EDAS). Journal of Hydrology, 273, 103–118. doi:10.1016/S0022-1694(02)00362-1
- Stoeva, P., Stoev, A., and Kiskinova, N., 2006. Long-term changes in the cave atmosphere air temperature as a result of periodic heliophysical processes. Physics and Chemistry of the Earth, 31, 123–128. doi:10.1016/j.pce.2005.05.001
- Tague, C., et al., 2007. Hydrogeologic controls on summer stream temperatures in the McKenzie River basin, Oregon. Hydrological Processes, 21, 3288–3300. doi:10.1002/(ISSN)1099-1085
- Webb, B.W., et al., 2008. Recent advances in stream and river temperature research. Hydrological Processes, 22, 902–918. doi:10.1002/(ISSN)1099-1085
- Wigley, T.M.L. and Brown, M.C., 1971. Geophysical applications of heat and mass transfer in turbulent pipe flow. Boundary-Layer Meteorology, 1, 300–320. doi:10.1007/BF02186034
- Yuan, D.X., et al., 1990. Hydrology of the karst aquifer at the experimental site of Guilin in Southern China. Journal of Hydrology, 115, 285–296. doi:10.1016/0022-1694(90)90210-O
- Yuan, D.X., et al., 1996. Karst water system of a peak cluster catchment in South China’s bare karst region and its mathematic model. Guilin: Guangxi normal university publishing house.
- Zajíček, A., et al., 2011. Drainage water temperature as a basis for verifying drainage runoff composition on slopes. Hydrological Processes, 25, 3204–3215. doi:10.1002/hyp.v25.20