
 ?Mathematical formulae have been encoded as MathML and are displayed in this HTML version using MathJax in order to improve their display. Uncheck the box to turn MathJax off. This feature requires Javascript. Click on a formula to zoom.
ABSTRACT
Water scarcity issues in the Johor River Basin (JRB) could affect the populations of Malaysia and Singapore. This study provides an overview of future hydro-meteorological droughts using climate projections from an ensemble of four Coordinated Regional Climate Downscaling Experiments – Southeast Asia (CORDEX-SEA) domain outputs under the Representative Concentration Pathway (RCP) 4.5 and 8.5 scenarios for the 2021–2050 and 2071–2100 periods. The climate projections were bias corrected using the quantile mapping approach before being incorporated into the Soil and Water Assessment Tool (SWAT) hydrological model. The Standardized Precipitation Index (SPI) and Standardized Streamflow Index (SSI) were used to examine the meteorological and hydrological droughts, respectively. Overall, future annual precipitation, streamflow, and maximum and minimum temperatures are projected to change by about −44.2 to 24.3%, −88.7 to 42.2%, 0.8 to 3.7ºC and 0.7 to 4.7ºC, respectively. The results show that the JRB is likely to receive more frequent meteorological droughts in the future.
Editor R. WoodsAssociate editor J. Thompson
1 Introduction
Hydro-meteorological droughts are widely recognized as being among the costliest natural disasters (Esfahanian et al. Citation2017), impacting the environment, the economy and society (Tan et al. Citation2017d). During the past few decades, droughts have led to serious economic losses around the world, e.g. the 2013 drought in China – USD$ 8.5 billion (Sun et al. Citation2014), the 2012 drought in the USA – USD$ 12 billion (AghaKouchak Citation2014), and the 2002–2003 drought in Australia – USD$ 7.4 billion (Heberger Citation2011). Unlike other natural disasters such as floods, earthquakes and typhoons whose impact can be felt immediately, droughts develop gradually over huge regions and over periods from several months to a few years (Lange et al. Citation2017). A drought event normally occurs without warning, and is often only detected when widespread water, agricultural or health issues are triggered (Kiem et al. Citation2016). Therefore, how to identify, quantify and alleviate the impacts of drought have become crucial challenges for scientists and governments.
The freshwater resources in the Johor River Basin (JRB) are crucial for approx. 7 million people in Malaysia and Singapore. As a small island with limited natural water resources, Singapore imports about 40% of its total water demand from Malaysia (Kog Citation2015). Hence, a dramatic reduction of freshwater in the JRB could affect both countries. For instance, a prolonged drought in early 2016 severely decreased the water level of the Linggiu Reservoir from 80% to its historical low of 31%. The drought event caused a water shortage in Malaysia, and the local authorities were forced to implement water rationing. Zin et al. (Citation2013) reported that some regions in Peninsular Malaysia experienced more frequent dry conditions, subverting the belief that this tropical country experiences wet conditions all year round. Nevertheless, the Malaysian government, local authorities and researchers focused more on flood-related issues rather than on drought (Chan Citation1995, Kia et al. Citation2012, Tan et al. Citation2017b). Therefore, studies on drought assessment in this region are relatively limited.
To understand potential future drought characteristic changes over a region, a variety of drought indices can be developed using climate projection information downscaled from global climate models (GCMs) (Rhee and Cho Citation2016, Venkataraman et al. Citation2016, Trinh et al. Citation2017). These regional climate projections are used to drive hydrological models to simulate the future hydrological responses to elevated greenhouse gases in the atmosphere for hydrological drought assessment. Recently, Meresa et al. (Citation2016) calculated the Standardized Precipitation Index (SPI), Standardized Precipitation Evapotranspiration Index (SPEI) and Standardized Streamflow Index (SSI) using the climatic projections from the EURO-CORDEX (Coordinated Regional Climate Downscaling Experiments) products and the HBV (Hydrologiska Byråns Vattenbalansavdelning) hydrological model output to study future hydro-meteorological droughts in 10 Polish catchments. A similar study was conducted by Vu et al. (Citation2016) in Central Vietnam using the SPI and SSI computed from an ensemble of three downscaled regional climate models (RCMs) and the Soil and Water Assessment Tool (SWAT) model. The success of these studies suggests that RCMs are invaluable tools for basin-scale assessment, as it is commonly understood that the raw GCM outputs of coarse resolution may not resolve enough of the regional information that is crucial for regional water cycle and hydrological processes (Fowler et al. Citation2007).
In response to the need for a more comprehensive future hydro-meteorological droughts assessment in the JRB, the objectives of this study are (1) to evaluate the ability of multiple RCMs to represent historical precipitation as well as maximum and minimum temperature simulations over the JRB, and (2) to investigate the potential changes of hydro-meteorological droughts by the end of the 21st century using the SPI and SSI indices. The novel aspect of this study is a better description of the uncertainties about drought impacts, with the use of climate projections from an ensemble of multiple downscaled products. This is a continuation of the work of Tan et al. (Citation2018a), who conducted a detailed historical hydro-meteorological drought assessment of the JRB.
2 Methodology
2.1 Study area
The JRB is located in southern Peninsular Malaysia (). The basin covers an area of 1652 km2, encompassing four main districts of Johor State, namely Johor Bahru, Mersing, Kluang and Kota Tinggi. The Johor River is the main river of the basin, and has a total length of about 122 km (Tan et al. Citation2015b). There are five major tributaries, the Linggiu, Belitong, Sayong, Penggeli and Jengeli rivers. The climate of this basin is classified as a tropical rainforest system, with a mean annual precipitation of about 2500 mm and a mean annual temperature of about 26°C (Tan et al. Citation2015b). The climatology of the JRB is driven mainly by the South China Sea monsoon system, with two opposite regimes, i.e. the northeast monsoon (NEM) from November to February and the southwest monsoon (SWM) from May through to August, with the latter monsoon season bringing less precipitation. There are two shorter inter-monsoon periods (March–April and September–October) that bring intense convective rain in the evening.
Figure 1. Study area.
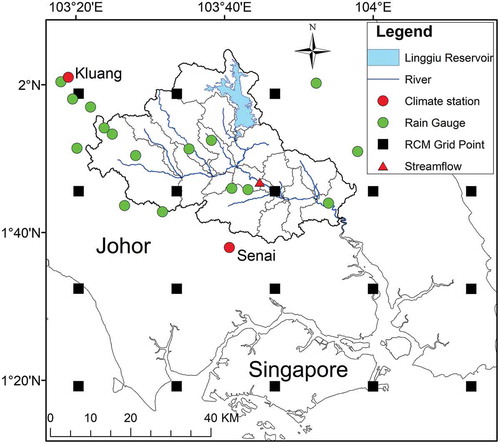
The basin is covered mostly by oil palm plantation due to the agricultural land development projects by the South East Johore Development Authority (KEJORA) and the Federal Land Development Authority (FELDA) (Tan et al. Citation2015b). Iskandar Malaysia, a rapidly on-going urbanization and industrialization programme under the 9th Malaysia Plan, is mainly distributed in the downstream region. In the early 1990s, Linggiu Reservoir was constructed in the northern part of the basin under the 1962 Water Agreement between Singapore and the Johor State government. Singapore was responsible for the reservoir construction, operation and management, with permission to draw up to 250 × 106 gallons of water per day.
2.2 Input data
Daily climate data (<10% missing values) for the period 1975–2005 from 18 stations were collected from the Malaysia Meteorological Department (MMD) and the Department of Irrigation and Drainage Malaysia (DID) (). Data for only two principal climate stations (Kluang and Senai) contain the precipitation, and maximum and minimum temperatures, while the remaining 16 stations measure only rainfall. Missing data were filled with values from the nearest station. Monthly streamflow data at Rantau Panjang station for the period 1976–1989 were obtained from the DID to calibrate and validate the SWAT model. As hydrological data for the Linggiu Reservoir are not available to the public, the SWAT model validation is conducted on data from before the construction of the reservoir in 1990.
In addition to the hydro-climatic data, the spatial data, namely the digital elevation model (DEM), and land-use and soil maps are required for SWAT modelling. A 30-m resolution SRTM (Shuttle Radar Topography Mission) DEM for the Southeast Asia region distributed by the US Geological Survey (USGS) via the Earth Explorer websiteFootnote1 was used. Land-use and soil maps were digitized from the printed maps from the Ministry of Agriculture and Agro-based Industry Malaysia (MOA), while soil properties, such as soil texture and depth for local SWAT soil database development, were extracted from a Peninsular Malaysia soil manual (Pushparajah and Amin Citation1977).
2.3 Climate projection
A schematic diagram of the research framework is shown in . In this study, dynamically downscaled products from the archive of the CORDEX-SEA (Southeast Asia) project were used to drive the calibrated SWAT model to examine the local hydrological responses to warmer climate. These downscaled climate projections were produced at 25 km × 25 km based on two different emissions scenarios, namely the RCP (Representative Concentration Pathway) 4.5 and RCP8.5 scenarios. Details of the CORDEX-SEA project numerical simulations are reported in a series of publications, i.e. Juneng et al. (Citation2016) and Ngo-Duc et al. (Citation2016). The large combination matrix of GCMs-RCMs and RCPs in CORDEX-SEA allows better examination of climate change projection uncertainties at various modelling levels. However, only four sets of RCM downscaled products were used in the current study based on the data availability at the time the modelling works were carried out. The data were made available at daily resolution. summarizes the downscaled climate change projection products used in this study. The GCM-RCM combinations comprise three different GCMs dynamically downscaled by three different RCMs for a variety of climate projections. The downscaled GCMs are (a) CNRM-CM5 from the French National Centre for Meteorological Research, (b) GFDL-ESM2M from the Geophysical Fluid Dynamic Laboratory, USA, and (c) HadGEM2 from the UK Met Office. The regional models used are (i) RegCM4, developed by the International Centre for Theoretical Physics, (ii) WRF, developed by the National Center for Atmospheric Research, USA, and (iii) RCA4, developed by the Rossby Centre, Swedish Meteorological and Hydrological Institute.
Table 1. Summary of climate projections. RCM: regional climate model.
Figure 2. Framework of the study.
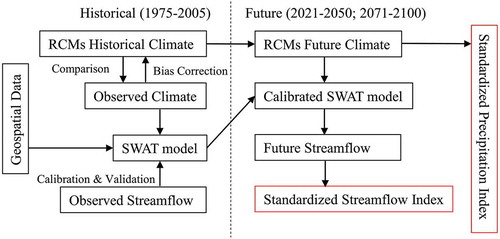
As with the GCMs, the RCM simulations suffer from systematic biases (Ngai et al. Citation2017). Therefore, these systematic biases need to be removed before the product can be used for further hydrological impact assessment. In the current study a quantile mapping (QM) bias-correction algorithm is adopted to adjust the biases of the selected CORDEX-SEA RCM projections. The QM bias-correction technique has been widely used in hydrological applications (Dettinger et al. Citation2004, Boé et al. Citation2007) to remove the systematic distribution bias of climate model simulation output (Piani et al. Citation2010). It adjusts the errors in the shape of the simulated data distribution with reference to the observed distribution. There are different versions of the QM technique. In this work, we employed the empirical quantile distribution-based algorithm developed by Ngai et al. (Citation2017), which preserves the long-term changes of the RCM projections while correcting for the daily simulated output statistical properties. For each value in the modelled data, its quantile with respect to the distribution was estimated. Observations corresponding to the similar quantile are determined from the observed distribution. The adjusted precipitation, P′sim is computed as:
while the adjusted temperature, T′sim is computed as:
where F is the adjustment factor and r indicates the rth quantile.
The algorithm first adjusts the simulated data based on the historical climatological differences between the simulation output and the observed monthly data. The adjustment uses multiplicative factors and additive constant offsets for the precipitation and temperature (Tmin and Tmax), respectively. Next, the monthly mean time series of the model output is measured. Daily variability of the temperature (Tmin and Tmax) about these mean values is extracted. However, the daily precipitation values are normalized with respect to these monthly mean values. The QM bias-adjustment algorithm (Equations (1)–(4)) is then applied to the normalized daily precipitation time series and the daily temperature residual time series. The monthly mean time series are then augmented to the adjusted daily residual or normalized time series. This preserves the long-term changes of the RCM-simulated mean precipitation and temperature. Readers are referred to Ngai et al. (Citation2017) for a detailed description of the bias-correction method.
The performance of the original and bias-corrected RCMs driven by GCMs is evaluated by comparing them with the station records using the mean absolute error (MAE) and climatological changes in precipitation, and maximum and minimum temperatures. The MAE is a quantity used to measure how close the simulated historical climate data are to the observations. The smaller the MAE value, the smaller the difference between the RCM and observations (Venkataraman et al. Citation2016). The statistical metric is calculated as follows:
where R represents the RCM values, O represents the observations and n is the number of data values. Besides, the annual precipitation and temperature trends of the observed and RCM data were compared using the Mann-Kendall (MK) test and Sen’s slope. These tests can assess the capability of the RCM to capture long-term trends and changes in their magnitude. A significance level of p = 0.05 was used for a significant change detection. The MAE and trend evaluation were conducted using data from the Kluang and Senai stations because only these two stations had recorded precipitation, as well as maximum and minimum temperature data.
2.4 Drought indices
The SPI was developed by McKee et al. (Citation1993) for measuring drought at a specific location using monthly precipitation data. As recommended by the World Meteorological Organization (WMO), the SPI has been widely used to detect, analyse and monitor droughts (Hayes et al. Citation2011, Yusof et al. Citation2013, Li and Wang Citation2016). Detailed calculations of the SPI can be found in Vu et al. (Citation2015). The index can be computed for different time scales, ranging from 1 to 48 months, to examine drought events of different time scales. Modarres (Citation2007) introduced the SSI for hydrological meteorological assessment, which was further investigated by Telesca et al. (Citation2012) in the Ebro Basin, Spain. It has a similar mathematical concept to that of the SPI, with monthly streamflow data used as input.
As the meteorological drought condition in Malaysia generally recovers within three months (Sanusi et al. Citation2015), the drought indices were measured on a 3-month time scale. In addition, the 3-month time scale is very useful in assessing seasonal changes. The dry/wet conditions were categorized based on the SPI and SSI values, as listed in . Meteorological and hydrological droughts are regarded as extreme events if the index values are less than −2. More information on drought indices can be found in the Handbook of Drought Indicators and Indices (Svoboda and Fuchs Citation2016). To compare the drought frequency and duration between historical and future periods, a drought event was defined as having SPI/SSI < − for at least three months.
Table 2. Climate index classification.
2.5 SWAT model
The SWAT model is a continuous-time, semi-distributed and process-based hydrological model developed by the US Department of Agriculture and Texas A&M University (Arnold et al. Citation1998). It has been widely used for various applications such as climate change, land-use management, ecosystem services, water quality analysis and water resources management (Gassman et al. Citation2007, Bressiani et al. Citation2015). In the SWAT model, a basin is first divided into multiple sub-basins, and then further divided into hydrological response units (HRUs). The hydrological cycle was simulated in each HRU using the water balance equation (Neitsch et al. Citation2011).
In Malaysia, the SWAT model has been successfully applied in several major basins, i.e. the JRB (Tan et al. Citation2014, Citation2015b), Kelantan River Basin (Tan et al. Citation2017a, Citation2017c, Citation2018b), Hulu Langat River Basin (Memarian et al. Citation2014), Kuantan River Basin (Mohd et al. Citation2015) and Bukit Merah catchment (Hasan et al. Citation2012). A finer-resolution SRTM DEM (30 m) was used in this study. In addition, the digitized river networks were integrated in the basin delineation and river network formation processes using the “burn-in” approach. The HRU threshold values were defined as 10% for soil and 20% for land use and slope.
Calibration and validation are essential before the SWAT model is applied to study our environment (Arnold et al. Citation2012). In this study, the widely applied semi-automated Sequential Uncertainty Fitting algorithm (SUFI-2) within the SWAT Calibration and Uncertainty (SWAT-CUP) tool was used (Schuol et al. Citation2008, Abbaspour et al. Citation2009). The first step in the SUFI-2 is the determination of the most sensitive parameters using the global sensitivity approach. A set of suitable parameters was then used for SWAT calibration. After rigorous calibration, the optimal parameter ranges were used to validate the SWAT model. Three statistical metrics, the Nash-Sutcliffe efficiency criterion (NSE), the coefficient of determination (R2) and the percentage bias (PB), were used to evaluate the performance of the SWAT model. More information on these statistical metrics can be found in Tan et al. (Citation2017c). The SWAT model can be regarded as giving “very good” and “good” performance, if the NSE value ranges from 0.75 to 1 and 0.65 to 0.75, respectively (Moriasi et al. Citation2007).
3 Results
3.1 Evaluation of RCM performance
The capability of the downscaled product of the four different RCMs and their ensemble mean in representing the JRB climatology is examined. depicts the original and bias-corrected values of the precipitation, and maximum and minimum temperatures averaged over the entire JRB. The observed historical rainfall is generally characterized by two peaks, with the primary peak recorded in December and the secondary peak in March–April ()). It is noted that the RCM downscaled rainfall generally produced the bi-modal characteristics of the rainfall annual cycle, but the primary peak is shifted much earlier to October–November. This shift is produced across all the RCM products. Despite considerable inter-model variations, the simulated rainfall registered general wet biases with the RegCM4 downscaled GFDL-ESM2M showing the largest positive bias. This affects the ensemble mean, which shows similar characteristics of moderate wet bias.
Figure 3. Comparison of the climatology cycle between the RCMs and observed data under the (a) original precipitation, Pn; (b) original maximum temperature, Tx; (c) original minimum temperature, Tn; (d) bias-corrected precipitation, Pr_BC; (e) bias-corrected maximum temperature, Tx_BC; and (f) bias-corrected minimum temperature, Tn_BC for the period 1975–2005.
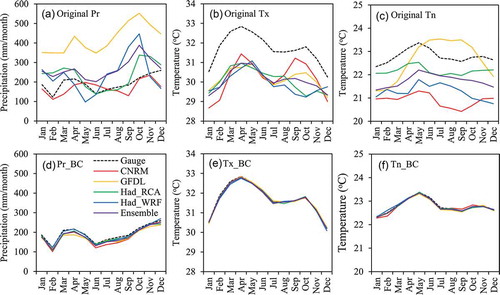
The maximum temperature, however, is rather well reproduced by the RCM downscaling, showing a peak around April, despite the fact that the model simulations produced a systematic cold bias of about 2°C ()). The inter-model variations are rather minimal except during the September–October inter-monsoon period. Comparatively, the minimum temperature simulations show much larger inter-model variations, indicating larger uncertainty of the modelled nocturnal processes, as shown in ). The RegCM4 downscaled minimum temperature from GFDL-ESM2M shows inconsistency with the observations, with the peak of minimum temperature much delayed and prolonged during June–July–August instead of in May. Similarly, the RCM products registered general cold biases of approx. 1°C. The systematic biases in the RCM simulations are inevitable for various intrinsic and practical reasons. In hydrological assessment, it is common practice to apply some bias-correction methods to post-process the variables before using them in hydrological models, so the quantile mapping approach was used to improve the reliability of the hydro-meteorological drought projections ().
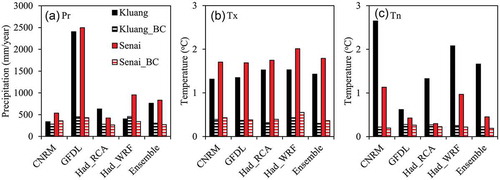
presents an evaluation of the historical original and bias-corrected RCM projections in the annual total precipitation, and annual mean maximum and minimum temperatures using the MAE. Interestingly, the MAE shows that the original CNRM-CM5_RCA4 performed better in precipitation simulations, while the maximum and minimum temperatures were best reproduced by the original GFDL-ESM2M_RegCM4. The quantile mapping approach substantially reduced the bias for the annual precipitation, and maximum and minimum temperature data.
Figure 4. Mean absolute error (MAE) of the RCMs in simulating annual historical (a) precipitation (Pr), (b) maximum temperature (Tx) and (c) minimum temperature (Tn) at the Kluang (48672) and Senai (48679) stations.
Annual trends in the precipitation, and maximum and minimum temperatures of the observations and RCMs are shown in . An insignificant increasing trend was found in the observed precipitation, which is similar to the other RCMs, except the HadGEM2_RCA4 at the Kluang station. In contrast, statistically significant trends were detected in the observed maximum and minimum temperature, which are consistent for all RCMs, except the HadGEM2_WRF for the maximum temperature. However, the magnitude changes of the RCMs are lower than those of the observations. For example, the observed minimum temperature at the Kluang station increased by 0.33°C/decade, but the RCM simulations show increments of between 0.14 and 0.25°C/decade.
Table 3. Annual trends (changes per decade) of observed and RCM precipitation (Pr), maximum temperature (Tx) and minimum temperature (Tn) for the period 1975–2005 at the Kluang (48672) and Senai (48679) stations. MK: Mann-Kendall test; Sen: Sen’s slope. Bold indicates significance at p = 0.05.
3.2 SWAT calibration and validation
Overall, the basin was divided into 21 sub-basins with 78 HRUs. The first year (1975) of SWAT simulation served as a warm-up period to initiate the model. The global sensitivity analysis indicated that the most sensitive parameter was the baseflow alpha factor (ALPHA_BF), followed by the other 11 parameters, as listed in . The ALPHA_BF is the baseflow recession constant, which is a direct index of the groundwater flow response to changes in recharge, while the CN2 – the initial Soil Conservation Service (SCS) Curve Number (CN) II value – is a function of the soil permeability and land-use conditions that control surface runoff in the basin. Both parameters have also been found to be sensitive in other SWAT studies in Malaysia (Memarian et al. Citation2014, Tan et al. Citation2015b, Citation2017c).
Table 4. SWAT sensitivity analysis and calibration. Parameters are sorted from most sensitive (no. 1) to least sensitive (no. 12). V_ indicates that the original parameter value is replaced by a value, while R_ indicates that the original parameter is multiplied by (1 + a given value).
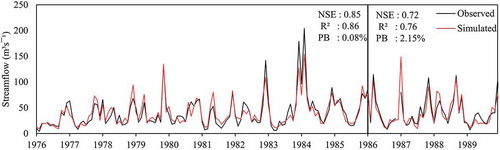
Visual comparison of the monthly observed and simulated streamflow at the Rantau Panjang station for the calibration (1976–1985) and validation (1986–1989) periods is shown in . The NSE, R2 and PB values were 0.85, 0.86 and 0.08%, respectively, for the calibration period. The optimized parameters () obtained from the calibration process were implemented in the SWAT model for validation purposes. For the validation period, the NSE, R2 and PB values were 0.72, 0.76 and 2.15%, respectively. This result indicates that the SWAT model can satisfactorily simulate the streamflow in the basin. The current SWAT model performs better compared to the previous SWAT studies in the same basin (Tan et al. Citation2014, Citation2015b). This could be because the DEM resolutions ranging from 20 to 50 m have more accurate performance in the SWAT streamflow simulations (Tan et al. Citation2015a). In this study, we applied the latest SRTM DEM at 30 m resolution, while the previous work used a coarser resolution SRTM DEM of 90 m.
Figure 5. Comparison of monthly observed and simulated SWAT for calibration (1976–1985) and validation (1986–1989) periods.
3.3 Future meteorological drought
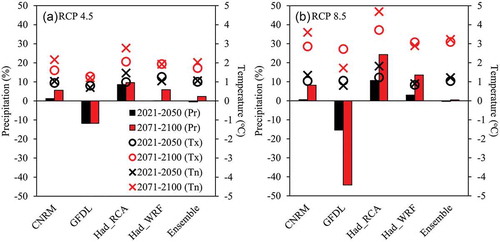
The average annual changes in the future climate projections for the periods 2021–2050 and 2071–2100 under the RCP4.5 and RCP8.5 scenarios against the historical mean of the 1976–2005 period are shown in . Note that the projection of precipitation shows considerable inter-model variation, with changes in future precipitation ranging from about −11.8 to 9.6% and −44.2 to 24.3% under the RCP4.5 and RCP8.5 scenarios, respectively. In contrast, the maximum and minimum temperatures are projected to increase by 0.8–2.1°C/0.8–3.7°C and 0.7–2.8°C/0.8–4.7°C under the RCP4.5/RCP8.5 scenarios. Collectively, the precipitation change is expected to be marginal under the RCP4.5 scenario, while the under RCP8.5 scenario the multi-projection ensemble mean suggests a marked reduction of rainfall towards the end of the century.
Figure 6. Changes in annual precipitation, and maximum and minimum temperatures under (a) RCP4.5 and (b) RCP8.5 scenarios against the historical mean (1976–2005).
illustrates the monthly changes in future precipitation and temperature, as projected by RCMs, compared to the historical period. In the 2021–2050 period, monthly precipitation is projected to vary in the range −46.3 to 42.9% and −60.3 to 58.5% under the RCP4.5 and RCP8.5 scenarios, respectively. Interestingly, the uncertainty ranges of the precipitation and the minimum temperature under the RCP8.5 scenario are larger than those under RCP4.5, particularly in the 2071–2100 period. This suggests that the models tend to disagree with each other more in their response to higher radiative forcing compared to lower radiative forcing. This is consistent with Shen et al. (Citation2018), who reported, when quantifying the impact of climate change on hydrology using GCMs, that the uncertainty under a high emissions scenario is much larger than that under a relatively low emissions scenario.
Figure 7. Monthly changes in precipitation, and maximum and minimum temperatures under the RCP4.5 and RCP8.5 scenarios for the 2021–2050 and 2071–2100 periods against the 1976–2005 historical period. The shading indicates the ensemble range by all climate projections.
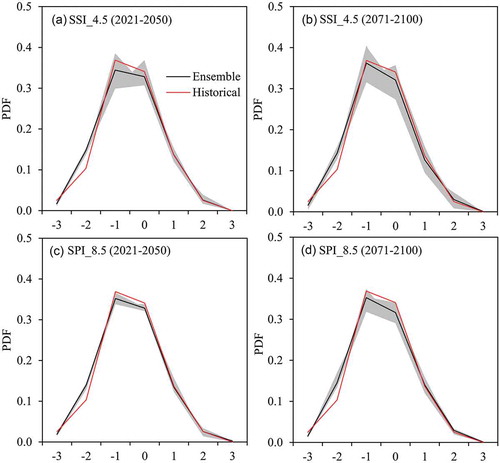
shows the probability density functions (pdfs) of SPI-3 for different RCP scenarios and periods. The uncertainty ranges from various RCMs are wider under the SPI values in the range from −1 to 1 (near normal condition) compared to other drought classes. As compared to the historical period, the probability of “very dry” drought occurrence is projected to increase under both the RCP4.5 and RCP8.5 scenarios (). Moreover, indicates that the highest number of meteorological droughts is projected for the 2021–2050 period under the RCP4.5 scenario. It is interesting to note that there are likely to be more meteorological drought events in the future.
Figure 8. Probability density function (pdf) of the historical (1976–2005) and future (2021–2050 and 2071–2100) SPI-3 under the (a,b) RCP4.5 and (c,d) RCP8.5 scenarios.
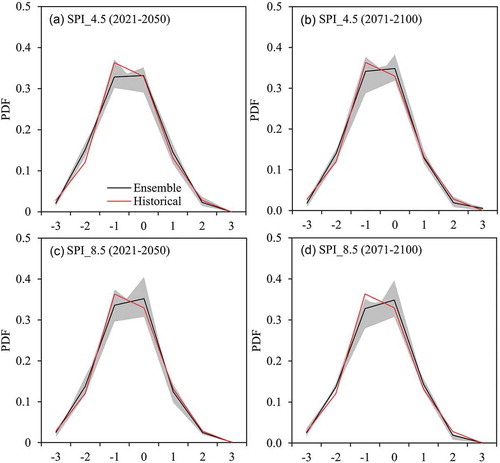
Figure 9. Comparison of the number and duration of the historical and future (a,c) meteorological and (b,d) hydrological droughts of the JRB under the RCP4.5 and RCP8.5 scenarios.
3.4 Future hydrological droughts
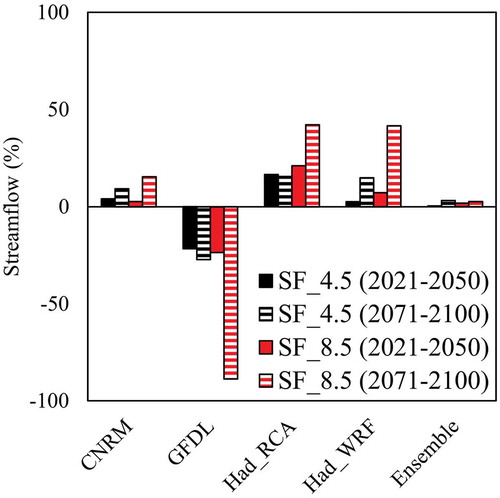
shows the projected changes in annual streamflow in the 2021–2050 and 2071–2100 periods compared to the mean 1975–2005 period at the Rantau Panjang station. The results indicate that the change in future annual streamflow would vary from −27.1 to 16.6% and −88.7 to 42.2% under the RCP4.5 and RCP8.5 scenarios, respectively. Interestingly, the GFDL-ESM2M_RegCM4 showed an opposite streamflow trend compared to other RCMs. These differences can be explained in part by the different projected changes of precipitation as indicated in . The projection of precipitation by the climate models is known to be highly uncertain and may show different signs of change due to different feedback processes in the climate system representation and the response to radiative forcings (Kent et al. Citation2015).
Figure 10. Relative changes in the future annual streamflow against the historical period under various climate projections and RCP scenarios.
As shown in , the probability of “very dry” hydrological drought occurrence in the future is higher than in the historical period. Besides, the normal hydrological condition (SSI = ±1) is projected to be smaller in the future. ) indicates the number of future hydrological droughts ranging from five to 13 events in each evaluated period. A rise in temperature by up to 4.7°C () may dramatically exacerbate the drought condition. For instance, the strong 1997/98 El Niño resulted in one of the most severe droughts in Malaysia (Nakagawa et al. Citation2000).
Figure 11. Probability density function (pdf) of the historical (1976–2005) and future (2021–2050 and 2071–2100) SSI-3 under the (a,b) RCP4.5 and (c,d) RCP8.5 scenarios.
4 Discussion
Evaluation of the performance of the different RCMs in simulating the historical climate is essential to understand their behaviour and variability before applying them in hydro-climatic studies. In general, the RCMs performed better in the historical temperature simulations compared to those of precipitation in the JRB. Foughali et al. (Citation2015) also found a similar situation in northern Tunisia when using RCMs produced by the European ENSEMBLES project. This result is likely to be related to the high spatial variability and magnitude of the precipitation processes, which the models are unable to capture (Aloysius et al. Citation2016). In general, all the RCMs produce too much precipitation over the JRB, except for the GFDL-ESM2M_RegCM4.
Climate models are regarded as having the largest uncertainty in hydro-climatic studies (Todd et al. Citation2011, Bennett et al. Citation2012, Tan et al. Citation2014). This is due to the different parameterizations and structures of the climate models, which result in different responses and sensitivity to radiative forcing. Surprisingly, the uncertainty range of the anomaly changes in the minimum temperature is larger than for the maximum temperature, as shown in . This finding may be explained by the model differences in cloud behaviour simulations (Lobell et al. Citation2007, Tatsumi et al. Citation2015). We found that the minimum temperature variability of the HadGEM2_RCA4 is the largest of all the models. Therefore, the effects of cloud cover on the minimum temperature of the RCM should be studied further. To account for the climate projection uncertainty, application of a multi-model ensemble is more desirable than a single model (Tebaldi and Knutti Citation2007). In this study, we used the widely applied simple un-weighted averaging approach, instead of other ensemble techniques such as the Bayesian model averaging and reliability ensemble averaging. This is because the choice of different weighting schemes can produce different results, which can introduce another source of uncertainty (Chandler Citation2013). However, more work on the multi-model ensemble technique and uncertainty analysis should be conducted to improve the reliability of future climate projections.
Generally, many studies in tropical regions have reported the performance of the SWAT model as satisfactory, whereas a very good performance (NSE ≥ 0.75) is difficult to achieve. This is mainly due to the fact that Southeast Asia has one of the most productive land-use types in the world, and agricultural land has become the dominant landscape. However, many crops in this region are not currently included in the SWAT plant parameter database. Moreover, the SWAT plant growth was developed for temperate regions, so it may not be suitable for use in tropical regions (Wagner et al. Citation2011). To tackle this issue, Strauch and Volk (Citation2013) modified the SWAT plant growth model to improve the modelling of perennial vegetation in the Santa Maria/Torto watershed in Central Brazil. Sakaguchi et al. (Citation2014) developed a paddy module by modifying an algorithm designed for pothole landscapes within the SWAT model. These studies have shown that the modified plant modules perform better than the conventional SWAT model. Such SWAT plant module modification is still limited for crops in Southeast Asia, e.g. to the oil palm module which is important for Malaysia, Indonesia and Thailand. Hence, there is an urgent need to expand the plant parameter database for this region to produce better SWAT simulations.
The results show that the JRB is projected to receive more frequent meteorological droughts in the future. The drought vulnerability and risk are much higher in Johor compared to Singapore due to the low adaptive capacity (Chuah et al. Citation2018). As such, local authorities in Johor should improve the water resources management of the JRB to lower the drought risk in the future. However, it should be noted that the hydro-meteorological drought patterns presented in this work give a broad range of possible future conditions. This is not a precise assessment of the future frequency, timing and intensity of specific drought events.
5 Conclusions
This study evaluated the future hydro-meteorological drought conditions in the Johor River Basin (JRB), Malaysia. The JRB supplies freshwater to populations in Malaysia and Singapore, so a water scarcity issue within the basin could lead to tensions. Future climate projections for the 2021–2050 and 2071–2100 periods under the representative concentration pathways emissions scenarios, RCP4.5 and RCP8.5, were extracted from four CORDEX-SEA regional climate models. These climate projections were bias corrected using the quantile mapping approach before being incorporated into the SWAT hydrological model. The hydro-meteorological droughts were measured based on the Standardized Precipitation Index (SPI) and Standardized Streamflow Index (SSI).
The CNRM-CM5_RCA4 showed the best performance in precipitation simulation, while the GFDL-ESM2M_RegCM4 performed the best for the maximum and minimum temperatures. Most of the RCMs tend to overestimate the precipitation variability, but underestimate the maximum and minimum temperature variability. Interestingly, the uncertainty range of the minimum temperature is greater than that of the maximum temperature. This could be due to the poor simulations of cloud formation in the HadGEM2_RCA4 model.
Overall, an ensemble of four RCMs projects that the annual precipitation, and maximum and minimum temperatures in the basin will change by about −44.2 to 24.3%, and 0.8–3.7°C and 0.7–4.7°C, respectively, in the 21st century across the RCP4.5 and RCP8.5 scenarios. This would cause the annual streamflow at the Rantau Panjang station to vary by between – 88.7 and 42.2%. The number of meteorological droughts is projected to increase under both the RCP4.5 and RCP8.5 scenarios, particularly in the 2021–2050 period.
Considerably more work will need to be done to improve the reliability of the RCMs in simulating historical and future climate projections. For example, further studies should be undertaken to explore the impacts of different ensemble techniques. More bias correction, model modification and algorithm improvement of GCMs should be conducted in the future. In addition, more drought indices, such as the Standardized Precipitation Evapotranspiration Index (SPEI), Palmer Drought Severity Index (PDSI) and Standardized Water-level Index (SWI), that account for other variables should be included to evaluate the uncertainty of the drought indices.
Acknowledgements
Special thanks go to the Malaysia Meteorological Department (MMD), Department of Irrigation and Drainage Malaysia (DID) and Ministry of Agriculture and Agro-based Industry Malaysia (MOA) for providing the hydro-climatic and geographical data used in this study. The SEACLID/CORDEX-SEA downscaled products were made available via the SEACLID/CORDEX-SEA project funded by APN (ARCP2013-17NMY-Tangang, ARCP2014-07CMY-Tangang, ARCP2015-04CMY-Tangang). We thank Dr Vivien Chua for motivating us to work on this topic.
Disclosure statement
No potential conflict of interest was reported by the authors.
Additional information
Funding
Notes
References
- Abbaspour, K.C., et al., 2009. Assessing the impact of climate change on water resources in Iran. Water Resources Research, 45, 16. doi:10.1029/2008WR007615
- AghaKouchak, A., 2014. A baseline probabilistic drought forecasting framework using standardized soil moisture index: application to the 2012 United States drought. Hydrology and Earth System Sciences, 18 (7), 2485–2492. doi:10.5194/hess-18-2485-2014
- Aloysius, N.R., et al., 2016. Evaluation of historical and future simulations of precipitation and temperature in central Africa from CMIP5 climate models. Journal of Geophysical Research: Atmospheres, 121 (1), 130–152.
- Arnold, J.G., et al., 2012. SWAT: model use, calibration, and validation. Transactions of the ASABE, 55 (4), 1491–1508. doi:10.13031/2013.42256
- Arnold, J.G., et al., 1998. Large area hydrologic modeling and assessment - part 1: model development. Journal of the American Water Resources Association, 34 (1), 73–89. doi:10.1111/jawr.1998.34.issue-1
- Bennett, K.E., Werner, A.T., and Schnorbus, M., 2012. Uncertainties in hydrologic and climate change impact analyses in headwater basins of British Columbia. Journal of Climate, 25 (17), 5711–5730. doi:10.1175/JCLI-D-11-00417.1
- Boé, J., et al., 2007. Statistical and dynamical downscaling of the Seine basin climate for hydro-meteorological studies. International Journal of Climatology, 27 (12), 1643–1655. doi:10.1002/(ISSN)1097-0088
- Bressiani, D.D., et al., 2015. Review of Soil and Water Assessment Tool (SWAT) applications in Brazil: challenges and prospects. International Journal of Agricultural and Biological Engineering, 8 (3), 9–35.
- Chan, N.W., 1995. Flood disaster management in Malaysia: an evaluation of the effectiveness of government resettlement schemes. Journal Disaster Prevention and Management, 4 (4), 22–29. doi:10.1108/09653569510093405
- Chandler, R.E., 2013. Exploiting strength, discounting weakness: combining information from multiple climate simulators. Philosophical Transactions of the Royal Society a-Mathematical Physical and Engineering Sciences, 371 (1991), 19. doi:10.1098/rsta.2012.0388
- Chuah, C.J., Ho, B.H., and Chow, W.T.L., 2018. Trans-boundary variations of urban drought vulnerability and its impact on water resource management in Singapore and Johor, Malaysia. Environmental Research Letters, 13 (7), 074011. doi:10.1088/1748-9326/aacad8
- Dettinger, M.D., et al., 2004. Simulated hydrologic responses to climate variations and change in the Merced, Carson, and American River Basins, Sierra Nevada, California, 1900–2099. Climatic Change, 62 (1–3), 283–317. doi:10.1023/B:CLIM.0000013683.13346.4f
- Esfahanian, E., et al., 2017. Development and evaluation of a comprehensive drought index. Journal of Environmental Management, 185, 31–43. doi:10.1016/j.jenvman.2016.10.050
- Foughali, A., et al., 2015. Hydrological modeling in Northern Tunisia with regional climate model outputs: performance evaluation and bias-correction in present climate conditions. Climate, 3, 459–473. doi:10.3390/cli3030459
- Fowler, H.J., Blenkinsop, S., and Tebaldi, C., 2007. Linking climate change modelling to impacts studies: recent advances in downscaling techniques for hydrological modelling. International Journal of Climatology, 27 (12), 1547–1578. doi:10.1002/(ISSN)1097-0088
- Gassman, P.W., et al., 2007. The soil and water assessment tool: historical development, applications, and future research directions. Transactions of the ASABE, 50 (4), 1211–1250. doi:10.13031/2013.23637
- Hasan, Z.A., et al., 2012. Flow and sediment yield simulations for Bukit Merah reservoir catchment, Malaysia: a case study. Water Science and Technology : a Journal of the International Association on Water Pollution Research, 66 (10), 2170–2176. doi:10.2166/wst.2012.432
- Hayes, M., et al., 2011. The Lincoln declaration on drought indices. Bulletin of the American Meteorological Society, 92 (4), 485–488. doi:10.1175/2010BAMS3103.1
- Heberger, M., 2011. Australia’s Millennium drought: impacts and responses. In: P.H. Gleick, ed. The world’s water: the biennial report on freshwater resources. Washington, DC: Island Press/Center for Resource Economics, 97–125.
- Juneng, L., et al., 2016. Sensitivity of Southeast Asia rainfall simulations to cumulus and air-sea flux parameterizations in RegCM4. Climate Research, 69 (1), 59–77. doi:10.3354/cr01386
- Kent, C., Chadwick, R., and Rowell, D.P., 2015. Understanding uncertainties in future projections of seasonal tropical precipitation. Journal of Climate, 28, 4390–4413. doi:10.1175/JCLI-D-14-00613.1
- Kia, M.B., et al., 2012. An artificial neural network model for flood simulation using GIS: Johor River Basin, Malaysia. Environmental Earth Sciences, 67 (1), 251–264. doi:10.1007/s12665-011-1504-z
- Kiem, A.S., et al., 2016. Natural hazards in Australia: droughts. Climatic Change, 139 (1), 37–54. doi:10.1007/s10584-016-1798-7
- Kog, Y.C., 2015. Transboundary urban water: the case of Singapore and Malaysia. In: Q. Grafton, et al., eds.. Understanding and managing urban water in transition. Global issues in water policy. Vol. 15. Dordrecht: Springer, 575–591.
- Lange, B., Holman, I., and Bloomfield, J.P., 2017. A framework for a joint hydro-meteorological-social analysis of drought. Science of the Total Environment, 578, 297–306. doi:10.1016/j.scitotenv.2016.10.145
- Li, C. and Wang, R., 2016. Recent changes of precipitation in Gansu, Northwest China: an index-based analysis. Theoretical and Applied Climatology, 129 (1–2), 397–412. doi:10.1007/s00704-016-1783-0
- Lobell, D.B., Bonfils, C., and Duffy, P.B., 2007. Climate change uncertainty for daily minimum and maximum temperatures: a model inter‐comparison. Geophysical Research Letters, 34, 5. doi:10.1029/2006GL028726
- McKee, T.B., Doesken, N.J., and Kleist, J., The relationship of drought frequency and duration to time scales. In Proceedings of the 8th conference on applied climatology, 1993 Anaheim, California, 179–183.
- Memarian, H., et al., 2014. SWAT-based hydrological modelling of tropical land use scenarios. Hydrological Sciences Journal, 59 (10), 1808–1829. doi:10.1080/02626667.2014.892598
- Meresa, H.K., Osuch, M., and Romanowicz, R., 2016. Hydro-meteorological drought projections into the 21–st century for selected polish catchments. Water, 8 (5), 206. doi:10.3390/w8050206
- Modarres, R., 2007. Streamflow drought time series forecasting. Stochastic Environmental Research and Risk Assessment, 21 (3), 223–233. doi:10.1007/s00477-006-0058-1
- Mohd, M.S.F., et al., 2015. Assessment of impacts of climate change on streamflow trend in upper Kuantan watershed. ARPN Journal of Engineering and Applied Sciences, 10 (15), 6634–6642.
- Moriasi, D.N., et al., 2007. Model evaluation guidelines for systematic quantification of accuracy in watershed simulations. Transactions of the ASABE, 50 (3), 885–900. doi:10.13031/2013.23153
- Nakagawa, M., et al., 2000. Impact of severe drought associated with the 1997–1998 El Nino in a tropical forest in Sarawak. Journal of Tropical Ecology, 16, 355–367. doi:10.1017/S0266467400001450
- Neitsch, S.L., et al., 2011. Soil and water assessment tool theoretical documentation version 2009. Texas: Texas Water Resources Institute.
- Ngai, S.T., Tangang, F., and Juneng, L., 2017. Bias correction of global and regional simulated daily precipitation and surface mean temperature over Southeast Asia using quantile mapping method. Global and Planetary Change, 149, 79–90. doi:10.1016/j.gloplacha.2016.12.009
- Ngo-Duc, T., et al., 2016. Performance evaluation of RegCM4 in simulating extreme rainfall and temperature indices over the CORDEX-Southeast Asia region. International Journal of Climatology, 37 (3), 1634–1647. doi:10.1002/joc.4803
- Piani, C., Haerter, J.O., and Coppola, E., 2010. Statistical bias correction for daily precipitation in regional climate models over Europe. Theoretical and Applied Climatology, 99 (1), 187–192. doi:10.1007/s00704-009-0134-9
- Pushparajah, E. and Amin, L.L., 1977. Soils under hevea and their management in Peninsular Malaysia. Kuala Lumpur: Lai Than Fong Press.
- Rhee, J. and Cho, J., 2016. Future changes in drought characteristics: regional analysis for South Korea under CMIP5 projections. Journal of Hydrometeorology, 17 (1), 437–451. doi:10.1175/JHM-D-15-0027.1
- Sakaguchi, A., et al., 2014. Development and evaluation of a paddy module for improving hydrological simulation in SWAT. Agricultural Water Management, 137, 116–122. doi:10.1016/j.agwat.2014.01.009
- Sanusi, W., et al., 2015. The drought characteristics using the first-order homogeneous Markov chain of monthly rainfall data in Peninsular Malaysia. Water Resources Management, 29 (5), 1523–1539. doi:10.1007/s11269-014-0892-8
- Schuol, J., et al., 2008. Estimation of freshwater availability in the West African sub-continent using the SWAT hydrologic model. Journal of Hydrology, 352 (1–2), 30–49. doi:10.1016/j.jhydrol.2007.12.025
- Shen, M., et al., 2018. Estimating uncertainties and its temporal variation related to global climate models in quantifying climate change impacts on hydrology. Journal of Hydrology, 556, 10–24. doi:10.1016/j.jhydrol.2017.11.004
- Strauch, M. and Volk, M., 2013. SWAT plant growth modification for improved modeling of perennial vegetation in the tropics. Ecological Modelling, 269, 98–112. doi:10.1016/j.ecolmodel.2013.08.013
- Sun, Y., et al., 2014. Rapid increase in the risk of extreme summer heat in Eastern China. Nature Climate Change, 4 (12), 1082–1085. doi:10.1038/nclimate2410
- Svoboda, M. and Fuchs, B., 2016. Handbook of drought indicators and indices. Integrated Drought Management Programme (IDMP), Integrated Drought Management Tools and Guidelines Series 2. Geneva: World Meteorological Organization (WMO) and Global Water Partnership (GWP). Available from: http://www.droughtmanagement.info/indices/
- Tan, M.L., et al., 2015b. Impacts of land-use and climate variability on hydrological components in the Johor River basin, Malaysia. Hydrological Sciences Journal, 60 (5), 873–889.
- Tan, M.L., et al., 2018a. Spatiotemporal analysis of hydro-meteorological drought in the Johor River Basin, Malaysia. Theoretical and Applied Climatology. doi:10.1007/s00704-018-2409-5
- Tan, M.L., et al., 2015a. Impacts of DEM resolution, source, and resampling technique on SWAT-simulated streamflow. Applied Geography, 63, 357–368. doi:10.1016/j.apgeog.2015.07.014
- Tan, M.L., et al., 2014. Impacts and uncertainties of climate change on streamflow of the Johor River Basin, Malaysia using a CMIP5 general circulation model ensemble. Journal of Water and Climate Change, 5 (4), 676–695. doi:10.2166/wcc.2014.020
- Tan, M.L., Gassman, P.W., and Cracknell, A.P., 2017a. Assessment of three long-term gridded climate products for hydro-climatic simulations in tropical river basins. Water, 9 (3), 229. doi:10.3390/w9030229
- Tan, M.L., et al., 2017b. Changes in precipitation extremes over the Kelantan River Basin, Malaysia. International Journal of Climatology, 37 (10), 3780–3797. doi:10.1002/joc.4952
- Tan, M.L., et al., 2017c. Climate change impacts under CMIP5 RCP scenarios on water resources of the Kelantan River Basin, Malaysia. Atmospheric Research, 189, 1–10. doi:10.1016/j.atmosres.2017.01.008
- Tan, M.L., Ramli, H.P., and Tam, T.H., 2018b. Effect of DEM resolution, source, resampling technique and area threshold on SWAT outputs. Water Resources Management, 32 (14), 4591–4606. doi:10.1007/s11269-018-2072-8
- Tan, M.L., et al., 2017d. Evaluation of TRMM product for monitoring drought in the Kelantan River Basin, Malaysia. Water, 9 (1), 57. doi:10.3390/w9010057
- Tatsumi, K., Oizumi, T., and Yamashiki, Y., 2015. Effects of climate change on daily minimum and maximum temperatures and cloudiness in the Shikoku region: a statistical downscaling model approach. Theoretical and Applied Climatology, 120 (1), 87–98. doi:10.1007/s00704-014-1152-9
- Tebaldi, C. and Knutti, R., 2007. The use of the multi-model ensemble in probabilistic climate projections. Philosophical Transactions of the Royal Society a-Mathematical Physical and Engineering Sciences, 365 (1857), 2053–2075. doi:10.1098/rsta.2007.2076
- Telesca, L., et al., 2012. Investigation of scaling properties in monthly streamflow and Standardized Streamflow Index (SSI) time series in the Ebro basin (Spain). Physica A: Statistical Mechanics and Its Applications, 391 (4), 1662–1678. doi:10.1016/j.physa.2011.10.023
- Todd, M.C., et al., 2011. Uncertainty in climate change impacts on basin-scale freshwater resources - preface to the special issue: the QUEST-GSI methodology and synthesis of results. Hydrology and Earth System Sciences, 15 (3), 1035–1046. doi:10.5194/hess-15-1035-2011
- Trinh, T., et al., 2017. Assessment of 21st century drought conditions at Shasta Dam based on dynamically projected water supply conditions by a regional climate model coupled with a physically-based hydrology model. The Science of the Total Environment, 586, 197–205. doi:10.1016/j.scitotenv.2017.01.202
- Venkataraman, K., et al., 2016. 21st century drought outlook for major climate divisions of Texas based on CMIP5 multimodel ensemble: implications for water resource management. Journal of Hydrology, 534, 300–316. doi:10.1016/j.jhydrol.2016.01.001
- Vu, M.T., Raghavan, S.V., and Liong, S.-Y., 2016. Use of regional climate models for proxy data over transboundary regions. Journal of Hydrologic Engineering, 21 (6), 10. doi:10.1061/(ASCE)HE.1943-5584.0001342
- Vu, M.T., et al., 2015. Investigating drought over the central highland, Vietnam, using regional climate models. Journal of Hydrology, 526, 265–273. doi:10.1016/j.jhydrol.2014.11.006
- Wagner, P.D., et al., 2011. Hydrological modeling with SWAT in a monsoon-driven environment: experience from the western Ghats, India. Transactions of the ASABE, 54 (5), 1783–1790. doi:10.13031/2013.39846
- Yusof, F., et al., 2013. Characterisation of drought properties with bivariate copula analysis. Water Resources Management, 27 (12), 4183–4207. doi:10.1007/s11269-013-0402-4
- Zin, W.Z.W., Jemain, A.A., and Ibrahim, K., 2013. Analysis of drought condition and risk in Peninsular Malaysia using standardised precipitation index. Theoretical and Applied Climatology, 111 (3), 559–568. doi:10.1007/s00704-012-0682-2