
 ?Mathematical formulae have been encoded as MathML and are displayed in this HTML version using MathJax in order to improve their display. Uncheck the box to turn MathJax off. This feature requires Javascript. Click on a formula to zoom.
ABSTRACT
For efficient and targeted management, this study demonstrates a recently developed non-point source (NPS) pollution model for a year-long estimation in the Pingqiao River Basin (22.3 km2) in China. This simple but physically reasonable model estimates NPS export in terms of land use by reflecting spatial hydrological features and source runoff measurements under different land-use types. The NPS export was separately analysed by a distributed hydrological model, a spatial hydrograph-separation technique, and an empirical water quality sub-model. Simulation results suggest that 57 890 kg of total nitrogen (TN) and 1148 kg of total phosphorus (TP) were delivered. The results, validated with observed stream concentrations, show relative errors of 23.3% for TN and 47.4% for TP. Countermeasures for urban areas (5.3% of total area) were prioritized because of the high contribution rate to TN (14.1%) and TP (26.2%) which is caused by the high degree of runoff (8.5%) and pollution source.
Editor A. Castellarin Associate editor M. Hutchins
1 Introduction
Water pollution and water quality have become significant issues for China during its recent and rapid economic development. (Qu and Fan Citation2010, Sun et al. Citation2012, Zhou et al. Citation2017, Duan et al. Citation2018). With the effective control of point source pollution in recent decades, the contribution of non-point source (NPS) pollution has become a major cause of water quality degradation in China (Ongley Citation2004, Shen et al. Citation2014, Zhu et al. Citation2015).
As indicated, NPS pollution comes from many diffuse sources and is land-use driven (Boyd and Gardner Citation1990, Tsihrintzis and Hamid Citation1997, US EPA Citation2005a, Duan et al. Citation2016). Many studies have examined different land-use effects on NPS pollution export and stream quality and found that urban and agricultural NPS pollution were the leading sources of water quality deterioration (Omernik Citation1976, Wahl et al. Citation1997, Ometo et al. Citation2000, Sliva and Williams Citation2001, Brett et al. Citation2005, US EPA Citation2005b, Duan et al. Citation2013, Huang et al. Citation2013). In Lake Taihu, which is the third largest freshwater lake in China, high levels of NPS pollution from urban and agricultural areas have been previously highlighted (Guo et al. Citation2004, Qiao et al. Citation2012). Li and Yang (Citation2004) estimated that pollutants in Lake Taihu generated from agricultural NPS pollution accounted for 59% of the total nitrogen (TN) and 30% of total phosphorus (TP), while pollutants generated from domestic wastewater accounted for 25% and 60% of TN and TP, respectively. Clarifying and estimating the different land-use effects on NPS pollution in upstream areas is important and necessary for the improvement of water quality in Lake Taihu.
Many previous studies have attempted to develop NPS pollution models to quantitatively simulate and study these sources in order to effectively control and manage them (Zheng et al. Citation2014). NPS pollution models that have been proposed and applied over the past few decades in China are either empirical or physically-based models (Ongley et al. Citation2010, Shen et al. Citation2012). Empirical models are initially based on empirical relationships and robust algorithms, and many were developed under different conditions within our study area (Lek et al. Citation1999, Wang et al. Citation2011, Shen et al. Citation2012). The physically-based models require a large number of parameters and input data, which limits their application in China, particularly within our study area where available information is scarce (Ding et al. Citation2010, Zhang et al. Citation2010, Zheng et al. Citation2014). As a result, an NPS pollution model that can reflect the spatial physical and hydrological features of different land-use types, with a low demand for data, is considered suitable to quantitatively study the NPS pollution export in terms of land use in a data-scarce area.
Recently, an NPS pollution model that is based on a spatial hydrograph-separation approach, and uses a distributed hydrological model – the Rainfall-Runoff-Inundation (RRI) model – and the Time-Space Accounting Scheme (T-SAS), was proposed by Xue et al. (Citation2017). The output of the proposed NPS pollution model is a time series of NPS nutrient loads exported from different land-use types. This model has three main features: (a) it reflects the spatial distribution of physical and hydrological features of land use, and water quality measurements from source areas under different land uses; (b) it consists of an entirely physically-based hydrological model and a more empirically-based water quality sub-model, thus, it has a simpler calculation process and lower demand for data than distributed process-based NPS models; and (c) the calculation basis (i.e. source runoff concentration of NPS nutrient) is based on either field measurements or inverse estimation (Xue et al. Citation2017). As a result, this NPS pollution model is considered applicable and effective for studying the land-use-driven NPS pollution issues in our study area with limited data.
This NPS pollution modelling method was applied in a study of a storm event in the Pingqiao River Basin, China, using applicability-verified inversely estimated source runoff concentrations (Xue et al. Citation2017). In this previous study, we used the inverse estimation approach, based on multiple stream samples, because we had few source runoff concentration measurements for that specific storm event. As the number of field measurements of the source runoff has increased, long-term estimation is now possible.
In order to quantitatively study the long-term NPS pollution export of the upstream areas of the Taihu Basin, this study applies spatial hydrograph-separation for the NPS pollution modelling at the Pingqiao River Basin, which is a typical river basin upstream of Lake Taihu. This model reflects the spatial distribution of physical and hydrological features, and water quality measurements of source areas under differing land uses. This study produces a year-long simulation and estimates the NPS pollution export features in terms of land use, and proposes targeted countermeasures combining our simulation results with an understanding of local conditions.
2 Study area
Lake Taihu is the third-largest freshwater lake in China, with a surface area of 2338 km2 and a basin area of 36 895 km2 (TBA Citation2015). It is located in the Yangtze River Delta, in eastern China. Lake Taihu is characterized by its shallowness, with an average water depth of 1.9 m (Qin et al. Citation2007). The Taihu Basin is the most industrialized area in China, with high population density, high urbanization rate and rapid economic development (Wang and Wang Citation2014). Lake Taihu is the key water source for agriculture and industry in this region, and a major source of drinking water for the surrounding cities (e.g. Shanghai, Suzhou, Wuxi and Huzhou); it is also important for tourism, aquaculture and flood control (Wang et al. Citation2006, Qin et al. Citation2007). However, due to rapid social and economic development combined with a lack of effective management, Lake Taihu has been experiencing severe water quality deterioration and eutrophication problems over the past two decades (Wang et al. Citation2006, Zhang et al. Citation2010, Wang and Wang Citation2014).
The Tianmu Basin is located in the western hilly area of the Taihu Basin, which is the main runoff area for Lake Taihu (). The Tianmu Basin is also a popular tourist destination for leisure and vacations, with the lake view, fishing and tea-drinking experience. The Pingqiao River, flowing from south to north, is one of the three upstream rivers of Lake Tianmu. Our study area, the Pingqiao River Basin, covers an area of 22.3 km2, with an elevation ranging from 5 to 437 m a.s.l. It is a typical small-scale hilly basin, similar to others within the Taihu Basin, with landforms consisting of hills and plains. The upstream hills are forested, the lowland areas are mainly agricultural land and a town (urban area) is located downstream near the outlet of the basin, as shown in . The Pingqiao River Basin belongs to a subtropical, monsoonal climatic area, with abundant precipitation and sunshine, having four distinct seasons. The annual average temperature is 15.7°C and the average annual total precipitation is 1169.3 mm, with precipitation concentrated between April and September (Wu Citation2012).
Figure 1. Location information for the Taihu Basin and Tianmu sub-basin.
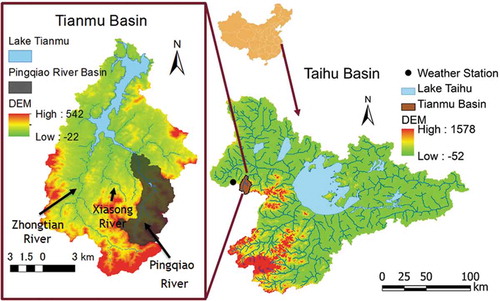
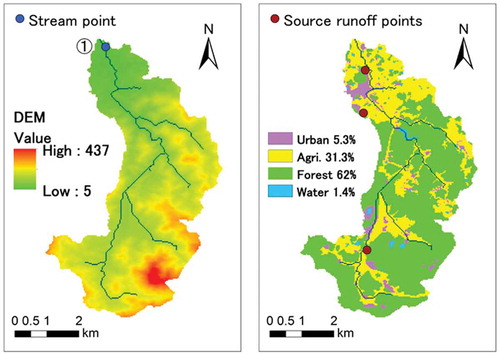
Figure 2. Topographical (DEM: digital elevation model) and land-use information of the Pingqiao River Basin.
The NPS pollution exported from the Pingqiao River Basin is closely linked to drinking water safety and the sustainable development of the Tianmu and Taihu basins. The primary industries of the Pingqiao River Basin are agriculture, tea production and tourism. While recent abatement of point source pollution has been effective, economic growth and the development of tourism, tea production, and livestock and poultry rearing has led to increasing production of NPS pollutants and their discharge into local rivers and lakes, resulting in water quality degradation in Lake Tianmu (He Citation2009). Gao et al. (Citation2009) indicated that the concentrations of TN and TP in 2006 were, respectively, 2.7 and 2.0 times the average level of 2001–2002. The excessive use of pesticides and chemical fertilizers, primitive livestock- and poultry-rearing practices, untreated domestic sewage and waste, increased development for tourism, and surface erosion and nutrient deposition by sediment were reported to be the main causes of NPS pollution in this area (He Citation2009, Wu Citation2012, Li Citation2013). We investigated the upstream areas of Lake Tianmu for NPS pollution sources and, consistent with the previous reports and studies, we found this area had poor drainage and sewage facilities, domestic waste was open and freely dumped on vacant land, poultry and small-scale livestock were commonly reared in the backyards of local households, and a considerable number of family-run hotels were managed by local residents.
shows the topographic and land-use information for the Pingqiao River Basin. Topographic data are based on ASTER (Advanced Spaceborne Thermal Emission and Reflection Radiometer) GDEM V2 (Global Digital Elevation Model Version 2), with a resolution of 30 m. For the one-year application, the DEM data were scaled up to a resolution of 3 arc-s (approx. 90 m) to save the computational time of the T-SAS approach. Land-use information was extracted from Google Earth® images (7 January 2015) and classified into four key types: urban (5.3%), agriculture (31.3%), forest (62%) and water bodies (1.4%). Soil type was uniformly assumed to be loamy sand, corresponding to previous research conducted in an adjacent river basin (Li Citation2013).
For the hydrological observations, daily precipitation and evaporation data were collected from 1 December 2014 20:00 to 30 November 2015 20:00, while discharge data were discontinuously collected 27 times between 27 May 2016 and 6 July 2016 for calibrating the RRI model discharge simulation. The observation station (no. 58345) for precipitation and evaporation is located at 31.26°N, 119.29°E. Located at a distance of 14.1 km from the Pingqiao River Basin, it is the nearest weather station to the study area. Discharge data were collected at stream point ① to represent the outlet, as shown in the left panel of .
3 Methods
3.1 Outline
This study uses a recently proposed spatial source hydrograph separation-based NPS pollution model (Xue et al. Citation2017) to simulate year-long NPS nutrient export under differing land-use types. This model considers that the NPS nutrient load in-stream is a mixture of the NPS nutrient loads from each land-use type:
where LZ is the separated NPS nutrient load of each land-use type (kg/d), Z represents the different land uses (e.g. A: urban, B: agriculture, C: forest, …) and LST is the stream NPS nutrient load (kg/d).
The simulated NPS nutrient load exported from each land-use type is the product of the separated discharge and source runoff concentration from each land-use type:
where QZ is the separated discharge (m3/s), CZ is the source runoff concentration for a specified land use (mg/L), Δt is the time interval (60s in the T-SAS computation), n is the number of time steps of one day (1440), and k is a unit conversion factor (0.001).
The resultant in-stream NPS nutrient concentration is calculated as the summation of the products of the discharge contribution rate and the source runoff concentration from each land-use type (Xue et al. Citation2017):
where fZ is the contribution rate of flow discharge originating from a specified land use (A, B, …, Z) and CST is the stream concentration (mg/L).
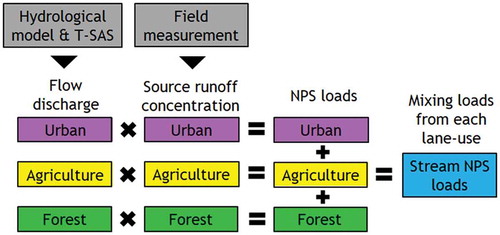
The flow discharge contribution rates (fZ) and separated discharge (QZ) of each land-use type are estimated from the spatial hydrograph separation approach using the RRI model and the T-SAS. The source runoff concentrations (CZ) can be estimated by field measurement at representative source points. illustrates the model mechanism and process. Our simulation period is from 1 December 2014 20:00 to 30 November 2015 20:00.
Figure 3. Schematic diagram of NPS pollution model mechanism and process.
3.2 Rainfall-Runoff-Inundation (RRI) model
The RRI model is a two-dimensional (2D) grid, cell-based hydrological model to simulate both rainfall–runoff and flood inundation processes (Sayama et al. Citation2012). This model has three main features, as follows:
calculation of flow, based on a 2D diffusive wave approximation, for hill slopes and floodplains;
simulation of lateral subsurface and surface flows – in terms of the discharge–hydraulic gradient relationship in mountainous areas, along with the vertical infiltration based on Green-Ampt modelling in floodplains – to produce better representations of the rainfall–runoff processes that take place under different land-use conditions; and
separate consideration of slopes and river channels: channel flow is computed using the built-in 1D diffusive wave model, while the slope flow is calculated using a 2D diffusive wave model; the flow interaction between the river channel and slope is also estimated based on different water level and levee height conditions (Sayama Citation2011, Sayama et al. Citation2012).
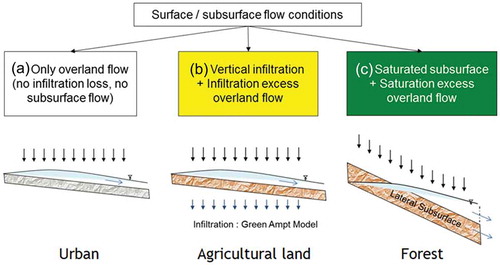
In this study, we used the RRI model as the distributed hydrological model to implement the runoff simulation, but not to implement the inundation simulation. This study area contains three typical land-use types: urban, agriculture and forest. In the RRI model parameter settings, we considered only overland flow (no infiltration loss or subsurface flow) in the urban areas, vertical infiltration and infiltration-excess overland flow in the agricultural areas, and saturated subsurface flow and saturation-excess overland flow (but no unsaturated subsurface flow) in areas of forest (Sayama et al. Citation2012, Citation2015, Xue et al. Citation2017). The set-up is shown in .
Figure 4. Schematic diagram of surface/subsurface flow conditions of the RRI model (Sayama Citation2011).
3.3 Time-Space Accounting Scheme (T-SAS)
The T-SAS is a matrix-based time-space accounting scheme that tracks the ratio of flow contributed by rainwater originating from certain temporal classes and spatial zones. One of the objectives of the T-SAS is to analyse the discharge (computed by the RRI model) resulting from rainwater in terms of time and location, i.e. T-SAS separates the hydrograph in terms of different temporal classes and spatial zones of rainwater sources (Sayama and McDonnell Citation2009).
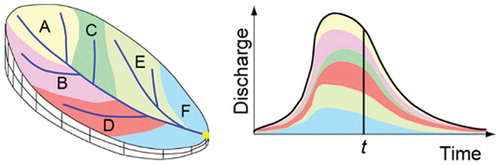
In this study, we used T-SAS for the spatial-source hydrograph separation, in terms of differing land-use types. illustrates the schematic diagram of the separation of the spatial hydrograph components. For the spatial-source hydrograph separation, we can divide the basin into several spatial zones (e.g. in terms of land use). In this example we divided it into six spatial zones from A to F. The colours of the basin correspond to the colours in the hydrograph, illustrating, at any time t, how much of the discharge at the outlet of the basin results from rainwater from the corresponding zones (Sayama and McDonnell Citation2009).
Figure 5. Schematic diagram of the hydrograph separation by spatial sources of rainwater. Source: Sayama and McDonnell (Citation2009). See text for explanation.
In order to achieve the objective above, separating storage water in each element of the distributed hydrological model based on spatial source is considered. Each element of the distributed hydrological model is a single block within which storage water is considered as one state variable. In the RRI model, one slope grid cell or river grid cell is applicable as an element. For storage separation, it is assumed that water mixing between elements only occurs through moving. Based on this assumption, storage water is separated by updating computation of all the elements using the following mass balance equation:
where vi is the separated storage water in element i. In order to receive all sources of storage, vectors used for vi have the same dimensions of the number of sources (e.g. number of land uses). In Equation (4), Vi is the total storage water in element i, it is the summation of each source of vi; qji is the inflow from element j to element i; qik is the outflow from element i to element k; ri is the precipitation with source information given (e.g. land-use information); ei is the loss from element i of the system by evapotranspiration or infiltration; and t is time (Sayama and McDonnell Citation2009, Sayama et al. Citation2013).
In Equation (4), the unknowns are vi and vj. By using the runoff model, which sequentially tracks from upstream to downstream, the calculation order of the mass balance equation is from upstream to downstream and therefore vj becomes known. That means Equation (4) becomes an ordinary differential equation with one variable, and can be analytically solved by proceeding with computation from upstream to downstream. Based on the separated storage water in each element, the runoff discharge hydrograph can be separated by multiplying the contribution rate of each source (f, which is solved by each source of vi) and the runoff discharge at the targeted element (Sayama and McDonnell Citation2009, Sayama et al. Citation2013). In this study, the spatial source was considered as land-use information and the vectors of vi have three dimensions (viA, viB, viC) to represent separated storage water in terms of rainwater sources from different land-use types (A: urban, B: agriculture and C: forest). The runoff discharge hydrograph at element i is separated by:
where Qz is the separated discharge (m3/s), and Q is the total discharge (m3/s).
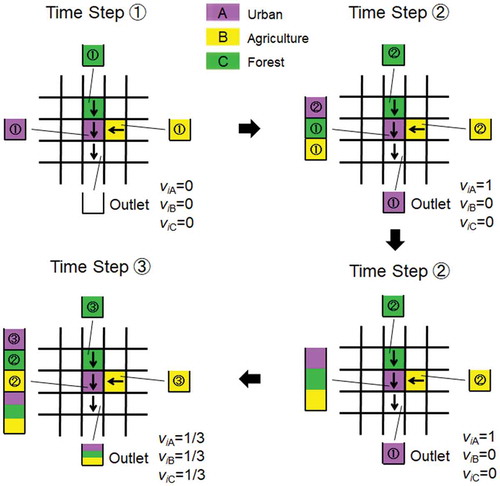
provides a schematic diagram of storage water separation in the RRI model and the T-SAS calculation. A simplified example with four grid cells (urban, agriculture, forest and outlet) is used to provide a simple and clear introduction. The arrows indicate the flow directions of each gird. Precipitation occurred only in the urban, agriculture and forest grids. We assumed that within one time step, every grid receives 1 m3 of precipitation and generates 1 m3 of outflow without loss during moving. At time step ①, the urban, agriculture and forest grids received precipitation as storage water, with precipitation assigned (by a colour) by the spatial sources (land-use information) of their own grid; the outlet grid received no outflow from the upstream urban grid. At time step ②, the outlet grid received 1 m3 of outflow generated by the urban grid in time step ① (viA = 1, viB = 0, viC = 0); the urban grid received the outflow generated from the agriculture and forest grids in time step ① and precipitation from its own area in time step ②; the agriculture and forest grids received precipitation from time step ②. It was assumed that the storage water in the urban grid was mixed through moving. Therefore, at time step ③, the outlet grid received 1 m3 of the mixed storage water from the urban grid with the storage water separation solved (viA = 1/3, viB = 1/3, viC = 1/3). The computation time step of the T-SAS is 60s and the land-use grid size is 3 arc-s (approx. 90 m).
Figure 6. Schematic diagram of storage water separation by the RRI model and the T-SAS.
3.4 NPS pollution estimation in stream
The in-stream NPS nutrient load is a mixture of the NPS nutrient loads from each land-use type (Equation (1)), and the simulated NPS nutrient load exported from each land-use type is the product of the separated discharge and source runoff concentration of each land-use type (Equation (2)). Note that in the long-term simulation, the NPS nutrient load was daily-averaged to simplify the computation process.
In the event study (Xue et al. Citation2017), we assumed that the source runoff concentration did not vary temporally and was mixed conservatively (as the biochemical reactions can be treated as negligible due to the comparatively short travel time in the streams). However, in the long-term simulation, source runoff concentration changes could not be neglected. As a result, we conducted weekly measurements to reflect changes in source runoff concentrations, and we assumed that source runoff concentrations did not vary within a one-week period.
Previous studies showed correlations between precipitation intensities and concentrations of NPS nutrient export (Liu et al. Citation2014, Ding et al. Citation2017). Because we took source runoff samples on a weekly basis, the previous or succeeding measurement that was the closest in time may be under different precipitation conditions for the estimating day, causing estimation errors of source runoff concentrations. In order to obtain a reasonable estimate, particularly during rainfall events, we separated the source runoff concentration measurements into four classes based upon the intensity of precipitation that occurred on the day of measurement (Pd). The separated daily precipitation classes are: Class 1, Pd < 10 mm; Class 2, 10 mm ≤ Pd < 25 mm; Class 3, 25 mm ≤ Pd < 50 mm; Class 4, 50 mm ≤ Pd; these indicate baseflow, moderate precipitation, heavy precipitation and extreme heavy precipitation, respectively. The measured source runoff concentrations respond to the calculations of the nearest days with corresponding precipitation intensities (classes). To calculate the stream NPS nutrient load and concentration on a specified day, we checked daily precipitation and determined which class it fell into. Then, we searched for the previously measured source runoff concentration for the nearest day that fell into the same precipitation class. This source runoff concentration is determined for the calculation shown in Equations (2) and (3). After repeating this procedure, the time series of the stream NPS nutrient concentrations are calculated.
3.5 Water quality measurements
For this study we measured water quality at one stream point (see (left)) and three typical source runoff points ( (right)) for a whole year. The stream point ①, which represents the water quality of the outlet, was sampled on a weekly basis from 25 November 2014 to 27 November 2015, and the three source runoff points were sampled on a weekly basis from 30 December 2014 to 27 November 2015 for the urban and agriculture source runoff points, and on a monthly basis over the same time period for the forest source runoff point.
Field measurements can be used to estimate the source runoff concentration, which is defined as the average NPS nutrient concentration of runoff originating from each grid of the same land-use type (Xue et al. Citation2017). For this study, we identified three typical streams (tributaries), whose upstream areas are dominated by a specified single land use, as source runoff streams. Accessibility is another factor in selecting the source runoff streams. The selected source runoff streams are a ditch near a local residence, a drainage channel near agricultural land, and the topmost upstream stream that is almost entirely surrounded by forest. We assumed that samples from the three source runoff streams reflect the average source runoff concentrations form urban, agricultural and forest zones, respectively (Xue et al. Citation2017). We took water samples from each source runoff stream and determined water quality using a potassium persulfate digestion UV spectrophotometric method (HJ 636–2012) for TN and an ammonium molybdate spectrophotometric method (GB 11893–89) for TP.
4 Results and discussion
4.1 RRI model calibration
Calibration of the simulated and observed stream discharge at Point ① for the RRI model was conducted during the calibration period (27 May 2016–6 July 2016) by Xue et al. (Citation2017), with results confirmed to show similar ranges of variation for the simulated and observed discharges.
4.2 Hydrograph separation by the T-SAS
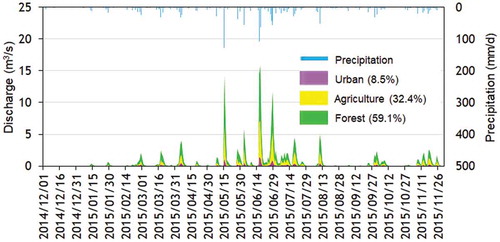
illustrates the hydrograph-separation results by the T-SAS applied to Point ①, the basin outlet (), from 1 December 2014 20:00 to 30 November 2015 20:00. In the long-term simulation, overall evaporation was considered. We merged the results obtained from water bodies into those from agriculture because the former covers only 1.4% of the study area and the majority of ponds are located within agricultural areas. As shown in , the hydrograph was separated into three sections corresponding to contributions from the different land-use types. The runoff contribution from urban, agriculture and forest accounted for approx. 8.5, 32.4 and 59.1% of the total runoff, respectively. However, this study did not conduct a detailed verification of hydrograph separation results because of the lack of further observational information. Tracer hydrology studies have recently improved owing to the use of isotope or chemical solute analysis in hydrograph separation (Iwasaki et al. Citation2015), and it considered that a further comparison study with tracer hydrology is possible to verify and improve our model.
Figure 7. Hydrograph-separation results at Point ①, using the T-SAS.
4.3 Source runoff concentration observations
presents the source runoff concentration changes within the selected year, as determined by weekly measurements (or monthly measurements in the case of forest source runoff).
Figure 8. Observed source runoff concentrations for the different land-use types studied.
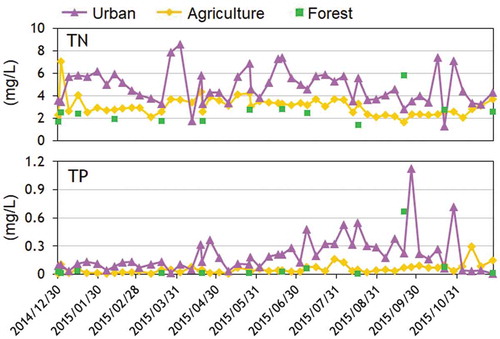
The runoff concentration levels are different for the three land-use types, indicating different levels of contribution to NPS pollution. The urban area contributes the most to TN levels, with an average concentration of 4.81 mg/L. In contrast, agricultural areas and forest areas have average TN concentrations of 3.08 and 2.51 mg/L, respectively. Average source runoff contributions to TP from urban, agricultural and forest areas are 0.207, 0.056 and 0.083 mg/L, respectively. Generally, the runoff generated from the urban area had the highest NPS nutrient concentration, which is considered to be the result of domestic sewage and waste. Agricultural land is expected to have a high NPS nutrient concentration due to pesticide and chemical fertilizer use.
Another finding is that each source runoff concentration fluctuates differently. The source runoff concentration fluctuations of urban areas have the largest degree of dispersion; on the other hand, those of agricultural and forest areas perform more smoothly. Human activities in urban areas are considered more complex than in the other two land-use types, which was well reflected in our measurements. In particular, the seasonality of urban TP measurements showed strong relevance to the tourism activities in the Tianmu Basin. The tourist high season for Lake Tianmu area is early spring for the tea festival, middle summer as a summer resort, and autumn because of concentrated national holidays (National Day golden week) and traditional holidays (Fu Citation2011), resulting in a seasonal increase in urban TP concentration. For TN, the standard deviations of urban, agricultural and forest areas are 1.53, 0.85 and 1.10 mg/L, respectively, while for TP, they are 0.197, 0.049 and 0.186 mg/L, respectively. Obviously, urban areas have the largest standard deviations for both TN and TP, indicating a larger amount of variation from the mean.
4.4 Stream NPS nutrient concentration simulation
Based on flow discharge contribution rates (estimated by the RRI model and the T-SAS) and source runoff concentrations of each land-use type (measured in the field), the time series of the stream NPS nutrient concentrations for the selected year were calculated and plotted, as shown in .
Figure 9. Stream NPS nutrient concentration simulation and validation.
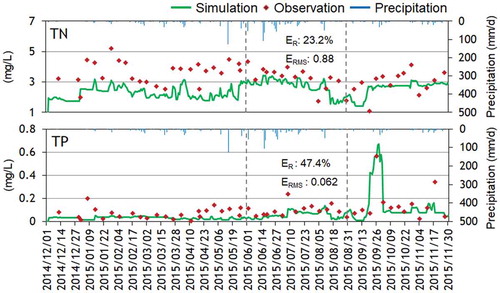
Validation with observed stream concentrations gave a root mean squared error (ERMS) and relative error (ER) for TN of 1.17 mg/L and 30.9%, respectively, and for TP of 0.085 mg/L and 64.5%, respectively. When focusing on summer (June, July and August; within the dashed vertical lines in ), the simulation results compare better to the observations, with ERMS and ER for TN of 0.88 mg/L and 23.2%, respectively, and for TP of 0.062 mg/L and 47.4%, respectively. This is because we applied the source runoff concentrations to the nearest days with corresponding precipitation intensities, which improved the accuracy of the simulation results, particularly during rainfall events. This consequently improved the accuracy of the simulation results for precipitation concentrated in the summer months. Since more than 50% of the NPS nutrients are estimated to have been delivered during summer (see Section 4.5), the performance of the simulation during summer has a significant effect on the overall simulation results and reliability.
In the distributed hydrological model application, we lack validation of separated surface runoff of different land-use types, causing errors in the calculation of NPS pollution loads. In the water quality sub-model, we conducted measurements at three typical source points to represent the average NPS nutrient concentration of source runoff from each land-use type. This resulted in considerable errors because measurement of one source point with a relatively long observation interval (weekly) is a simplified approach that cannot reflect the real situation of the whole area, particularly for a large-scale basin. Increasing the observation points and frequency is expected to improve this situation, but the increases in required resources and labour must be taken into account in terms of feasibility. In contrast with a process-based NPS pollution model, our model adopts a more empirical approach to NPS nutrient calculation without considering biochemical reactions during migration and transformation processes in streams. Particularly for TN, the complex processes of volatilization, nitrification, denitrification, amination, adsorption, desorption and deposition in streams were neglected, resulting in corresponding errors. Our simulation results may be comprehensively affected by the probable errors of estimated flow discharge contribution rate, insufficient measurements of source points and sample numbers, and neglecting in-stream biochemical reactions, so that complex mismatches with observations occur (e.g. underestimation of spring TN). However, for our simple and empirical water quality model, we consider the validation results indicate reasonable agreement with the observations.
4.5 NPS nutrient load simulation
Using the time series of discharges and source runoff concentrations for each land-use type, the time series of spatially separated NPS nutrient loads were simulated, as shown in .
Figure 10. Long-term simulation of the NPS nutrient loads.
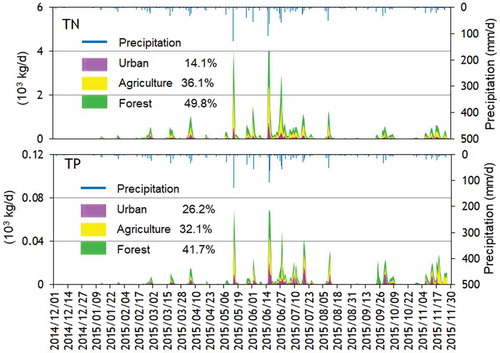
During the one-year simulation (1 December 2014–30 November 2015), a total of 57 890 kg of TN and 1148 kg of TP were delivered into LakeTianmu. Since NPS nutrient export is closely related to the runoff process, NPS nutrient load patterns change in a manner similar to how precipitation changes. When compared with the limited previous studies in this area and adjacent river basins, our simulation results show a similar range of NPS nutrient estimations and validation performance for TN, but larger differences in TP. Simulations in the Pingqiao River Basin using the AnnAGNPS model suggested 52 411 kg of TN export and 2163 kg of TP export in 2015 (Yang Citation2017). This study estimated 88.4% greater TP export than our simulation. The ER of TN and TP export were estimated to be 39.6% and 22.3%, respectively (Yang Citation2017). Another simulation in the adjacent Zhongtian River Basin (47.8 km2) using the HSPF model from 2005 to 2010 produced ER of 29.2% and 30.4% for TN and TP, respectively (Li Citation2013). Both the AnnAGNPS model and the HSPF model showed better validation results of TP than our empirically-based water quality sub-model. This may be attributed to the probable errors due to the hydrograph separation results and insufficient source runoff concentration measurements, reflecting the limitations of our semi-empirical model when compared with process-based water quality models. However, the two process-based models still indicated considerable errors with observations because this area lacks parameters and data for model calibration, causing larger errors as simulation processes accumulate. One of the most important reasons for accumulated errors is sediment validation with ER of 40.09% (Li Citation2013). Although improvement is necessary, our model showed a simpler calculation process and lower demands on data than the process-based NPS pollution models.
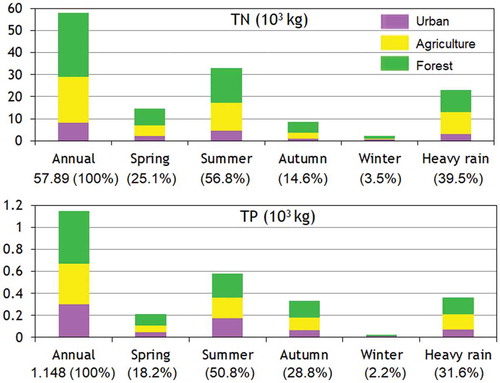
summarizes the NPS nutrient loads and the spatial and temporal contributions. Summer and spring contributed 56.8 and 25.1% of annual TN loads, respectively, and summer and autumn contributed 50.8 and 28.8% of annual TP loads, respectively. Summer produced the highest NPS nutrient contributions, and this is directly attributable to the concentrated rainfall events that occurred in the summer. The Taihu Basin has three distinct rainy seasons: Spring rain (March–May), Plum rain (June and July) and Typhoon rain (August–October) (TBA Citation2014). In the selected year, seasonal runoff was found to be: summer (55.2%) > spring (26.1%) > autumn (15.0%) > winter (3.7%). Our simulation results show substantial agreement with this trend. Also, concentrated farming activities during spring and summer lead to a large amount of chemical fertilizer use. The overused fertilizers, particularly highly soluble nitrogen fertilizers, were dissolved and discharged into the water bodies, causing a large TN export during this period. Additionally, we selected 13 days that experienced daily precipitation of more than 25 mm and summarized their TN and TP contributions. These 13 heavy rainfall days contributed 39.5 and 31.6% of the annual loads of TN and TP, respectively, indicating very concentrated NPS pollution export during heavy rainfall events.
Figure 11. Summary of the temporal and spatial contributions of the NPS nutrients.
4.6 Targeted countermeasure proposal and discussions
The main NPS pollution sources in this area are reported to be: (a) excessive use of pesticides and chemical fertilizers; (b) primitive livestock and poultry rearing; (c) untreated domestic sewage and waste; (d) increased tourism development; and (e) surface erosion and nutrients delivered with sediments (He Citation2009, Wu Citation2012, Li Citation2013). As NPS pollution comes from many diffuse land-use-driven sources, this section aims to conduct a targeted analysis and discussion in terms of land use on NPS pollution export and improvement countermeasures, by combining our simulation results with an understanding of local conditions. Simulation results separated by land use are summarized in .
Table 1. Summary of simulation results separated by land use.
4.6.1 Urban area
Urban areas account for 5.3% of the total study area, but contributed 14.1 and 26.2% of annual TN and TP loads, respectively. Urban areas contributed the highest level of NPS pollution when considered per unit area. The annual urban TN export coefficient is 69.23 kg/ha, which is higher than the agricultural and forest annual TN export coefficients (28.68 and 20.88 kg/ha, respectively). The annual urban TP export coefficient is 2.54 kg/ha, which is higher than the agricultural and forest annual TP export coefficients (0.51 and 0.35 kg/ha, respectively). This indicates that urban areas are the most important sources of NPS nutrient loads. This is because the urban areas increase the contribution of storm runoff and generate the highest level of NPS pollutants (source runoff concentration), as shown in .
In this year-long simulation, urban areas (5.3% of the total area) contributed 8.5% of total surface runoff. The urban runoff coefficient was estimated to be 0.94, which is clearly higher than the agricultural and forest runoff coefficients of 0.58 and 0.56, respectively. The large amount of urban surface runoff generation is attributable to the large amount of impervious areas, which lead to less evaporation and infiltration, more surface runoff and higher flow velocity. The hydrological features of urban areas were well reflected by parameter settings of flow conditions in the RRI model. However, estimated urban runoff was not verified because we lacked detailed observational information. Future work will focus on this issue to improve the performance and applicability of our model.
Another reason for the high NPS pollution contribution of the urban areas is the high level of NPS pollutant generation. The urban source runoff has the highest average level and standard deviation of TN and TP concentrations, compared with the other land-use types (). According to our field investigation, this is attributable to untreated domestic sewage, freely dumped domestic waste, phosphorus-containing detergent use and domestic poultry rearing.
This area has poor drainage and sewage facilities. The most commonly used domestic sewage systems are poorly equipped septic tanks. Residents use them to produce manure; however, they may inadvertently flush out wastewater through surface runoff. Additionally, open and freely dumped domestic waste is commonly found on vacant land, such as river banks. Untreated domestic sewage and freely dumped domestic waste are considered to be important causes of this concentrated NPS nutrient export.
Another cause of this high contribution rate of TP found in urban areas is speculated to be the use of phosphorus-containing detergents. Washing activities that take place on the riverbank are also common and, if phosphorus-containing detergents are used, this will cause a large amount of phosphorus to be exported into water bodies. Although the Taihu Basin has started to implement the prohibition of phosphorus-containing detergent use, Chen and Hua (Citation2004) indicated that phosphorus-containing detergent use is one of the key causes of NPS pollution in the Taihu Basin. According to previous investigations, the contribution rate of detergent-phosphorus to TP load was about 16.1% in the Taihu Basin (Huang et al. Citation2000a) and 17.6% in the Yili River sub-basin of the Taihu Basin (Huang et al. Citation2000b).
Untreated livestock and poultry faeces are another important NPS pollution source. Poultry and small-scale livestock are commonly reared in the backyards of local households. Liu et al. (Citation2010) found that livestock and poultry rearing contributed the most (34 and 58% of TN and TP, respectively) to the total NPS pollution load in the Taihu Basin. This result reflects large-scale livestock and poultry rearing that existed only rarely within our study area; however, the contribution of small- and medium-scale rearing cannot be neglected, with livestock and poultry feces left untreated and discharged directly into the river.
As a result, the improvement of drainage systems and sewage treatment in urban areas should be the main priority, especially when considering future population growth. Freely dumped domestic waste and phosphorus-containing detergent use should be forbidden, particularly in areas near streams and rivers. It is therefore recommended to simultaneously conduct mandatory management and education.
Livestock and poultry rearing in this area is common and decentralized, making effective control and management difficult. The basic countermeasure is to divide the area and implement locally-appropriate small-scale management. Cultivation in areas near streams and rivers is strictly limited and controlled, but other areas are managed with looser policies. From a technical perspective, composting and the construction of biogas digesters can offer an efficient and beneficial way to reuse faeces.
With the future tourism development in Lake Tianmu Basin, the NPS pollution from urban areas is expected to worsen without effective treatment and management. Although high-end hotels and resorts are concentrated in the areas around Lake Tianmu, local residents, in the upstream areas, manage a considerable number of family-run hotels for additional income. Without effective management, increasing numbers of these family hotels may increase the volume of untreated domestic wastewater and sewage being discharged into rivers. Therefore, countermeasures should be focused on sewage and domestic waste treatment and management.
4.6.2 Agricultural area
Agricultural land accounts for 32.7% of the total area and contributed 36.1 and 32.1% of annual TN and TP loads, respectively. The Taihu Basin is one of three major food production areas in China, with intensive agriculture and chemical fertilizer application (Qiao et al. Citation2012). Field experiments by Wang et al. (Citation2004) showed that the optimal nitrogen application rate was 225–270 kg/ha for rice in the Yangtse Delta Region, in which the Taihu Basin in located. Zhang et al. (Citation2007) showed that the average nitrogen fertilizer application rate was 193 kg/ha for rice in China. However, the nitrogen chemical fertilizer use across the adjacent Zhongtian River Basin was 410 kg/ha, on average, with more than 70% of farmers using in excess of 360 kg/ha and 24% of them using more than 1000 kg/ha (Wu Citation2012). A two-year experiment in the Taihu Basin by Qiao et al. (Citation2012) showed no significant differences in grain yield under nitrogen fertilizer application rates of 135–270 kg/ha. Ju et al. (Citation2009) showed that a 30–60% reduction in current nitrogen application rates can lead to the more efficient use of nitrogen fertilizer. It is estimated that approximately 35–45% (at least 30%) of nitrogen fertilizer use in this area was excessive.
If the countermeasure of reducing current nitrogen fertilizer use by approx. 30% is achieved, estimates show that this year’s TN loads could be reduced by 6264 kg. Besides the reduction in fertilizer use, interception and absorption of lost nutrients would provide another effective countermeasure. Previous attempts to achieve this (Yi et al. Citation2008, Li et al. Citation2012), consisting of building ecological ridges (isolation belts), the construction of wetlands and the restoration of natural river banks, have proven to be effective techniques for water purification.
4.6.3 Forest area
Forest accounts for 62% of the total area and contributed 49.8 and 41.8% of annual TN and TP loads, respectively. The annual TN and TP export coefficients of forest are 20.88 and 0.35 kg/ha, respectively. The forest annual TN export coefficient is clearly higher than some NPS pollution study results from the USA, where ranges of 1.38–6.26 kg/ha for TN and 0.019–0.830 kg/ha for TP have been recorded (Lin Citation2004).
One of the most important reasons for these high coefficients is the increasing extent of tea plantations in the forest area. Tea plantations are the main industry in this area, and the most important development type in hilly (forest) areas. Analysis in the Tianmu Basin by Diao et al. (Citation2013) showed a rapid growth trend for tea plantations in the past years. From 2000 to 2011, tea plantation areas in the Tainmu Basin have expanded by five times, more than half of which has occurred in the last three years alone (i.e. 2009 to 2011; Diao et al. Citation2013). Tea plantations have contributed significantly to NPS nutrient pollution, as they are usually planted on hill slopes (contributing more sediment influx than in plains), with levels of nitrogen fertilizer use as high as 489.6 kg/ha (Wu Citation2012). According to studies by Nie et al. (Citation2013), the TN concentrations of surface runoff from tea plantation area, secondary pine forest and bamboo forest were 11.25, 2.83 and 3.60 mg/L, respectively, indicating the highest contribution to NPS nutrient export to be from tea plantations. Currently, investigations and research into the NPS nutrient contributions by tea plantations within the Pingqiao River Basin are still being processed. By combining these results, it is expected that our study will be refined in the future.
Also, in some areas, severe deforestation and environmental damage are obvious. This may result in sediments being flushed out and combined with nutrients produced by surface erosion, and may cause an NPS nutrient burden in downstream areas. As a result, we strongly suggest that tea plantations and other farming activities are prohibited on bare land and steep slopes, which should be afforested.
5 Conclusions
This study applied a hydrograph-separation-based NPS pollution model at the Pingqiao River Basin in China to estimate the NPS nutrients exported from different land-use types and proposed targeted countermeasures. This model uses the flow discharge in terms of land use separated by a spatial hydrograph-separation approach (a distributed hydrological model and the T-SAS) and NPS source runoff concentrations measured from different land-use types to simulate the NPS nutrient loads of each land use separately. This model was revealed to be both applicable and efficient for the analysis of NPS pollution, particularly in data-scarce areas.
The year-long simulation results show that 57 890 and 1148 kg of TN and TP, respectively, were delivered to Lake Tianmu from the Pingqiao River Basin. The simulated stream NPS concentrations showed reasonable agreement with observations, particularly in the summer (with high precipitation concentration) (ERMS and ER of 0.88 mg/L and 23.2%, respectively, for TN and 0.062 mg/L and 47.4%, respectively, for TP). Our results successfully reflect the effects of runoff and farming activities on the seasonal NPS nutrient export characteristics, with 56.8 and 25.1% of TN contributed during the summer and spring, respectively, and 50.8 and 28.8% of TP contributed during the summer and autumn, respectively.
For the proposed targeted countermeasures, we gave first priority to improvements in the drainage system and sewage treatment in urban areas (5.3% of total area) because of the high degree of contribution to TN (14.1%) and TP (26.2%). For agricultural areas, a 30% reduction in the current nitrogen chemical fertilizer use is considered reasonable and this could reduce TN export by an estimated 6264 kg in the selected year. Our simulation results showed relatively high TN contribution by forest areas (annual export coefficient of TN: 20.88 kg/ha), therefore, limiting tea plantations and other farming activities, and promoting afforestation on steeply sloped areas, are necessary and urgent measures.
The current study lacks a detailed validation of the hydrograph-separation results, and more detailed land-use classification and corresponding studies, are among other sources of uncertainty. A further study is therefore recommended, using more detailed field observation data.
Disclosure statement
No potential conflict of interest was reported by the authors.
Additional information
Funding
References
- Boyd, G. and Gardner, N., 1990. Urban stormwater: an overview for municipalities. Public Works, 121, 39–42.
- Brett, M.T., et al., 2005. Non-point-source impacts on stream nutrient concentrations along a forest to urban gradient. Environmental Management, 35 (3), 330–342. doi:10.1007/s00267-003-0311-z.
- Chen, H.S. and Hua, Y.Q., 2004. Non-point source pollution control and governance in Taihu Basin. Water Resources Protection, (01), 33–36. [in Chinese]. doi:10.3969/j.issn.1004-6933.2004.01.016.
- Diao, Y.Q., Han, Y., and Li, Z.F., 2013. Spatio-temporal change of tea plantation since 2000 and model-based prediction in the Tianmuhu Reservoir watershed. Journal of Lake Sciences, 25 (6), 799–808. [in Chinese]. doi:10.18307/2013.0603.
- Ding, X.W., et al., 2010. Development and test of the export coefficient model in the Upper Reach of the Yangtze River. Journal of Hydrology, 383 (3–4), 233–244. doi:10.1016/j.jhydrol.2009.12.039.
- Ding, X.W., et al., 2017. Influence mechanisms of rainfall and terrain characteristics on total nitrogen losses from Regosol. Water, 9 (3), 167. doi:10.3390/w9030167.
- Duan, W.L., et al., 2013. Spatial and temporal trends in estimates of nutrient and suspended sediment loads in the Ishikari River, Japan, 1985 to 2010. Science of the Total Environment, 461, 499–508. doi:10.1016/j.scitotenv.2013.05.022
- Duan, W.L., et al., 2016. Water quality assessment and pollution source identification of the eastern Poyang Lake Basin using multivariate statistical methods. Sustainability, 8 (2), 133. doi:10.3390/su8020133.
- Duan, W.L., et al., 2018. Identification of long-term trends and seasonality in high-frequency water quality data from the Yangtze River basin, China. PloS One, 13 (2), e0188889. doi:10.1371/journal.pone.0188889.
- Fu, Y.Y., 2011. Study on lake tourism transformation and upgrading of China: case of Tianmu Lake Resort. Thesis (Master). Fudan University. [in Chinese with English abstract].
- Gao, Y.X., et al., 2009. Variation of water quality and trophic state of Lake Tianmu, China. Environmental Science, 3, 673–679. [in Chinese with English abstract]. doi:10.3321/j.issn:0250-3301.2009.03.009.
- Guo, H.Y., Wang, X.R., and Zhu, J.G., 2004. Quantification and index of non-point source pollution in Taihu Lake region with GIS. Environmental Geochemistry and Health, 26, 147–156. doi:10.1023/B:EGAH.0000039577.67508.76
- He, R.R., 2009. Study on occurrence mechanism of eutrophication in Tianmu Lake. Thesis (Master). Nanjing Agriculture University. [in Chinese with English abstract].
- Huang, J.L., et al., 2013. Watershed-scale evaluation for land-based nonpoint source nutrients management in the Bohai Sea Bay, China. Ocean & Coastal Management, 71, 314–325. doi:10.1016/j.ocecoaman.2012.10.018
- Huang, W.Y., Shu, J.H., and Gao, X.Y., 2000a. Study on contribution of phosphorus in detergents to Lake Taihu. Guizhou Environmental Protection Science and Technology, 6 (3), 29–32. [in Chinese].
- Huang, W.Y., Shu, J.H., and Xu, P.Z., 2000b. The contribution of phosphorus in detergents from the catchment of Yili to Lake Tai. Transactions of Oceanology and Limnology, 4, 20–25. [in Chinese with English abstract].
- Iwasaki, K., Katsuyama, M., and Tani, M., 2015. Contributions of bedrock groundwater to the upscaling of storm-runoff generation processes in weathered granitic head water catchments. Hydrological Processes, 29 (6), 1535–1548. doi:10.1002/hyp.v29.6.
- Ju, X.T., et al., 2009. Reducing environmental risk by improving N management in intensive Chinese agricultural systems. Proceedings of the National Academy of Sciences of the United States of America, 106 (9), 3041–3046. doi:10.1073/pnas.0813417106.
- Lek, S., Guiresse, M., and Giraudel, J.L., 1999. Predicting stream nitrogen concentration from watershed features using neural networks. Water Research, 33 (16), 3469–3478. doi:10.1016/S0043-1354(99)00061-5.
- Li, Y., 2013. Study on hydrology and water quality process simulation based on HSPF model: a case study in Zhongtian River watershed. Thesis (Master). Nanjing Agriculture University. [in Chinese with English abstract].
- Li, Z.F., Liu, H.Y., and Li, H.P., 2012. Impact on nitrogen and phosphorous export of wetlands in tianmu lake watershed. Environmental Science, 33 (11), 3753–3759. [ in Chinese with English abstract].
- Li, Z.F. and Yang, G.S., 2004. Research on non-point source pollution in Taihu Lake Region. Journal of Lake Sciences, 16 Suppl., 83–88. [in Chinese with English abstract].
- Lin, J.P., 2004. Review of published export coefficient and event mean concentration (EMC) Data. ERDC TN-WRAP-04-03. Vicksburg, MS: US Army Corps of Engineers, Engineer Research and Development Center.
- Liu, R.M., et al., 2014. Runoff characteristics and nutrient loss mechanism from plain farmland under simulated rainfall conditions. Science of the Total Environment, 468–469, 1069–1077. doi:10.1016/j.scitotenv.2013.09.035
- Liu, Z., et al., 2010. Estimation of non-point source pollution load in Taihu Lake Basin. Journal of Ecology and Rural Environment, 26, 45–48. [in Chinese with English abstract].
- Nie, X.F., et al., 2013. Characteristics of nitrogen loss from typical land-uses in the hilly area of the Tianmu Lake Basin. Journal of Lake Sciences, 25 (6), 827–835. [in Chinese]. doi:10.18307/2013.0606.
- Omernik, J.M., 1976. Influence of land use on stream nutrient levels. EPA Report, EPA/600/3–76/014. Oregon: Environmental Research Laboratory.
- Ometo, J.P.H.B., et al., 2000. Effects of land use on water chemistry and macroinvertebrates in two streams of the Piracicaba river basin, south-east Brazil. Freshwater Biology, 44, 327–337. doi:10.1046/j.1365-2427.2000.00557.x
- Ongley, E. D., Zhang, X.L., and Yu, T., 2010. Current status of agricultural and rural non-point source pollution assessment in China. Environmental Pollution, 158 (5), 1159–1168. doi:10.1016/j.envpol.2010.05.018.
- Ongley, E.D., 2004. Non-point source water pollution in China: current status and future prospects. Water International, 29 (3), 299–306. doi:10.1080/02508060408691784.
- Qiao, J., et al., 2012. Nitrogen fertilizer reduction in rice production for two consecutive years in the Taihu Lake area. Agriculture, Ecosystems & Environment, 146 (1), 103–112. doi:10.1016/j.agee.2011.10.014.
- Qin, B.Q., et al., 2007. Environmental issues of Lake Taihu, China. Hydrobiologia, 581 (1), 3–14. doi:10.1007/s10750-006-0521-5.
- Qu, J.H. and Fan, M.H., 2010. The current state of water quality and technology development for water pollution control in China. Critical Reviews in Environmental Science and Technology, 40 (6), 519–560. doi:10.1080/10643380802451953.
- Sayama, T., 2011. Rainfall-Runoff-Inundation model user’s manual ver. 1.4.2. Available from: http://www.icharm.pwri.go.jp/research/pdf/research_topics/2_rri.pdf [Accessed 3 May 2019].
- Sayama, T., et al., 2012. Rainfall-Runoff-Inundation analysis of Pakistan Flood 2010 at the Kabul River Basin. Hydrological Sciences Journal, 57 (2), 298–312. doi:10.1080/02626667.2011.644245.
- Sayama, T., et al., 2013. Analysis on spatial-temporal sources of large-scale flooding. Journal of Japan Society of Civil Engineers, Ser. B1 (Hydraulic Engineering), 69 (4), I_463–I_468. [ in Japanese with English abstract].
- Sayama, T. and McDonnell, J.J., 2009. A new time-space ac-counting scheme to predict stream water residence time and hydrograph source components at the watershed scale. Water Resources Research, 45, W07401. doi:10.1029/2008WR007549
- Sayama, T., Tatebe, Y., and Tanaka, S., 2015. An emergency response-type rainfall-runoff-inundation simulation for 2011 Thailand floods. Journal of Flood Risk Management, 69 (1). doi:10.1111/jfr3.12147.
- Shen, Z., et al., 2014. An overview of Chinas agricultural nonpoint source issues and the development of related research. Hydrology Current Research, 5, 178. doi:10.4172/2157-7587.1000178
- Shen, Z.Y., et al., 2012. An overview of research on agricultural non-point source pollution modelling in China. Separation and Purification Technology, 84 (9), 104–111. doi:10.1016/j.seppur.2011.01.018.
- Sliva, L. and Williams, D.D., 2001. Buffer zone versus whole catchment approaches to studying land use impact on river water quality. Water Research, 35 (14), 3462–3472. doi:10.1016/S0043-1354(01)00062-8.
- Sun, B., et al., 2012. Agricultural non-point source pollution in China: causes and mitigation measures. Ambio, 41 (4), 370–379. doi:10.1007/s13280-012-0249-6.
- TBA (Taihu Basin Authority of Ministry of Water Resources), 2014. Brief introduction to the flood control work in the Taihu Basin [ online]. Available from: www.tba.gov.cn/tba/content/EN/Events/Flood/0000000000005923.html [Accessed Dec 2017].
- TBA (Taihu Basin Authority of Ministry of Water Resources), 2015. The health status report of Taihu Lake (2014). Shanghai: The Taihu Basin Authority. [in Chinese].
- Tsihrintzis, V.A. and Hamid, R., 1997. Modeling and management of urban stormwater runoff quality: a review. Water Resources Management, 11 (2), 136–164. doi:10.1023/A:1007903817943.
- US EPA (US Environmental Protection Agency), 2005a. National management measures to control nonpoint source pollution from forestry. EPA-841-B-05-001. Washington, DC: Nonpoint Source Control Branch, Office of Wetlands, Oceans and Watersheds, Office of Water.
- US EPA (US Environmental Protection Agency), 2005b. Protecting water quality from agricultural runoff. EPA 841-F-05-001. Washington, DC: Nonpoint Source Control Branch.
- Wahl, M.H., McKellar, H.N., and Williams, T.M., 1997. Patterns of nutrient loading in forested and urbanized coastal streams. Journal of Experimental Marine Biology and Ecology, 213, 111–131. doi:10.1016/S0022-0981(97)00012-9
- Wang, C. and Wang, P., 2014. Water quality in Taihu Lake and the effects of the water transfer from the Yangtze River to Taihu Lake project. Reference Module in Earth Systems and Environmental Sciences, 4, 136–161.
- Wang, D.J., et al., 2004. Optimum nitrogen use and reduced nitrogen loss for production of rice and wheat in the Yangtse Delta region. Environmental Geochemistry and Health, 26, 221–227. doi:10.1023/B:EGAH.0000039584.35434.e0
- Wang, Q.G., Gu, G., and Higano, Y., 2006. Toward integrated environmental management for challenges in water environmental protection of Lake Taihu Basin in China. Environmental Management, 37 (5), 579–588. doi:10.1007/s00267-004-0347-8.
- Wang, X., et al., 2011. Estimating non-point source pollutant loads for the large-scale basin of the Yangtze River in China. Environmental Earth Sciences, 63, 1079–1092. doi:10.1007/s12665-010-0783-0
- Wu, M.W., 2012. Simulation of agricultural non-point source pollution in Zhongtianhe Catchment based on AnnAGNPS model. Thesis (Master). Nanjing Agriculture University. [in Chinese with English abstract].
- Xue, H., et al., 2017. Hydrograph-separation-based non-point source pollution modelling in the Pingqiao River Basin, China. Journal of Japan Society of Civil Engineers, Ser. B1 (Hydraulic Engineering), 73 (4), I_169–I_174. doi:10.2208/jscejhe.73.I_169.
- Yang, C.J., 2017. Water quality assessment and simulation of the Pingqiao River Basin. Thesis (Master). University of Chinese Academy of Sciences. [in Chinese with English abstract].
- Yi, P., Zhang, L., and Bao, J., 2008. Study on controlling of the agricultural non-point source pollution in the Tianmu Lake Valley. Pollution Control Technology, 21 (6), 38–43. [in Chinese with English abstract].
- Zhang, F.S., Fan, M.S., and Zhang, W.F., 2007. Principles dissemination and performance of fertilizer best management practices developed in China. In: K.I. Krauss and P. Heffer, eds. Fertilizer best management practice, general principles, strategy for their adoption and voluntary initiatives vs. regulations. Paris: IFA, 193–201.
- Zhang, Q.L., et al., 2010. Model AVSWAT apropos of simulating non-point source pollution in Taihu lake basin. Journal of Hazardous Materials, 174 (1–3), 824–830. doi:10.1016/j.jhazmat.2009.09.127.
- Zheng, Y., et al., 2014. Addressing the uncertainty in modeling watershed nonpoint source pollution. Developments in Environmental Modelling, 26, 113–159.
- Zhou, Y.Q., et al., 2017. Improving water quality in China: environmental investment pays dividends. Water Research, 118, 152–159. doi:10.1016/j.watres.2017.04.035
- Zhu, Q.D., et al., 2015. Runoff characteristics and non-point source pollution analysis in the Taihu Lake Basin: a case study of the town of Xueyan, China. Environmental Science and Pollution Research, 22, 15029–15036. doi:10.1007/s11356-015-4709-y