
 ?Mathematical formulae have been encoded as MathML and are displayed in this HTML version using MathJax in order to improve their display. Uncheck the box to turn MathJax off. This feature requires Javascript. Click on a formula to zoom.
ABSTRACT
The aim of this study is to reveal statistical characteristics and exceedance probability of discharge under the combined effect of climate change and human activities. The study is conducted in the Xiaoqing River in Jinan, China, based on data of discharge, land-use types and precipitation from the period 1970–2016. A multivariate joint probability distribution of the data is established to test the univariable, bivariable and trivariable change points. These are then used to calculate and analyse the risk probability of discharge exceeding the specific values under different conditions of precipitation and land-use type. The results show that the change point calculated by trivariate joint distribution can reduce the disturbance of the change point obtained with the univariable or bivariable approach and reflect the changes of various factors in the hydrological processes more objectively. When the land-use type is taken into consideration, the trivariate distribution can reflect the variation of hydrological processes more reasonably.
Editor A. CastellarinGuest editor Y. Chen
1 Introduction
Human activities and climate change are two major factors affecting the hydrological processes of rivers, especially in rapidly urbanizing regions where hydrological processes are being seriously disturbed. Many rivers in urban regions have experienced an increasing frequency of floods over the past few years, which have led to ecological problems and affected livelihoods (Lian et al. Citation2012, Sun et al. Citation2012, Suriya and Mudgal Citation2012, Chen et al. Citation2015, Mcgrane Citation2015, Zhao et al. Citation2016). Thus, more and more attention has been paid to changes in river hydrological processes (e.g. Jay and Naik Citation2011, Zhang et al. Citation2015), especially to excessive discharge. Many researchers have employed distributed hydrological models to investigate the changes in hydrological processes (e.g. Paturel et al. Citation2003, Piniewski et al. Citation2013, Khoi and Suetsugi Citation2014). However, compared with natural rivers, the combined effect of climate change and human activities is more evident in urban regions. Moreover, with the intensification of urbanization, it not only has a direct impact on the hydrological processes of rivers, but also affects the urban climate where the rivers are located (Shepherd Citation2006, Chen et al. Citation2016, Cristiano et al. Citation2017). This then has an indirect effect on the hydrological processes of urban rivers in particular. With more interdependent factors affecting the hydrological processes of urban rivers, the calibration of parameters and the construction of the models are complex (Huang et al. Citation2015). As an alternative, non-mechanism models based on probability and statistics may be employed to avoid such problems to some extent. The elasticity method (Zhao et al. Citation2015, Li et al. Citation2016), the Budyko hypothesis and support vector machine (SVM) (Huang et al. Citation2016), as well as artificial neural networks (Guimaraes Santos and Silva Citation2014, Zemzami and Benaabidate Citation2015) are common non-mechanism models based on probability and statistics. These methods can be used to predict and simulate changes in hydrological processes by calculating and analysing the probability of hydrological events. However, most of them are based on the assumption that climate change and the human activities are independent factors (Peng et al. Citation2014, Xia et al. Citation2014, Ashofteh et al. Citation2016). Both hydrological models and non-mechanism models place emphasis on evaluating the contribution of either climate change or human activities to changes in hydrological processes, but it is relatively rare for the analysis to be of the joint effect of these two factors. Models ignore the combined effect of climate change and human activities (Liu et al. Citation2014), which means that their results cannot clearly reveal the change law of hydrological processes of rivers subject to a greatly changed environment. This suggests that a univariate or bivariate joint distribution of, for example, precipitation and discharge can no longer accurately reflect the changes in hydrological processes of urban rivers. Thus, to study highly urbanized regions, it is necessary to construct a multivariate joint probability distribution to reveal the occurrence probability of discharge under different conditions of precipitation, with the third variable of the land-use type.
Traditional joint probability distributions require all variables to have the same marginal distribution. However, in general, different variables may be subject to different marginal distributions, which leads to the information loss of data in the process of transformation (Zhang and Singh Citation2007). The copula probability distribution is one function that can overcome the drawbacks, and can connect with different univariate marginal distributions without changing the dependence structure of variables (Zegpi and Fernandez Citation2010, Dai et al. Citation2014). Thus, one can construct a joint probability distribution of any univariate marginal distribution, while the information included in initial data will be retained in the transformation process. Due to these advantages, the copula probability distribution has been applied in various hydrological fields, such as analysis of the probability of flood risk (e.g. Kao and Chang Citation2012, Bezak et al. Citation2014, Li and Zheng Citation2016, Debele et al. Citation2017), study of the drought characteristics of watersheds (e.g. Hao and Aghakouchak Citation2013, Yusof et al. Citation2013, Bazrafshan et al. Citation2015) and tests of the joint change point of precipitation and discharge (Guo et al. Citation2015, Lv et al. Citation2015). These studies are based on the two-dimensional copula. The land-use type has not been directly incorporated into the copula, and the application of three-dimensional copula probability distribution to analyse the combined effect of climate change and human activities on the hydrological processes of urban rivers has not been done to the authors’ knowledge.
Therefore, this paper introduces a novel approach to identify a joint change point of hydrological processes, integrating precipitation and land-use types, which are closely related to urbanization and river discharge. To this end, the exceedance probability of discharge after the joint change point under different combinations of precipitation and land-use type is calculated, and then the relationship between precipitation, land-use type and discharge is systematically analysed. The method can serve as a guide for urban managers to understand the change law of hydrological processes under different combined situations of precipitation and urbanization. The objectives of this paper are: (1) to construct a multivariate joint distribution of the main influence indexes (precipitation and land-use type) and the response index (discharge) and (2) to calculate the hydrological change points and the exceedance probability of discharge under the joint effect of precipitation and land-use type to evaluate the hydrological processes of an urban river in China. In the next section, the general characteristics of the study area and the collected data are presented, and the methods are introduced in Section 3. The results and discussion are given in Section 4, and the conclusions, and future research directions are summarized in Section 5.
2 Study area and data
The city of Jinan is located in the midwestern part of Shandong Province, eastern China (36°40′N, 116°57′E), and is in a monsoon climate area. Jinan is the capital city of Shandong Province with more than 8.8 million people and a GDP of US$86 billion. The Xiaoqing River is the main flood discharge channel that rises in Muli Gate; it spans five cities (Jinan, Binzhou, Zibo, Dongying and Weifang, in order from upstream to downstream) in Shandong Province and then discharges into the Bohai Sea. The study focuses on the 21 km reach between the Muli Gate in Jinan and the Huangtai hydrological station, which has a drainage area of 321.0 km2. The Xiaoqing River basin covers the main urban area of Jinan. As the main flood discharge channel for Jinan, its water sources include precipitation in the flood season, groundwater and some treated wastewater. In recent years, with the rapid economic and social development of Jinan, the urban area has increased rapidly. This has resulted in dramatic changes in the underlying surface conditions in the study area, and the urban rain island effect has also been significantly enhanced, resulting in an increase in precipitation and significant changes in the hydrological process of the Xiaoqing River (Huang and He Citation2011).
The distribution of rivers, precipitation stations and hydrological stations in the study area is shown in . shows the average annual discharge for the period 1970–2016 monitored by the Huangtai hydrological station and the average annual precipitation monitored by seven precipitation stations. In addition, a total of 13 remote sensing images were collected from Landsat 3–8,Footnote1 all of them in May to October. Details of the remote sensing images are shown in .
Table 1. Basic information of remote sensing images.
Figure 1. Map of the Xiaoqing River Basin above Huangtai Station with the location of rainfall and hydrological stations.
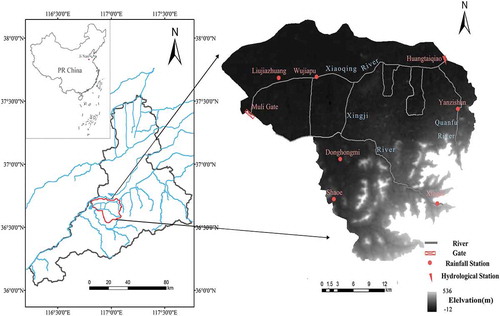
Figure 2. Variation of the annual average (a) precipitation and (b) discharge of the Xiaoqing River basin above the Huangtai hydrological station from 1970 to 2016.
3 Research method
3.1 Extraction of land-use types
It is difficult to obtain a long data series of land-use type in most areas of China. At present, the commonly used method is to interpret remote sensing images of the study area. In this study, a method of combining ENVI (Environment for Visualising Images v5.5) software for the analysis and visualization of scientific data and imagery) and a CA (Cellular Automata)-Markov model is proposed to deduce the impervious area (CA) value through the forward and reverse deduction of the probability matrix of state transition. The specific steps are as follows:
Firstly, for remote sensing images meeting the accuracy requirements, ENVI was used to perform radiometric calibration and quick atmospheric correction, and then supervised classification was used to interpret different land-use types. Secondly, the data of land-use types of the control years are used to calibrate the parameters of the CA-Markov model to simulate the area of different land-use types in the years lacking the remote sensing images or not meeting the accuracy requirements.
The transition probability matrix and transition area matrix of the land-use types are expressed, respectively, as follows:
where Ft and Ft+1 are the area matrix of the land-use types at time t and t+ 1, respectively; Pij is the probability matrix of state transition; St and St+1 denote the state set of the cellular automation at time t and t+ 1, respectively; N is the neighbourhood of the cellular automation; and f is the transfer function that defines the transfer of the cellular automation from time t to time t+ 1.
3.2 Identification of the joint change point based on copula
3.2.1 Selection of the multivariate copula functions
In order to identify the change points of a multivariable long sequence, we first need to establish a multivariate joint distribution. The copula theory proposed by Sklar in Citation1959 can connect any d-dimensional cumulative distributions with a copula function. The Archimedean copula function is commonly used in the hydrological field (Guo et al. Citation2008, Zhang et al. Citation2011). In general, the d-dimensional symmetric Archimedean copula function is defined as follows:
where φ(~) is the generation function of the Archimedean copula function; and φ−1 is the inverse function of φ.
Typical symmetrical Archimedean copula functions include Clayton, Gumbel-Hougaard (G-H), Frank and Ali-Mikhail-Haq (AMH). The construction of the copula joint distribution mainly involves the following steps:
Step 1. The distribution of hydrological variables is fitted to determine the optimal type of each marginal distribution.
Step 2. According to the distribution type of each marginal function, the parameters θ of the four symmetric Archimedean copula functions are calculated and the copula function with the optimal fitting is determined.
3.2.2 Identification of the joint change points
Assuming that there is only a single change point in the single-parameter Archimedean copula function, constructed based on the observed data , the original hypothesis (H0) and the alternative hypothesis (H1) can be, respectively, assumed as:
If the original hypothesis is rejected, then k* is the moment of change. If k* = k, the log-likelihood ratio statistic of the copula can be established based on the maximum likelihood estimation method, as shown by:
where are the maximum likelihood estimations of the corresponding data,
.
The statistic is constructed and, if k* is unknown, the original hypothesis will be rejected when zn is greater than the critical value; that is, the Archimedean copula function has a change point. The binary segmentation method will be applied in the test if there is more than one change point in the sequence (Jarušková Citation2015).
3.3 Combined exceedance probability of discharge
According to the full probability formula and the copula functions (Song and Nie Citation2011), we can quantitatively analyse the exceedance probability, i.e. that the discharge exceeds specific values in the combined conditions of precipitation and land-use types. Taking the joint probability distributions of two and three dimensions as an example, the expressions are as follows:
where V and U denote the affecting factors; v and u are their specific values; W denotes discharge and w is its specific value; PVW is the bivariate joint probability distribution of the pair (P,Q), PUVW is the trivariate joint probability distribution of set (CA,P,Q); FU(u), FV(u) and FW(u) are the marginal distributions of V, U and W, respectively; and C(u,v,w) is the copula function of the variables.
4 Results and discussion
4.1 Change points and trend of univariate distribution
The collected remote sensing images are preprocessed, and supervised classification done by ENVI, and then they are clipped by the boundary of the study area, which is extracted by ArcGIS, to obtain the areas of land-use types. Taking 2 years as the calculation step of land transfer, the land-use types in the year 2033 can be forecast and CA of 0.64 is obtained. Some typical land-use types are shown in and the ratio of impervious area (CA) from 1970 to 2016 is shown in .
Figure 3. Land-use types of the Xiaoqing River basin above the Huangtai hydrological station in typical years.
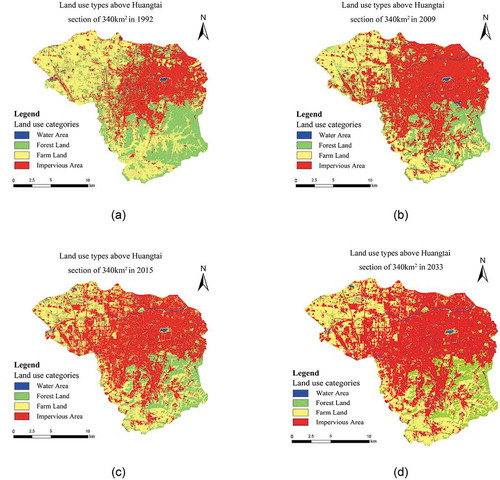
Figure 4. The ratio of impervious area of the Xiaoqing River basin above the Huangtai hydrological station (1970–2016).
As can be seen from , the value of CA has been increasing in the study basin. The Mann-Kendall (M-K) test (Yue and Wang Citation2004) is used to analyse the trend and identify the change points of the data series of annual precipitation (P), discharge (Q) and impervious area (CA). The results are shown in . The annual discharge and CA show a clear trend of growth, while the trend in annual precipitation is not obvious. In addition, the land-use types changed first in 1992, and the first change point of the discharge occurred in 1994, while the precipitation is the last one to change in 2003.
Table 2. Identification of the trend and change points of univariate distribution of the Xiaoqing River basin above the Huangtai hydrological station in the period 1970–2016. ↑ and ↓denote an increasing or decreasing trend; + and – represent a significant and insignificant trend, respectively.
4.2 Construction of multivariate joint distribution and analysis of joint change points
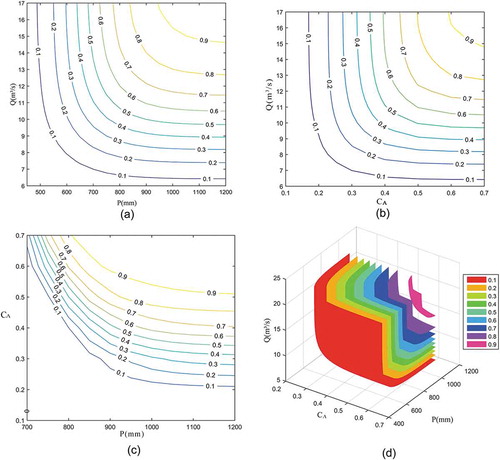
The Clayton, G-H and Frank copula functions are used to construct the bivariate and trivariate joint probability distributions with the data of P, CA and Q of Xiaoqing River in Jinan for the period 1970–2016. The proper distribution was chosen to use the Kolmogorov-Smirnov (K-S) test and root mean square error (RMSE) (Justel et al. Citation1997, Willmott and Matsuura Citation2005). The parameters of the copulas and the results of the goodness-of-fit tests are shown in . It can be seen from that the Clayton copula is proper for sets of (P,Q) and (CA,Q), and the G-H copula is proper for sets of (CA,P) and (CA,P,Q). The corresponding contour plots and contour surface are presented in .
Table 3. Parameter values and test results of multivariable copula functions, Clayton, Gumbel-Hougaard (GH) and Frank. RMSE: root mean square error; K-S: Kolmogorov-Smirnov test. Bold denotes the minimum RMSE and K-S, and the best fitness parameter.
Figure 5. Contour plots and surface of bivariate and trivariate joint probability distribution for the period 1970–2016. Bivariate joint probability of: (a) set (P,Q); (b) set (CA,Q); (c) set (CA,P); and (d) trivariate joint probability of set (CA,P,Q).
Combining the optimal copula functions of the two- and three-variable sets and Equation (4), their joint change points can be identified. When the number of data is 46, the critical value of Zn is 8.82. The corresponding results are shown in and , which indicate that the pairs (P,Q), (CA,P) and set (CA,P,Q) have only one change point in 2000, 2002 and 2007, respectively, while there are two change points for the pair (CA,Q), in 1992 and 2003.
Table 4. Change points and tail-dependence of two- and three-variable parameter sets.
Figure 6. Analysis of the combined change points based on two- or three-variable sets: (a) pair (P,Q); (b) pair (CA,Q); (c) pair (CA,P); and (d) set (CA,P,Q).
4.3 Analysis of multivariate joint distribution of CA, P and Q before and after the joint change point
The data of CA, P and Q after the joint change point is more suitable for representing hydrological processes in recent years. Therefore, we re-established the multivariate joint probability distribution using the data after the joint change point. In addition, in order to better reflect the change law of hydrological processes, we also re-established the copula before the joint change point. The parameters of the copulas are shown in .
Table 5. Selected copulas and their parameters before and after the combined change point. G-H: Gumbel-Hougaard, AMH: Ali-Mikhail-Haq.
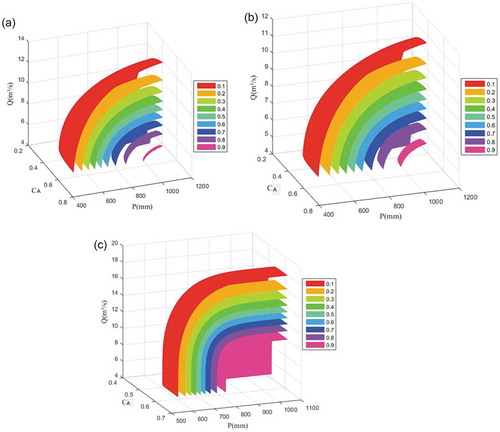
With the constructed joint probability distributions of (P,Q) and (P,CA,Q) before and after the joint change point, the combined exceedance probability of discharge of the Xiaoqing River in Jinan can be analysed. According to Equations (5) and (6), PVW is the bivariate joint probability distribution of the pair of (P,Q), which represents the exceedance probability of discharge with different precipitations, while PUVW is the trivariate joint probability distribution of the set (P,CA,Q), which represents the combined exceedance probability of discharge in combination with precipitation and land-use types. The contour plots of PVW and contour surfaces of PUVW before and after the joint change point are shown in and , respectively.
Figure 7. Contour plots of PVW(v,w) probability: (a) with all the data of 1970–2016; (b) before the change point (1970–2000); and (c) after the change point (2000–2016).
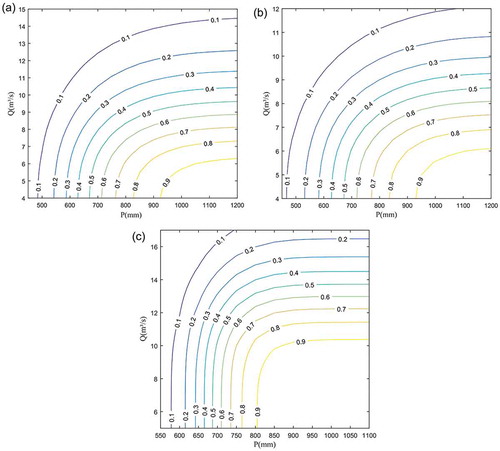
Figure 8. Contour surface plots of PUVW(u,v,w) probability: (a) with all the data of 1970–2016; (b) before the change point (1970–2007); and (c) after the change point (2007–2016).
4.4 Discussion
By comparing the change points of the univariate, bivariate and trivariate distribution, we can see that their occurrence time does not coincide. The change point of the single index occurred the earliest and that of the trivariate indexes occurred the latest. The reason is the single index only considers the changes of its own sequence without taking the effects of other factors into account. For example, for the Q series, although the discharge suddenly increased in 1994, the precipitation also significantly went up from 541.1 to 834.2 mm in 1993, so the dependency relationship of pair (P,Q) may still remain stable. Therefore, the change point of the single discharge sequence will not lead to a mutation in the dependency relationship of (P,Q). On the contrary, even if the P series has not mutated, the dependency relationship of (P,Q) may also be mutated. Similarly, when it comes to (P,Q) and (CA,P,Q), the dependency relationship of (P,Q) mutated in 2000, yet if the land-use type is taken into consideration, the dependency relationship between the three-dimensional variables would not have mutated until 2007. Therefore, compared with the change point tests of univariate and bivariate distribution, the test of trivariate distribution considers the joint effect of different factors more comprehensively, which reduces the impact of individual variable and describes the changes of discharge more objectively under different levels of land development and precipitation.
From , we can see that the contour plot spacing of ) is smaller than that of ) and (). This indicates that the discharge is more sensitive to changes in precipitation when the dependence relationship of (P,Q) has mutated. Besides, from , it can be seen that the contour plot of (P,Q) after the change point has an obvious defect: with the increase of P, especially when P is larger than 800 mm, the exceedance probability of Q basically remains unchanged, which indicates that the two-dimensional joint distribution cannot well reveal the change law of discharge in Xiaoqing River in Jinan.
From , we can see that the value of joint probability tends to be large with more precipitation and greater CA. When the dependence relationship of (P,Q,CA) passes through the joint change point, the contour surface spacing of becomes smaller than that of and (). Meanwhile, does not show the same defect as , which suggests that the established multivariate probability distribution can quantitatively evaluate the exceedance probability of discharge for a wider range of conditions.
We can further obtain some typical values of the joint probability of P, CA and Q to evaluate the combined exceedance probability of discharge and to provide urban managers with more concise guidance. Typical values of joint probability are shown in and . They describe the risk probability of discharge exceeding a specific value under the conditions that only P is considered or that P and CA are considered in combination. For example, under the condition that only P is considered, PVW = P(V ≤ 800, W ≥ 12) = 0.1506, while under the condition that P and CA are both considered, PUVW = P(U ≤ 800, U ≤ 0.5, W ≥ 12) = 0.1727. The results show that the trivariate joint probability of the parameter set (CA,P,Q) is larger than the bivariate joint probability of pair (P,Q). Therefore, if only the discharge and precipitation are considered, it cannot reasonably reflect the relationship between river water and water quality. The trivariate joint probability distribution considering Q, P and CA can more comprehensively express the characteristics of the change law of hydrological processes.
Table 6. Joint probability of (P,Q).
Table 7. Joint probability of (P,CA,Q).
5 Conclusions
This study analyses the main influence and response indicators of the hydrological processes of the Xiaoqing River in Jinan. By building a three-dimensional joint distribution of the set (CA,P,Q), this paper compares the occurrence time of change points of one-, two- and three-variable sets as well as the variation in the joint probability; thus urban managers can evaluate the given design value risk exceeded by a combination of events (CA,P,Q), as well as the changes in risk values before and after the joint change point. The outcome of the study may be summarized as follows:
Due to taking the relationship between precipitation, land-use types and discharge into account, the test of multivariable joint change point is less affected by an individual index. Thus, this test can more accurately identify the change point in hydrological processes of urban rivers.
Urbanization has an obvious impact on the hydrological processes of rivers. Under the condition of little change in annual precipitation in the two change periods, no matter the bivariate and trivariate joint distributions, the joint probability distribution of discharge, and other factors is obviously different in the two periods, which indicates that human activities are having an impact on hydrological processes.
In the same case of precipitation, the exceedance probability of discharge calculated by three-dimensional joint distribution is greater than the value calculated by two-dimensional joint distribution. The three-dimensional joint distribution considers the factors more comprehensively, so it is more objective than the two-dimensional joint distribution to reflect the occurrence probability of hydrological variation of urban rivers.
Due to the limitations of data acquisition, especially that of land-use types, the sequence length in this paper is only 47 years, which results in the data sequence length after change points being short and the joint probability value calculated may have some deviation. Future work should continue to supplement the data in the future to improve the research on hydrological changes of urban rivers.
Acknowledgements
The authors are grateful for the insightful suggestions made by the editors and the anonymous reviewer, which helped to improve the paper. We are grateful for the basic data provided for this study by the Water Resources Department of Shandong Province in China.
Disclosure statement
No potential conflict of interest was reported by the authors.
Additional information
Funding
Notes
References
- Ashofteh, P.S., et al., 2016. Evaluation of the impacts of climate variability and human activity on streamflow at the basin scale. Journal of Irrigation & Drainage Engineering, 142 (8), 04016028. doi:10.1061/(ASCE)IR.1943-4774.0001038
- Bazrafshan, J., Nadi, M., and Ghorbani, K., 2015. Comparison of Empirical Copula-Based Joint Deficit Index (JDI) and Multivariate Standardized Precipitation Index (MSPI) for drought monitoring in Iran. Water Resources Management, 29 (6), 1–18. doi:10.1007/s11269-015-0926-x
- Bezak, N., Mikoš, M., and Šraj, M., 2014. Trivariate frequency analyses of peak discharge, hydrograph volume and suspended sediment concentration data using copulas. Water Resources Management, 28 (8), 2195–2212. doi:10.1007/s11269-014-0606-2
- Chen, H., Zheng, Y., and Ai, K., 2016. Numerical study of the impacts of urbanization in different areas of china on East Asia monsoonal climate. Meteorology & Disaster Reduction Research, 39 (1), 16–31. doi:10.12013/qxyjzyj2016-003
- Chen, Y., et al., 2015. Urban flood risk warning under rapid urbanization. Environmental Research, 139 (S1), 3–10. doi:10.1016/j.envres.2015.02.028
- Cristiano, E., Veldhuis, M.C.T., and Giesen, N.V.D., 2017. Spatial and temporal variability of rainfall and their effects on hydrological response in urban areas – a review. Hydrology & Earth System Sciences, 21 (7), 1–34. doi:10.5194/hess-21-3859-2017
- Dai, Q., et al., 2014. Modelling radar-rainfall estimation uncertainties using elliptical and Archimedean copulas with different marginal distributions. Hydrological Sciences Journal, 59 (11), 1992–2008. doi:10.1080/02626667.2013.865841
- Debele, S.E., Bogdanowicz, E., and Strupczewski, W.G., 2017. The impact of seasonal flood peak dependence on annual maxima design quantiles. Hydrological Sciences Journal, 62 (10), 1603–1617. doi:10.1080/02626667.2017.1328558
- Guimaraes Santos, C.A. and Silva, G.B.L.D., 2014. Daily streamflow forecasting using a wavelet transform and artificial neural network hybrid models. Hydrological Sciences Journal, 59 (2), 312–324. doi:10.1080/02626667.2013.800944
- Guo, A., et al., 2015. Variation characteristics of rainfall-runoff relationship and driving factors analysis in Jinghe river basin in nearly 50 years. Transactions of the Chinese Society of Agricultural Engineering, 31 (14), 165–171. doi:10.11975/j.issn.1002-6819.2015.14.023
- Guo, S.L., et al., 2008. Multivariate hydrological analysis and estimation. Journal of China Hydrology, 28 (3), 1–7.
- Hao, Z. and Aghakouchak, A., 2013. Multivariate Standardized Drought Index: A parametric multi-index model. Advances in Water Resources, 57 (9), 12–18. doi:10.1016/j.advwatres.2013.03.009
- Huang, G.R. and He, H.J., 2011. Impact of urbanization on features of rainfall during flood period in Jinan City. Journal of Natural Disasters, 20 (3), 7–12. doi:10.13577/j.jnd.2011.0302
- Huang, S., et al., 2016. Quantifying the relative contribution of climate and human impacts on runoff change based on the Budyko hypothesis and SVM model. Water Resources Management, 30 (7), 2377–2390. (可用到 基于统计的非机理模型). doi:10.1007/s11269-016-1286-x
- Huang, S., et al., 2015. Contributions of climate variability and human activities to the variation of runoff in the Wei River basin, China. Hydrological Sciences Journal, 61 (6), 1026–1039. doi:10.1080/02626667.2014.959955
- Jarušková, D., 2015. Some problems with application of change‐point detection methods to environmental data. Environmetrics, 8 (5), 469–483. doi:10.1002/(SICI)1099-095X(199709/10)8:53.3.CO;2-A
- Jay, D. and Naik, P., 2011. Distinguishing human and climate influences on hydrological disturbance processes in the Columbia River, USA. Hydrological Sciences Journal, 56 (7), 1186–1209. doi:10.1080/02626667.2011.604324
- Justel, A., Peña, D., and Zamar, R., 1997. A multivariate Kolmogorov-Smirnov test of goodness of fit. Statistics & Probability Letters, 35 (3), 251–259. doi:10.1016/S0167-7152(97)00020-5
- Kao, S.C. and Chang, N.B., 2012. Copula-based flood frequency analysis at ungauged basin confluences: Nashville, Tennessee. Journal of Hydrologic Engineering, 17 (7), 790–799. doi:10.1061/(ASCE)HE.1943-5584.0000477
- Khoi, D.N. and Suetsugi, T., 2014. Impact of climate and land-use changes on hydrological processes and sediment yield—a case study of the be river catchment, vietnam. Hydrological Sciences Journal, 59 (5), 1095–1108. doi:10.1080/02626667.2013.819433
- Li, B., Chen, Y., and Xiong, H., 2016. Quantitatively evaluating the effects of climate factors on runoff change for Aksu River in northwestern China. Theoretical & Applied Climatology, 123 (1–2), 97–105. doi:10.1007/s00704-014-1341-6
- Li, F. and Zheng, Q., 2016. Probabilistic modelling of flood events using the entropy Copula. Advances in Water Resources, 97, 233–240. doi:10.1016/j.advwatres.2016.09.016
- Lian, Y., et al., 2012. Impact of human activities to hydrologic alterations on the Illinois River. Journal of Hydrologic Engineering, 17 (4), 537–546. doi:10.1061/(ASCE)HE.1943-5584.0000465
- Liu, C.Z., et al., 2014. Review on the influences of climate change and human activities on runoff. Journal of Hydraulic Engineering, 45 (4), 379–385. doi:10.13243/j.cnki.slxb.2014.04.001
- Lv, J., et al., 2015. Study on the runoff response to climate change-a case study of source region of the yellow river. Journal of Hydroelectric Engineering, 34 (4), 191–198.
- Mcgrane, S.J., 2015. Impacts of urbanisation on hydrological and water quality dynamics, and urban water management: a review. Hydrological Sciences Journal, 61 (13), 2295–2311. doi:10.1080/02626667.2015.1128084
- Paturel, J.E., et al., 2003. The influence of distributed input data on the hydrological modelling of monthly river flow regimes in West Africa. Hydrological Sciences Journal, 48 (6), 881–890. doi:10.1623/hysj.48.6.881.51422
- Peng, B., Liu, W., and Guo, M., 2014. Impacts of climate variability and human activities on decrease in streamflow in the Qinhe River, China. Theoretical & Applied Climatology, 117 (1–2), 293–301. doi:10.1007/s00704-013-1009-7
- Piniewski, M., et al., 2013. Effect of modelling scale on the assessment of climate change impact on river runoff. Hydrological Sciences Journal, 58 (4), 737–754. doi:10.1080/02626667.2013.778411
- Shepherd, J.M., 2006. Evidence of urban-induced precipitation variability in arid climate regimes. Journal of Arid Environments, 67 (4), 607–628. doi:10.1016/j.jaridenv.2006.03.022
- Sklar, M., 1959. Fonctions de repartition an dimensions et leurs marges. Publications De l’Institut De Statistique De l’Université De Paris, 8, 229–231.
- Song, S.B. and Nie, R., 2011. Asymmetric Archimedean Copulas for multivariate hydrological drought frequency analysis. Journal of Hydroelectric Engineering, 30 (4), 20–29.
- Sun, Y.W., et al., 2012. Eco-hydrological impacts of urbanization. Advances in Water Science, 23 (4), 569–574.
- Suriya, S. and Mudgal, B.V., 2012. Impact of urbanization on flooding: the Thirusoolam sub watershed – a case study. Journal of Hydrology, 412 (1), 210–219. doi:10.1016/j.jhydrol.2011.05.008
- Willmott, C.J. and Matsuura, K., 2005. Advantages of the mean absolute error (MAE) over the root mean square error (RMSE) in assessing average model performance. Climate Research, 30 (1), 79–82. doi:10.3354/cr030079
- Xia, J., et al., 2014. Quantifying the effects of climate change and human activities on runoff in the water source area of Beijing, China. Hydrological Sciences Journal, 59 (10), 1794–1807. doi:10.1080/02626667.2014.952237
- Yue, S. and Wang, C., 2004. The Mann-Kendall test modified by effective sample size to detect trend in serially correlated hydrological series. Water Resources Management, 18 (3), 201–218. doi:10.1023/B:WARM.0000043140.61082.60
- Yusof, F., et al., 2013. Characterisation of drought properties with bivariate copula analysis. Water Resources Management, 27 (12), 4183–4207. doi:10.1007/s11269-013-0402-4
- Zegpi, M. and Fernandez, B., 2010. Hydrological model for urban catchments–analytical development using copulas and numerical solution. Hydrological Sciences Journal, 55 (7), 1123–1136. doi:10.1080/02626667.2010.512466
- Zemzami, M. and Benaabidate, L., 2015. Improvement of artificial neural networks to predict daily streamflow in a semi-arid area. International Association of Scientific Hydrology Bulletin, 61 (10), 1801–1812. doi:10.1080/02626667.2015.1055271
- Zhang, L. and Singh, V.P., 2007. Bivariate rainfall frequency distributions using Archimedean copulas. Journal of Hydrology, 332 (1), 93–109. doi:10.1016/j.jhydrol.2006.06.033
- Zhang, S., et al., 2015. Hydrological change driven by human activities and climate variation and its spatial variability in Huaihe Basin, China. Hydrological Sciences Journal, 61 (8), 1370–1382. doi:10.1080/02626667.2015.1035657
- Zhang, X., et al., 2011. Jointed distribution function of water quality and water quantity based on Copula. Journal of Hydraulic Engineering, 42 (4), 483–489.
- Zhao, C., et al., 2015. Separation of the impacts of climate change and human activity on runoff variations. Hydrological Sciences Journal, 60 (2), 234–246. doi:10.1080/02626667.2013.865029
- Zhao, G., et al., 2016. Impact of rapid urbanization on rainfall-runoff processes in urban catchment: case study for Liangshan River basin. Journal of Hydroelectric Engineering, 35 (5), 55–64.