
ABSTRACT
Crete is a Mediterranean, karst-dominated island, characterized by long drought periods. The Karst-SWAT model, combined with 11 climate change scenarios, was run to assess climate change impacts on the island under two set-ups, both using the auto-irrigation function of the model: (1) with water drawn from the shallow or deep aquifer, and (2) with irrigated water derived from an unlimited outside source. The first set-up provided insight into the fluctuation of future irrigation needs, and when compared to the second set-up, enabled quantification of the future water deficit. The Water Exploitation Index was used to describe the spatial variability of future water stress on Crete. A decrease in both surface and karstic spring flows is foreseen, especially after 2060 (24.2 and 16.5%, respectively). Simulated irrigation water demand and water deficit show continuous increase throughout the projection period (2020–2098).
Editor S. Archfield Associate editor M. Piniewski
1 Introduction
Climate change is one of the most important global challenges of this century, with significant impacts on ecological, social and financial levels. The Fifth Scientific Assessment Report of the Intergovernmental Panel on Climate Change (IPCC) (Stocker et al. Citation2013) states that, especially for the Northern Hemisphere, the 1983–2012 period was the warmest 30-year period of the last 1400 years. In southern Europe and the Mediterranean region, it is likely that the temperature will increase between 2 and 3°C under the Representative Concentration Pathway of 4.5 W/m2 (RCP4.5) scenario and between 4 and 6 °C under the RCP8.5 scenario, and that precipitation is likely to resemble the RCP8.5 scenario. This implies that there is high confidence in the occurrence of surface drying in these regions by the end of this century (Stocker et al. Citation2013)
These IPCC model projections of anthropogenic impacts have identified the Mediterranean region as a “climate change hot-spot” (Giorgi Citation2006, Hoerling et al. Citation2012). The Mediterranean region is expected to be affected most by the impacts of climate change on hydrology and water resources (Koutroulis et al. Citation2018). The specific region is projected to undergo the most significant drying (as a percentage of climatological rainfall) among 26 regions across the world, by the end of the 21st century (Giorgi Citation2006).
The socio-economic impacts of climate change have already been seen in Syria, located in the southeast Mediterranean region. The drought had a catalytic effect, leading to elevated mean sea-level pressure in the Eastern Mediterranean which caused Syria and the greater Fertile Crescent to experience the worst 3-year drought ever recorded (Trigo et al. Citation2010). The already tense water and agricultural conditions were exacerbated, leading to agricultural production failure along with livestock mortality. The most important effect was the migration of 1.5 million people (Kelley et al. Citation2015) or more (Gleick Citation2014, Selby et al. Citation2017) from rural farming to urban regions, contributing to the social instability of the area.
Irrigated agriculture consumes most of the water used in the Mediterranean. About 50% of the total water withdrawal in the Mediterranean region is intended for agriculture. This percentage varies significantly for Mediterranean sub-regions: 1.3% in Croatia, 12% in France, and almost 90% in Syria, Egypt, Cyprus and Greece (Fader et al. Citation2016). The increased frequency of drought periods observed in the land areas around the Mediterranean Sea (i.e. Greece) in recent decades (Mariotti Citation2010) is alarming due to the imminent threats posed to food security in the region (Nelson et al. Citation2009).
Climate change affects both recharge and discharge rates, and changes in the quantity and quality of water in aquifers due to groundwater variation (Panwar and Chakrapani Citation2013). The response of groundwater resources to climate change is slower in comparison to that of surface water (Kløve et al. Citation2011, Ertürk et al. Citation2014). The excessive irrigated agriculture (Aeschbach-Hertig and Gleeson Citation2012) has led to a significant increase in groundwater resources stress over recent decades (Wada et al. Citation2010). Increases in temperature and atmospheric CO2 concentration may result in net primary production increases, which suggest greater irrigation demand. It is important to quantify the degree to which climate change will affect water availability in order to establish adaptation measures (Hartmann et al. Citation2014).
There have been various recent studies on the impacts of climate change on future water availability in the Mediterranean (Nunes et al. Citation2017). Some studies have focused on the effects of climate change on the discharge of karstic formations (Hartmann et al. Citation2012, Nerantzaki et al. Citation2015, Romanazzi et al. Citation2015, Zakhem and Kattaa Citation2016), while others have investigated the impacts of climate change on global irrigation requirements, and the findings are not fully consistent. Fader et al. (Citation2016) assessed how climate change and increases in atmospheric CO2 concentrations may affect irrigation requirements in the Mediterranean region in the context of demographic and technological change, with some countries having a high risk of not being able to sustainably meet future irrigation water requirements under some scenarios (Fader et al. Citation2016).
The objective of this study is to predict the future hydrological conditions (surface and karstic spring runoff and irrigation needs) in a large Mediterranean region with karstic formations, i.e. the island of Crete, using the modified version of the Soil and Water Assessment Tool (SWAT), the Karst-SWAT hydrological model. A significant component of this assessment is the quantification of the irrigated water deficit under present and future conditions, thus providing an integrated view of the impact of climate change on the hydrological budget of the island. The Karst model and the connectivity with SWAT were implemented in a Structured Query Language (SQL) code for fast and efficient export of a high of volume data and calculations, thus making the Karst-SWAT framework of analysis a useful tool for the management of water resources in Crete.
2 Material and methods
2.1 Site description
According to the Special Water Secretariat of Greece (Citation2015), Crete is the largest island in Greece and the fifth largest in the Mediterranean region, with a total area of 8265 km2; the island is 260 km long, 12–57 km wide and has a 1306-km-long coastline (including some smaller islands). There are four prefectures in the island (from west to east): Chania (2342 km2), Rethymno (1487 km2), Heraklion (2626 km2) and Lasithi (1810 km2) (). The island is characterized by intense terrain and has four large mountainous complexes, with many common features such as geological formations (marble with alterations of silica materials which form plates).
Figure 1. Map of Crete including altitudes (m), stream network and karstic springs used for calibration of the Karst-SWAT model, precipitation and temperature stations used as input, and prefectures.
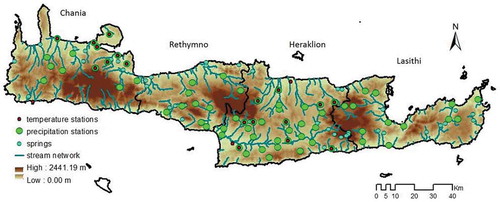
The climate type of Crete is semi-arid. Temperature deviations are mild. The mountainous zone of Crete exhibits higher temperature deviations, with an average annual temperature of 2–3°C lower than the lowland. Annual precipitation varies and ranges from 300 mm around coastal areas to 2000 mm in Lefka Ori (a mountain in Chania). The range of the mean annual temperature is 18.5°C (western Crete) to 20°C (south Crete).
A particular feature of the Cretan environment is the wide variety of geological formations. About 5200 caves and karstic formations have been recorded in Crete and 25 plateaus are formed between the mountains of the island. Most of them collect large amounts of water from the surrounding mountains, so the typical soil cover of the plateau is alluvium. The geology of the area consists mainly of carbonate rocks (limestones, dolomites and marbles), which expedite water penetration, forming significant karstic formations (Nikolaidis et al. Citation2013). The whole island is covered by carbonate rocks at more than 30% (the total karstic area is about 2730 km2).
The agricultural land of the island is about 2550 km2 and covers around 30% of the whole area of the island, while pasture occupies about 3800 km2 (45% of the area). The irrigated area in Heraklion is about 600 km2, with about 300 km2 in Lasithi and Chania, while in Rethymno only a limited area is irrigated (Statistics of Agriculture of Greece Citation2005, Malagó et al. Citation2016).
2.2 The Karst-SWAT model
The SWAT model, amended by a karst-flow model, Karst, and referred to as the Karst-SWAT (or KSWAT) model, as developed by Nikolaidis et al. (Citation2013) and Malagó et al. (Citation2016), was used in this study. The use of Karst-SWAT was mandatory for simulating the flow originating from karstic springs throughout the island of Crete, as the SWAT model alone does not allow the simulation of complex hydrogeological settings. Thus, the SWAT model was implemented on the island, simulating surface hydrological processes, such as snow accumulation and snowmelt, surface runoff, infiltration to shallow groundwater and evapotranspiration, while the Karst-SWAT model was implemented only for the karstic regions. The deep aquifer recharge variable (DA_RCHRG) of the neighbouring sub-basins (given by the SWAT model) was used as input in a two-part reservoir model, described in detail in Nikolaidis et al. (Citation2013) and Malagó et al. (Citation2016). After calibration and validation, Malagó et al. (Citation2016) used the Karst-SWAT model to quantify the water balance of Crete. The island was divided into 352 sub-basins and resulted in 502 hydrologic response units (HRUs), which are areas with the same combination of soil, land use and land slope, on which the soil water balance is based. The same model structure used by Malagó et al. (Citation2016) for Crete was used for this study.
The input data for the set-up of the model (see also Malagó et al. Citation2016) are as follows:
A 25-m pixel size digital elevation model (DEM) (Bashfield and Keim Citation2011), obtained from the pan-European elevation data at 1 arc-second, was used to delineate the sub-basins (EU-DEMFootnote1 ). Specific areas were not included in the delineation, i.e. peripheral coastal areas, which occupy about the 19% of the island area (1570 km2).
A land cover map was compiled from a 1-km raster map by combining data from CAPRI (Britz Citation2004), the Center for Sustainability and the Global Environment (SAGE) (Monfreda et al. Citation2008), the History Database of the Global Environment (HYDE 3) (Klein and van Drecht Citation2006) and GLC (Bartholome and Belward Citation2005). The land-use types were obtained from Statistics of Agriculture of Greece (Citation2005). For the reduction of the model computational time, the “dominant land cover approach” was followed and six land-use classes were determined: arable land, pasture, forest, olives, water, and range grasses.
A soil type map was constructed with a 1-km soil raster map, available from the Harmonized World Soil Database (HWSD) (FAO Citation2008). For the accurate representation of the water balance at the regional scale, karstic sub-basins were defined (Malagó et al. Citation2016).
Daily precipitation data from 69 stations, along with daily temperature data from 21 stations, within the 1961–2009 period (provided by the Decentralized Administration of the Region of CreteFootnote2 ), were used in this study. Data from 22 streamflow gauging stations (covering the 1980–2009 period – at a monthly time step) and 47 spring gauging stations (covering the 1983–2005 period – daily time step) () along with actual irrigation data from the shallow and deep aquifer, were used for model calibration, as described in Malagó et al. (Citation2016). The steps that were followed are: (i) recognition of the karstic sub-basins in which the Karst-SWAT model was implemented; (ii) streamflow calibration at the selected stream gauges (step-wise calibration; Pagliero et al. Citation2015); (iii) regionalization of the calibrated parameters to the sub-basins for which field data were not available (ungauged sub-basins); (iv) calibration of the spring flows with the Karst-SWAT model; and (v) introduction of the calibrated spring flows as point sources in the SWAT model. As mentioned, the modified SWAT model (Karst-SWAT) was only applied in the karstic sub-basins, which were defined as the ones having one of the three soil types that are related to karstic areas, i.e. leptosols (European Soil Portal Citation2014).
Fifteen of the streamflow stations were used for calibration, providing a calibrated Near Optimal Parameters (NOP) set for the 1980–2009 period. The remaining seven streamflow stations were used for validation over the same period. The NOP set of calibrated sub-basins, or “donors”, was transferred to the ungauged sub-basins using the hydrological similarity approach (Malagó et al. Citation2016), with the use of the partial least squares regression (PLSR), which allowed us to identify similar sub-basins based on correlation between the watershed and discharge characteristics.
The SWAT variable DA_RCHRG was used for the calibration of springs. By adjusting this variable and by changing the Karst-SWAT model parameters (described in detail in Nikolaidis et al. Citation2013), the calibration of springs was possible. After the spring flows were added in SWAT, the whole set-up was validated (second and final validation for all stations).
The goodness of fit of the streamflow and spring flow was tested by comparing field and simulated flow data for the 1983–2009 period. To test the model performance, the normalized root mean square error (NRMSE), the Nash-Sutcliffe efficiency coefficient (NSE; Nash and Sutcliffe Citation1970), the percent bias (PBIAS; Gupta et al. Citation1999), and the coefficient of determination (r2) multiplied by the slope of the regression line between modelled and real values, i.e. br2 (Krause et al. Citation2005, Bennett et al. Citation2013), were calculated. For most of the calibrated gauging streamflow stations and the calibrated springs, the statistical indices were satisfactory (Moriasi et al. Citation2007), and for the cases that they were not, the comparison of hydrographs indicated that the calibrated model was capable of accurately depicting the monthly flow variations for long time periods (see Malagó et al. Citation2016 for a detailed description).
The management practices of the crops were planting, fertilization, irrigation and harvesting. In the initial set-up of Malagó et al. (Citation2016), manual irrigation was applied with fixed water amounts for each irrigated HRU (provided by the Statistics of Agriculture of Greece Citation2005). The abstractions were derived from the aquifer (shallow and/or deep) (according to the Statistics of Agriculture of Greece Citation2005), or from a source outside the watershed. The latter concerns the water abstracted for irrigation from springs. It was considered as a source outside the watershed boundaries, and the specific abstractions were then subtracted from the DA_RCHRG, outside the SWAT model. The Penman-Monteith method was used for the calculation of evapotranspiration. In this study, the rainfall data were updated, corrected (as, initially, some of them resulted from infilling although observed data were available) and infilled so that continuous time series were available for the reference period. The model was further run using input derived by climate models until 2098.
2.3 Climate model data
2.3.1 Selection of climate models
The selection of the climate models for driving the Karst-SWAT model was based on the best information available in terms on the level of spatial detail and on the ability of models to represent a wide range of potential future climates. A sub-set of representative simulations was selected from the most recent high-resolution (12.5 km) regional climate model (RCM) ensemble, the EURO-CORDEX (Jacob et al. Citation2014) (EUR-11) for a range of potential future climate scenarios. The regional simulations are downscaling the CMIP5 global climate projections (Taylor et al. Citation2012) and the representative concentration pathways (RCPs) (Moss et al. Citation2010, van Vuuren et al. Citation2011). According to the availability of the regional climate model simulations, five EUR-11 models were selected based on three criteria: (a) the range of driving global climate models (GCMs) (RCMs are largely influenced by the driving GCM); (b) the variety of institutions developing the RCMs in terms of different model genealogy; and (c) the range of climate change signals in terms of wet/dry and cold/warm responses. Based on these criteria and the methodology developed by Mendlik and Gobiet (Citation2016), we used the same set of models used in the study of Koutroulis et al. (Citation2016), for the assessment of climate impacts on water availability at specific levels of global warming. Furthermore, the same sub-sampling technique was used to select the models as used in Jacob et al. (Citation2018) to assess the cross-sectoral impacts of 1.5ºC of global warming at a pan-European scale. The driving realizations of GCMs were the EC-EARTH-r1, EC-EARTH-r12, IPSL-CM5A-MR-r1, HadGEM2-ES-r1 and MPI-ESM-LR-r1, and the RCMs were the KNMI-RACMO22E, SMHI-RCA4, IPSL-INERIS-WRF331F, SMHI-RCA4 and CSC-REMO. The EURO-CORDEX scenario simulations use the representative concentration pathways (RCPs) defined for the Fifth Assessment Report of the IPCC, i.e. RCP2.6, RCP4.5 and RCP8.5 (Moss et al. Citation2010, O’Neill et al. Citation2013). The EUR-11 CORDEX RCMs used in the present study are listed in the Supplementary material (Table S1), along with information on the driving GMCs and their availability regarding the simulations under the three climate scenarios.
The scenario of the RCP2.6 emission pathway leads to very low greenhouse gas concentration levels. It is described as a peak-and-decline scenario, in which the radiative forcing level first reaches a value of around 3.1 W/m2 by mid-century and then returns to 2.6 W/m2 by 2100 (van Vuuren et al. Citation2007). The RCP4.5 scenario represents a stabilization scenario, in which the radiative forcing is stabilized just after 2100, without overshooting the long-run radiative forcing target level (Wise et al. Citation2009). Finally, the RCP 8.5 scenario represents increasing greenhouse gas emissions over time (Riahi et al. Citation2007).
The Karst-SWAT model was run for all 11 scenarios (five RCM runs for two RCP2.6, five RCP4.5 and four RCP8.5 – see Supplementary material, Table S1). The 1980–2019 period served as a reference period and future projection periods were divided into two sub-periods for comparison: 2020–2058 and 2060–2098. The Karst-SWAT model was run under the RCM simulations for the historical period, and the reference for each RCM was run for the future periods. The results of the simulations are presented in Section 3.2.
2.3.2 Adjustment of biases
While each successor climate model generation has provided new improvements to the physical representation of the climate system (Koutroulis et al. Citation2016), the modelled variables still contain deviations compared to the respective historical climatology. Due to the presence of such biases, these data cannot directly be used in impact models (Christensen et al. Citation2008, Haerter et al. Citation2011). In the case of hydrological climate change impact studies, it has been found that the use of raw climate model data can derive unrealistic results (Hansen et al. Citation2006, Sharma et al. Citation2007, Harding et al. Citation2014). In this study, the RCM simulated temperature and precipitation data were adjusted for biases against a 30-year period (1980–2009) that served as a reference for the correction. Daily data from 69 precipitation and 21 temperature stations provided the observations for the correction.
For the precipitation, the quantile mapping methodology Multi-segment Statistical Bias Correction (MSBC) was used (Grillakis et al. Citation2013). The method considers discrete segments of the cumulative density function space and applies quantile-mapping correction in each segment individually. Temperature was adjusted using a variant of the aforementioned methodology, modified to use linear transfer functions for the correction instead of the gamma functions used in the original one. The long-term statistics of the climate-modelled temperature were preserved, following the methodology described by Grillakis et al. (Citation2017). This approach ensures that the adjustment of the temperature biases will not lead to unrealistic changes in the future projected temperature. Maraun (Citation2016) discussed the usefulness of trend preservation in the bias correction. Adjusted data using this methodology have been used in a number of studies (Koutroulis et al. Citation2015, Daliakopoulos et al. Citation2016, Grillakis et al. Citation2016, Papadimitriou et al. Citation2016, Citation2017). A comprehensive analysis of these methodologies, comparing them to others, can be found in the Bias Correction Intercomparison Project (BCIP) (Nikulin et al. Citation2015). Maraun et al. (Citation2010) and Themeßl et al. (Citation2012) discuss the advantages and the disadvantages of the quantile mapping-based methods in comparison to others. An example of applying the multi-segment correction methodology is provided in Grillakis et al. (Citation2013). It has to be noted here that the correction of the RCM data was performed using point observations, hence the correction procedure also served for the parameter downscaling. Fang et al. (Citation2015) show that quantile mapping methods outperform other methods in downscaling meteorological variables for hydrological impact studies when the hydrologic results are analysed by frequency-based indices, which is the case of this study.
2.4 Management of irrigation and the water exploitation index (WEI)
A main objective of this study was the realistic simulation of the hydrology of Crete for the 2010–2098 period, along with an estimation of the future demands for irrigation water. As far as the irrigation management is concerned, the model was initially set up following the reasoning that specific amounts of water are drawn from specific HRUs, from the shallow or the deep aquifer, from a source outside the basin, or from a combination of these, in order to irrigate certain HRU areas (Malagó et al. Citation2016). However, for the realistic simulation of future scenarios, the irrigation needs should vary in time according to the water demand of crops. To achieve this goal, changes related to crop management were applied on the existing Karst-SWAT model (Malagó et al. Citation2016).
To simulate climate change scenarios, it was assumed that only the agricultural needs will be affected due to changes in the climate, not taking into account the needs due either to changes in population or to changes in economic activities (tourism, agriculture/livestock sector). For the purposes of quantifying future water demand, the historical time series were simulated again using the “auto-irrigation” function of the model, based upon the soil water content in the plant root zone. In this management approach, irrigation is triggered by a user-defined soil water deficit threshold, calculated as the difference between field capacity and soil water content (in mm) of water. Once triggered, irrigation is applied at a user-defined amount (Neitsch et al. Citation2011). The same amounts of irrigated water for each sub-basin as in the actual irrigation case are maintained, without any effect on the goodness of fit in the resulting simulations. This was achieved with the calibration of irrigation, by altering the values of the variable for Water Stress Threshold, AUTO_WSTR, which represents the soil water deficit below field capacity, along with the amount of irrigation water applied each time auto-irrigation is triggered. The model automatically applied water to the HRU, any time the water content of the soil profile fell below the field capacity (FC) minus AUTO_WSTR.
Each crop was programmed to have the following management practices: planting, fertilization, irrigation and harvesting. The daily heat unit concept was used to implement the timing for the sowing and harvesting of the plant. The heat units that correspond to each crop were available from Bouraoui and Aloe (Citation2007), who calculated them with the use of the Potential Heat Units program. All management operations begin with the planting practice, based on specific heat units, and the remaining practices follow according to their specified heat units. The period ends with the harvest practice. The auto-irrigation method is only applied during the crop period on simulated crops that are irrigated (i.e. olives, tomatoes, potatoes, citrus trees, vineyards, oats, onions, sorghum hay, spring wheat, spring barley, carrots, green beans, grain sorghum, almonds), thus providing a realistic simulation.
The results from both scenarios (observed values given by Malagó et al. Citation2016 and results of the auto-irrigation set-up) were compared for the 1980–2004 period (calibration period) and validated for the 2005–2010 period (validation period). Using this methodology, the irrigation amounts were controlled by the total simulated hydrology system and fluctuated with it. Additionally, this module gives the model the ability to investigate possible future shifts in management and irrigation time periods during future time windows. Transient simulations based on the climate model outputs were run using this updated version of SWAT. Analysis of the results aimed to identify potential trends in temperature, actual evapotranspiration, precipitation, surface flow and flow in springs, and the required volume of irrigation water.
Through the introduction of the auto-irrigation function in the SWAT model, it was possible to draw conclusions about the water requirements in the future years. These amounts may, however, be restricted by the availability of water in the aquifer if the need for irrigation is increased. In order to estimate the potential irrigation in the future, a third set-up of the model was considered, in which the auto-irrigation function was used again, but considering now that the irrigated water was derived from an unlimited source located outside the watershed. This was referred to as the ‘ideal irrigation” set-up. The results of the previous set-up were compared with those of the ideal irrigation set-up so as to draw conclusions about the frequency with which the available water from the shallow and deep aquifer is insufficient for irrigation needs and to quantify the irrigation water deficit.
To investigate the water shortage in Crete, the water exploitation index (WEI), which is a widely accepted index especially for the Mediterranean region, was used. The WEI is defined as the total water abstraction for each use compared to the long-term annual average of the available freshwater resources (%) (EEA Citation2005). The “warning” threshold, which distinguishes a region under pressure (lack of water) from one that is not, is 20%, while severe water shortages occur when WEI > 40%. The latter suggests strong competition for water without there always being enough irrigation capacity, causing frequent water crises. Some experts consider the 40% threshold to be a very low one, and that water resources could undergo more intensive use, up to a threshold of 60%, whereas others believe that freshwater systems cannot withstand being used as intensively as indicated by a WEI value higher than 40% (Alcamo et al. Citation2000). For the case of Crete, in this study, the WEI was calculated per hydrological basin (i.e. for each separate stream network; the number of hydrological basins is equal to the flow exits into the sea). It was considered that the abstractions for drinking water will be constant in the future and the annual average of available freshwater resources and abstractions for irrigation was calculated for the reference period (1980–2009), as well as for two future periods (2020–2059 and 2060–2098) for the three characteristic future scenarios selected.
3 Results
3.1 Auto-irrigation calibration and validation
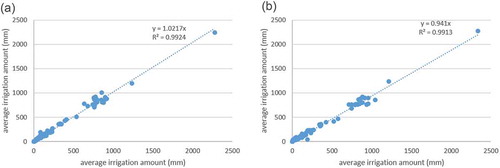
The irrigated water amounts per HRU obtained from observed data (which correspond to the values used by Malagó et al. Citation2016), were compared with those obtained by the set-up using the auto-irrigation function. The results are presented in and () (calibration and validation periods, respectively). It can be seen from that the regression coefficients and slope of the curves are close to 1, suggesting excellent agreement. In the context of investigating the results of the Karst model with auto-irrigation function, the yields of the irrigated crops produced by the initial model of Malagó et al. (Citation2016) were compared with those obtained by the model with the auto-irrigation function (there were no observed crop yields available). For the crop types simulated, the average annual crop yield values and their range for the whole island of Crete, irrespective of their location and elevation, were compared for the two model versions. It was observed that both models produce crop yields with the same trends; however, in the case of the model with the auto-irrigation function, a higher produced yield is obtained (i.e. +30% for olives), on average, and the largest deviations are observed, as expected, during the dry years.
Figure 2. Goodness of fit of average irrigation amounts (mm) for the 502 HRUs between the observed values (Malagó et al. Citation2016) (x-axis) and the new set-up using the auto-irrigation function (y-axis) for: (a) 1980–2004 (calibration) and (b) 2005–2010 (validation).
3.2 Overview of results
The results of the Karst-SWAT model for temperature, precipitation, evapotranspiration, surface and karstic flow, and irrigation water amount, under the 11 possible climate change scenarios, were aggregated to annual values and the mean and standard deviation of the 11 scenarios for each year were calculated (see Supplementary material, Figs. S1–S6). The trend observed in temperature and quantity of irrigated water is projected to be continuously increasing, while the trend in precipitation and flow (surface and springs) is decreasing, with the greatest decrease occurring after 2060. As stated in the previous sections, based on the observed trends, the future period (2020–2098) was divided into two sub-periods of about 40 years each (2020–2059 and 2060–2098), and mean variables were calculated and compared for these two periods and for the current period of reference (1980–2009).
In this first approach, which concerns the overall view of scenarios when comparing average values of 40-year periods to the 30-year reference period (1980–2009), precipitation, surface and springs flow show a constant to slightly increasing trend up to 2059. In terms of percentages, from 2060 onwards, the decrease in these variables is eminent, around 10%, 24.2% and 16.5% respectively, when compared to the 1980–2009 reference period. Temperature is projected to continuously increase, but at a lower rate. The amount of irrigation demand increases after 2020 (5.1% compared to the 1980–2009 period) and continues with a slighter increase after 2060 (3.5% compared to the 1980–2009 period). Actual evapotranspiration shows no significant differences when comparing these periods, as it is a variable which is influenced by both temperature and precipitation, and is eventually balanced (see Supplementary material, Table S2).
The overall picture presented by the climate change scenarios for Crete is a temperature increase for future years until 2098 and a decrease in precipitation from 2060 onwards. All scenarios suggest the same outcome (with the exception of the CSC-REMO model under RCP2.6, which simulates a 5% precipitation increase). The decrease in precipitation (mean: 6290 hm3 or 943 mm) varies from 4.5% to 28.2% (decrease ranging from 280 hm3/42 mm to 1810 hm3/271.3 mm) for the different scenarios when the reference period (1980–2009) is compared to the last 40 years of the climate projection (2060–2098), whereas the increase in mean temperature (16.1°C) varies from 0.7 to 3.1°C when comparing the same periods.
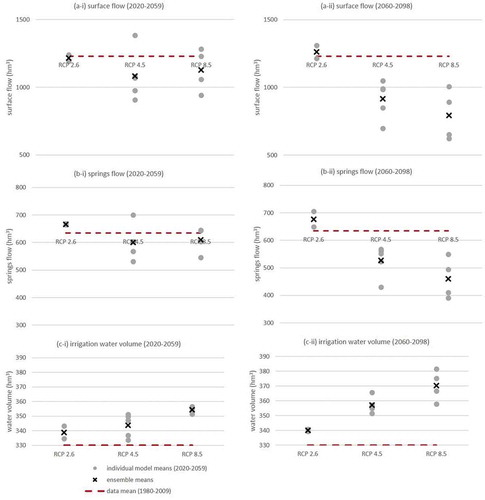
These changes in precipitation and temperature will cause corresponding changes in hydrological variables, such as surface and spring flow, and the amount of irrigated water. Specifically, as for the case of precipitation, for the 2020–2059 period, the results of flow vary depending on the scenario, but, for the 2060–2098 period, almost all scenarios foresee reduction of the average spring flows into the basin (mean: 635 hm3/95.2 mm) from 1.5% to 32.1% (9.5 hm3/1.42 mm to 204 hm3/30.58 mm) and of surface flow (mean: 1060 hm3/158.9 mm) from 2.1% to 38.2% (22 hm3/3.3 mm to 405 hm3/60.7 mm) (comparison between the 1980–2009 and 2060–2098 periods).
As far as the irrigated water amount is concerned, it is expected to continuously increase for the next years (following the temperature pattern); specifically, when comparing the periods 1980–2009 and 2060–2098, the mean annual water amount intended for irrigation (mean: 330 hm3 or 275 mm considering the area of the island which is irrigated) is expected to increase from 2.6% to 15.3% (8.5 hm3/7.3 mm to 49.8 hm3/41.5 mm) under all scenarios.
and depict the mean for every single climate model and for every variable under study, along with the mean for the reference period (1980–2009) and the mean of each model ensemble. In order to portray the most characteristic potential hydrological states of the island and present the results more efficiently, we decided to focus on three climate change scenarios which represent the spectrum of the future hydrological conditions on the island. For this selection, one scenario for each RCP was necessary: one from RCP2.6 (ambitious mitigation scenario, with emissions peaking early in the century – around 2020, then rapidly declining), one from RCP4.5 (emissions peaking around mid-century, then declining rapidly over 30 years and finally stabilizing), and one from RCP8.5 (emissions continuing to increase rapidly through the early and middle parts of the century). The selection was based on the changes in temperature, precipitation and flow rates projected for the future 40-year periods, so that the selected scenarios were representative of the mean changes portrayed by each RCP (as shown in and ). The closest scenario to the mean of the ensemble’s variables (temperature, precipitation and flow) was the CSC-REMO, which is a high-resolution and long-term model that shows good performance for both temperature and precipitation in the Mediterranean region (Jacob et al. Citation2012). Thus the scenario of choice was the CSC-REMO under the “favorable” RCP2.6, the “intermediate” RCP4.5, and the “adverse” RCP8.5. (The accumulated results for these three characteristic climate change scenarios – “favorable”, “intermediate” and “adverse” – are summarized in the Supplementary material, Fig. S7.) The mean annual rainfall is expected to decrease in the “intermediate” and “adverse” scenarios, with a simultaneous increase in the evapotranspiration and, therefore, the irrigation needs are expected to increase. In particular, rainfall reduction is expected to be as high as 27.3% compared to the the reference rainfall (1980–2009), with an increase of up to 12% in irrigation and a reduction in total discharge of springs and rivers of up to 38% after 2060 for the case of the “adverse” scenario (Supplementary material, Fig. S7). The water deficit due to irrigation is estimated to increase from 7 hm3 in the current conditions (1980–2009) to 17–22 hm3 in the 2020–2059 period and 17–48 hm3 in the 2060–2098 period. With regard to the “favorable” scenario, the rainfall is not expected to change significantly, but water loss due to evapotranspiration is expected to increase along with irrigation needs. The irrigation water deficit, even in this case, is expected to increase to over 100% compared to the reference (1980–2009) deficit (see Supplementary material, Fig. S7).
Figure 3. Variation of mean values of (a) temperature, (b) precipitation and (c) actual evapotranspiration for Crete, for each climate scenario and for each ensemble: (i) 2020–2059 and (ii) 2060–2098. The dashed line represents the mean value of the reference period (1980–2009).
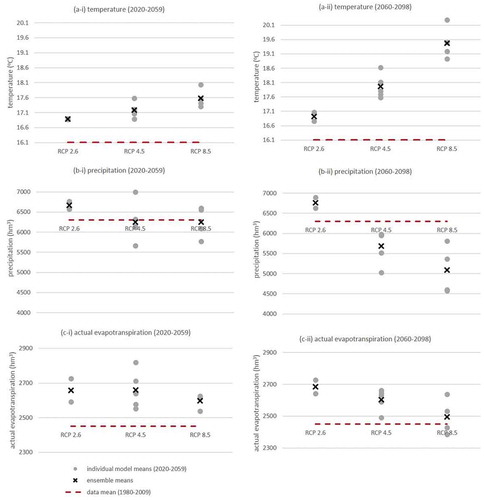
Figure 4. Variation of mean values of (a) surface flow, (b) spring flow and (c) irrigation water volume for Crete, for each climate scenario and for each ensemble: (i) 2020–2059 and (ii) 2060–2098. The dashed line represents the mean value of the reference period (1980–2009).
3.3 Water exploitation index (WEI)
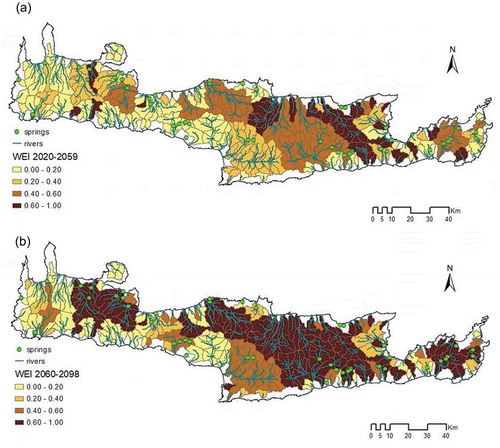
The WEI for the reference (1980–2009) period is presented in . The water stress in the region expressed in terms of the WEI for the 2020–2059 and 2060–2098 periods and the “adverse” climatic scenario (CSC-REMO under RCP8.5) is shown in . Already by the 2020–2059 period, an increase in water stress is projected for the prefecture of Heraklion, which moves on to the next “risk grade” in terms of WEI. For the 2060–2098 period, the WEI is over the limit of 0.6 in basins that occupy half of Crete all together. Almost the whole of the Heraklion prefecture and the largest part of the Lasithi prefecture are expected to have irrigation issues, while basins with no deficiencies until 2009 are expected to exceed the 0.6 limit.
Figure 5. Water exploitation index (WEI) values for the basins of Crete for the reference period, 1980–2009.
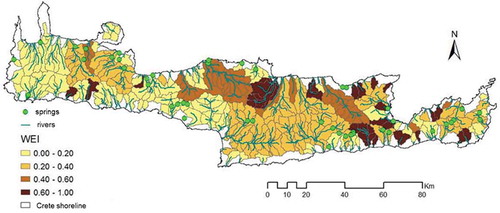
Figure 6. WEI for the basins of Crete for the “adverse” scenario, CSC-REMO under RCP8.5 for: (a) 2020–2059 and (b) 2060–2098.
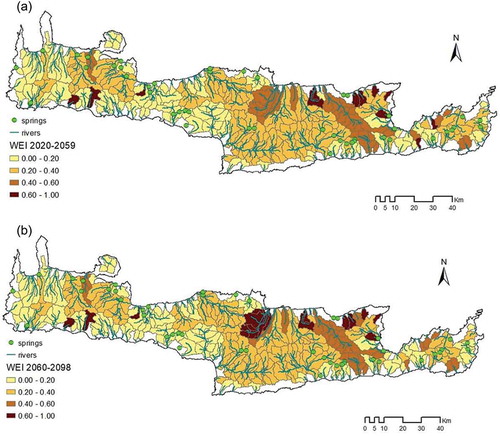
The WEI results were also tested for a scenario that, unlike the majority, predicted an increase in flow rates, i.e. the CSC-REMO under the RCP2.6 scenario (). This scenario suggests stable and slightly increasing rainfall over the next few years, so the spatial distribution of WEI is similar to the current situation for the two future 40-year periods (2020–2059 and 2060–2098).
Figure 7. WEI for the basins of Crete for the “favourable” scenario, CSC-REMO under RCP2.6 for: (a) 2020–2059 and (b) 2060–2098.
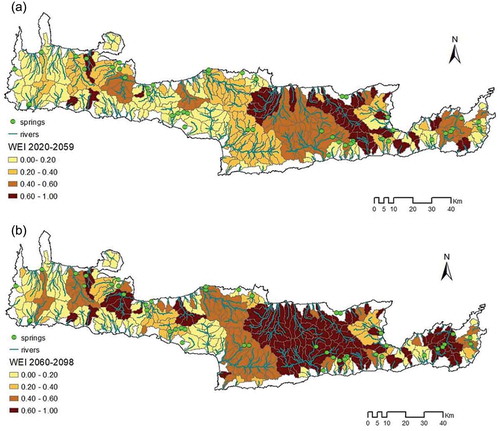
Even for an “intermediate” scenario, such as the CSC-REMO under the RCP4.5, for the period 2060–2098, high water-stress conditions are expected for the exploitation of water for the majority of Heraklion and Lasithi areas (). It is noted that even for an intermediate scenario, water availability will be under considerable pressure for a large part of the island.
Figure 8. WEI for the basins of Crete for the “intermediate” scenario, CSC-REMO under RCP4.5 for: (a) 2020–2059 and (b) 2060–2098.
3.4 Water deficit
Quantification of the deficit of water intended for irrigation was possible by comparing the results of the two Karst-SWAT model set-ups, i.e. the Karst-SWAT model combined with the auto-irrigation function where the irrigation water is derived from: (1) the shallow and deep aquifer and, and (2) an unlimited source (“ideal irrigation”) (Section 2.4). The results for the water deficit for the 11 climate scenarios along with the percentage of the average annual future deficit on the current average irrigation in Crete (330 hm3 or 276 mm for the 1980–2009 period) and the number of years in which the deficit is present (frequency) are depicted in .
Table 1. Projected number of years with irrigation water shortage in the period 2060–2098 (40 years), average annual deficit over the 40-year period and proportion of average annual future deficit (2060–2098) compared to the average irrigation amount of 330 hm3 in Crete for the reference period (1980–2009).
It is observed that for each scenario, a shortage of irrigation water is projected in over half of the future years (). The variation in the average annual irrigation deficit (26.5 hm3) is between 15.1 and 51.5 hm3/year. Regarding the three scenarios of the REMO class, “favorable”, “adverse” and “intermediate” (CSC-REMO run for RCP2.6, RCP4.5 and RCP8.5), for the 2060–2098 period, a more intense change in variable values is observed. From year 2075 onwards, the average annual deficit for the “favorable”, “adverse” and “intermediate” scenarios is estimated as 16.2, 67.3 and 30.3 hm3, respectively, i.e. the deficit would be 4.89%, 20.23% and 9.12%, respectively, on the average annual irrigation quantity, depending on the scenario implemented. Specifically for the “adverse” scenario, after 2075, the deficit rises annually at a high rate (see Supplementary material, Fig. S8). The fact that even for the “intermediate” scenario, the deficit is very high after 2060 (34 years in 39 years) is of great interest. Also, even for the “intermediate” scenario, a maximum annual deficit of around 100 hm3 (30% of the average annual irrigation quantity) is presented.
4 Discussion and conclusions
The Karst-SWAT model was successfully used to assess the impact of climate change on the hydrological conditions of Crete. The current state of Crete for the simulation period of 1980–2009 (reference period) is described by a mean annual temperature of 16.1°C, mean annual rainfall of 6290 hm3, mean annual surface flow of 1230 hm3, mean annual karstic springs flow of 635 hm3 and mean annual irrigation water amount of 330 hm3 with a mean annual water deficit of 7 hm3. According to the 11 climate change scenarios simulated, which constitute a representative ensemble, the climate change impact on the island covers a bandwidth which mainly suggests aggravation of the water stress, especially after 2060 (2060–2098 period). More specifically, the increase in temperature (range: 0.7 to 3.1°C; average: 2.2°C) along with the decrease in rainfall (range: 280–1810 hm3; average: 10% decrease) are expected to result in a decrease in flow of karstic springs (range: 9.5–204 hm3, mean: 16.5%) and a decrease in surface flow (range: 22–405 hm3; average: 24.2%). Hartmann et al. (Citation2012), evaluated the impacts of climate change of the Eastern Mediterranean and predicted that for the future period 2068–2098, a decrease in water availability of 15–30% is expected for a large karstic spring under five different realizations of the A1B ECHAM5 and HadCM3 climate models. These results match the results of this study, as the mean decrease of the spring flow is 16.5% and the maximum predicted decrease is 204 hm3 or 32.1%. Pascual et al. (Citation2015) also performed a combination of hydrological modelling and climate projections, with B1 and A2 IPCC emissions scenarios, on water resources in three medium-sized catchments in the Mediterranean region (Spain) and ended up in similar assessments: a large reduction of 34% in mean streamflows (for 2076–2100) is expected for wet catchments, while lower decreases (25% of mean value for 2076–2100) are expected for the drier catchment. Based on the “auto-irrigation” assessment, which takes soil water content into consideration for the provision of irrigation, the irrigation water amount is expected to increase in the range of 8.5 to 49.8 hm3 (mean: 8.7%) and, in combination with the decrease in available water resources, will lead to an increased water deficit ranging from 15.1 to 51.5 hm3. Fader et al. (Citation2016) assessed how climate change and increases in atmospheric CO2 concentrations may affect irrigation requirements in the Mediterranean region by 2080–2090. According to their research, the Mediterranean area may face an increase in gross irrigation requirements between 4 and 18% from climate change alone. These findings are consistent with those of our study, where the mean irrigation water amount is projected to increase by 8.7%. The WEI also forecast significant water stress for a large part of the island for the 2060–2098 period under both the “adverse” and “intermediate” scenarios.
The simulation of the climate change projections for the island of Crete along with the assessment of the water exploitation index (WEI), suggest that water stress is expected to increase, and significant pressure will be exerted on many areas of the island that until now were marginally on the warning limits. The fact that precipitation in the Mediterranean is more likely to undergo the RCP8.5 (“adverse”) scenario (Stocker et al. Citation2013) renders the future status critical for the Cretan hydrology and water resources. The aforementioned areas are located near existing dams, or those under construction, and the possibility of “relieving” the pressures through these dams should be taken into consideration. Milano et al. (Citation2013) estimated the water stress for the Mediterranean region by the 2050s using two scenarios: first, a business-as-usual scenario, where present efficiencies of networks and irrigated plots remain constant, and a second scenario, according to which the performance of distribution networks and the water efficiency, regarding irrigation, are improved, based on the objectives of the Mediterranean Strategy for Sustainable Development (MSSD; UNEP–MAP Citation2006). They stated that the situation of Mediterranean water stress is expected to have deteriorated by 2050 under the first scenario. The Mediterranean basin is expected to be under high to severe water stress and catchments that are under severe water stress at present will remain as they are (e.g. Crete). Catchments which are now under moderate water stress (e.g. in Greece) are likely to be under high water stress in the future. However, in the case of the second scenario, for western Greece, low to moderately water-stressed catchments are expected to become moderate to high water-stressed, respectively. According to the simulations and predictions of Milano et al. (Citation2013), Crete is under very high water stress at present and is expected to remain so by 2050 under both scenarios tested.
The maximum annual potential deficit, as estimated in this study from the 11 scenarios of climate change, is 120 hm3. Addressing a shortage of this magnitude implies that significant changes are needed in the management of Crete’s water reserves, taking into account the fact that this deficit will be accompanied by a significant reduction in rainfall and runoff to the island’s springs and rivers. Given the current water demand of 413 hm3/year, of which 80% is consumed by the agricultural sector (330 hm3/year) (Viola et al. Citation2014), there is an imperative need to investigate the options for covering the future water shortage in terms of crop irrigation.
The water demand in Crete is covered mainly by the exploitation of groundwater (wells and springs) and surface water. According to the River Basin Management Plan of the Water Department of Crete (GR13) (Special Water Secretariat of Greece Citation2015) about 12 000 groundwater wells currently operate in the region of Crete, exploiting the underground water potential and the runoff of the springs. In addition to this, dams and reservoirs with a capacity of 102 hm3 have been constructed, while at the same time there are plans for corresponding projects of a similar capacity (99 hm3) to be built. From the current installed capacity of the water supply projects on the island, a very low percentage of approx. 40.8% (41.62 hm3/year), i.e. about 8.6% of the total consumption, is exploited annually (Nikolaidis et al. Citation2016). Consequently, future deficits based on climate change scenarios can be covered by the reduction of water losses from water supply and irrigation networks, the rational use of irrigation water (e.g. deficit irrigation) and more intensive exploitation of installed storage facilities.
It should also be noted that all climate change scenarios did not take into account the needs, either due to changes in population or changes in economic activities (tourism, agriculture/livestock sector) that could affect demand. The analysis, therefore, does not involve a change in the socio-economic situation of the island. The strategic planning of Crete’s development should also take into account the changes in water supply and irrigation needs as these are shaped in the light of climate change.
Several studies have expressed reservations regarding the adequacy of the CMIP5 models to describe precipitation and atmospheric circulation (Deser et al. Citation2017, Zappa and Shepherd Citation2017, Trenberth et al. Citation2017). However, Kelley et al. (Citation2012) used the global climate models from the CMIP5 collection, particularly for the Mediterranean region and showed that the Mediterranean precipitation climatology is generally well simulated in both spatial pattern and seasonal cycle. An estimate of the observed externally forced trend shows that winter drying dominates in observations but the spatial patterns are similar to the multi-model mean trend. The similarity is particularly robust in the eastern Mediterranean region.
In this study, the climate data were bias-corrected, as it has been found that the use of raw climate model data can derive unrealistic results (Hansen et al. Citation2006, Sharma et al. Citation2007, Harding et al. Citation2014). In some recent studies, however, it has been shown that bias-reduction techniques might have adverse effects (Chen et al. Citation2018) and might introduce bias in other scales (Sunyer et al. Citation2015, Hanel et al. Citation2017). The classical approach of bias correction was used in this study; however, this topic needs further research. In addition, Joseph et al. (Citation2018), state that there is no added value in hydrological simulations by rigorous hydrological calibration and parameterization, as the forcing meteorological data has large uncertainty. The scientific discussion about whether climate models are capable of providing realistic estimates of precipitation is under way. However, our study showed that for an ensemble of 11 RCMs, there is one parameter that is expected to increase regardless of the RCM realized, and that is water deficit, indicating the immediate need for water sustainability measures. The Karst-SWAT model can be used as a tool for foresight analysis, for the determination of water sustainable scenarios for future development, and to assess mitigation options for climate change impacts for the region of Crete and other karstic regions.
Supplemental Material
Download MS Word (557.3 KB)Disclosure statement
No potential conflict of interest was reported by the authors.
Supplementary mterial
Supplemental data for this article can be accessed here.
Additional information
Funding
Notes
1 https://www.eea.europa.eu/data-and-maps/data/eu-dem [Accessed 14 February 2019].
Related Research Data
References
- Aeschbach-Hertig, W. and Gleeson, T., 2012. Regional strategies for the accelerating global problem of groundwater depletion. Nature Geoscience, 5, 853–861. doi:10.1038/ngeo1617
- Alcamo, J., Henrich, T., and Rösch, T., 2000. World water in 2025 – global modeling and scenario analysis for the world commission on water for the 21st century. Germany: Centre for Environmental System Research, University of Kassel, Report A0002.
- Bartholome, E. and Belward, A.S., 2005. GLC2000: A new approach to global land cover mapping from earth observation data. International Journal of Remote Sensing, 26 (9), 1959–1977. doi:10.1080/01431160412331291297
- Bashfield, A. and Keim, A., 2011. Continent-wide DEM creation for the European Union. In: 34th international symposium on remote sensing of the environment, 10–15 April 2011 Sydney, Australia. Available from: http://www.isprs.org/proceedings/2011/isrse-34/211104015Final00143.pdf [Accessed 14 Feb 2019].
- Bennett, N.D., et al., 2013. Characterising performance of environmental models. Environmental Modelling and Software, 40, 1–20. doi:10.1016/j.envsoft.2012.09.011
- Bouraoui, F., and Aloe, A., 2007. European agrochemicals geospatial loss estimator: Model development and applications. EUR – Scientific and Technical Research Series, ISSN 1018-5593. Luxembourg: Office for Official Publications of the European Communities.
- Britz, W., 2004. CAPRI modelling system documentation. Bonn, Germany: University of Bonn, Final Report of the FP5 Shared Cost Project CAP-STRAT, Common Agricultural Policy Strategy for Regions, Agriculture and Trade. QLTR-2000-00394.
- Chen, J., Brissette, F.P., and Chen, H., 2018. Using reanalysis‐driven regional climate model outputs for hydrology modelling. Hydrological Processes, 32 (19), 3019–3031. doi:10.1002/hyp.v32.19
- Christensen, J.H., et al., 2008. On the need for bias correction of regional climate change projections of temperature and precipitation. Geophysical Research Letters, 35, L20709. doi:10.1029/2008GL035694
- Daliakopoulos, I.N., et al., 2016. The threat of soil salinity: A European scale review. Science of the Total Environment, 573, 727–739. doi:10.1016/j.scitotenv.2016.08.177
- Deser, C., Hurrell, J.W., and Phillips, A.S., 2017. The role of the North Atlantic Oscillation in European climate projections. Climate Dynamics, 49, 3141–3157. doi:10.1007/s00382-016-3502-z
- EEA, European Environment Agency, 2005. The European environment – state and outlook 2005. Copenhagen: European Environmental Agency.
- Ertürk, A., et al., 2014. Evaluating the impact of climate change on groundwater resources in a small Mediterranean watershed. Science of the Total Environment, 499, 437–447. doi:10.1016/j.scitotenv.2014.07.001
- European Soil Portal, 2014. Available from: http://eusoils.jrc.ec.europa.eu/ESDB Archive/ESDB/ [ Accessed 26 June 2019].
- Fader, M., et al., 2016. Mediterranean irrigation under climate change: more efficient irrigation needed to compensate for increases in irrigation water requirements. Hydrology and Earth System Sciences, 20, 953–973. doi:10.5194/hess-20-953-2016
- Fang, G.H., et al., 2015. Comparing bias correction methods in downscaling meteorological variables for a hydrologic impact study in an arid area in China. Hydrology and Earth System Sciences, 19, 2547–2559. doi:10.5194/hess-19-2547-2015
- FAO, 2008. Harmonized world soil database (version 1.0). Rome: FAO. Italy and IIASA, Laxenburg, Austria.
- Giorgi, F., 2006. Climate Change Hot-Spots. Geophysical Research Letters, 33, L08707. doi:10.1029/2006GL025734
- Gleick, P., 2014. Water, drought, climate change, and conflict in Syria. Weather, Climate and Society, 6 (3), 331–340. doi:10.1175/WCAS-D-13-00059.1
- Grillakis, M.G., et al., 2016. Climate-induced shifts in global soil temperature regimes. Soil Science, 181, 264–272. doi:10.1097/SS.0000000000000156
- Grillakis, M.G., et al., 2017. A method to preserve trends in quantile mapping bias correction of climate modeled temperature. Earth System Dynamics, 8, 889–900. doi:10.5194/esd-8-889-2017
- Grillakis, M.G., Koutroulis, A.G., and Tsanis, I.K., 2013. Multisegment statistical bias correction of daily GCM precipitation output. Journal of Geophysical Research – Atmosphere, 118, 3150–3162. doi:10.1002/jgrd.50323
- Gupta, H.V., Sorooshian, S., and Yapo, P.O., 1999. Status of automatic calibration for hydrologic models: comparison with multilevel expert calibration. Journal of Hydrologic Engineering, 4 (2), 135–143. doi:10.1061/(ASCE)1084-0699(1999)4:2(135)
- Haerter, J.O., et al., 2011. Climate model bias correction and the role of timescales. Hydrology and Earth System Sciences, 15, 1065–1079. doi:10.5194/hess-15-1065-2011
- Hanel, M., et al., 2017. An R package for assessment of statistical downscaling methods for hydrological climate change impact studies. Environmental Modelling & Software, 95, 22–28. doi:10.1016/j.envsoft.2017.03.036
- Hansen, J.W., et al., 2006. Translating climate forecasts into agricultural terms: advances and challenges. Climate Research, 33, 27–41. doi:10.3354/cr033027
- Harding, R.J., et al., 2014. The future for global water assessment. Journal of Hydrology, 518, 186–193. doi:10.1016/j.jhydrol.2014.05.014
- Hartmann, A., et al., 2012. A multi-model approach for improved simulations of future water availability at a large eastern Mediterranean karst spring. Journal of Hydrology, 468, 130–138. doi:10.1016/j.jhydrol.2012.08.024
- Hartmann, A., et al., 2014. Karst water resources in a changing world: review of hydrological modeling approaches. Review of Geophysics, 52, 218–242. doi:10.1002/2013RG000443
- Hoerling, M., et al., 2012. On the increased frequency of Mediterranean drought. Journal of Climate, 25, 2146–2161. doi:10.1175/JCLI-D-11-00296.1
- Jacob, D., et al., 2012. Assessing the transferability of the regional climate model REMO to Different COordinated Regional Climate Downscaling EXperiment (CORDEX) regions. Atmosphere, 3, 181–199. doi:10.3390/atmos3010181
- Jacob, D., et al., 2014. EURO-CORDEX: new high-resolution climate change projections for European impact research. Regional Environmental Change, 14, 563–578. doi:10.1007/s10113-013-0499-2
- Jacob, D., et al., 2018. Climate impacts in Europe under +1.5°C global warming. Earth’s Future, 6 (2), 264–285. doi:10.1002/2017EF000710
- Joseph, J., et al., 2018. Hydrologic impacts of climate change: comparisons between hydrological parameter uncertainty and climate model uncertainty. Journal of Hydrology, 566, 1–22. doi:10.1016/j.jhydrol.2018.08.080
- Kelley, C.M., et al., 2012. Mediterranean precipitation climatology, seasonal cycle, and trend as simulated by CMIP5. Geophysical Research Letters, 39, L21703. doi:10.1029/2012GL053416
- Kelley, C.P., et al., 2015. Climate change in the Fertile Crescent and implications of the recent Syrian drought. Proceedings of the National Academy of Sciences of the United States of America, 112, 3241–3246. doi:10.1073/pnas.1421533112
- Klein, G.K. and van Drecht, G., 2006. HYDE 3: current and historical population and land cover. In: A.F. Bouwman, T. Kram, and K. Klein Goldewijk, eds. Integrated modeling of global environmental change. an overview of IMAGE 2.4. Bilthoven, The Netherlands: Netherlands Environmental Assessment Agency (MNP), 93–111.
- Kløve, B., et al., 2011. Groundwater dependent ecosystems, Part I: hydroecological status and trends. Environmental Science and Policy, 14, 770–781. doi:10.1016/j.envsci.2011.04.002
- Koutroulis, A.G., et al., 2015. Exploring the ability of current climate information to facilitate local climate services for the water sector. Earth Perspectives, 2 (1), 6. doi:10.1186/s40322-015-0032-5
- Koutroulis, A.G., et al., 2016. Evaluation of precipitation and temperature simulation performance of the CMIP3 and CMIP5 historical experiments. Climate Dynamics, 47 (5–6), 1881–1898. doi:10.1007/s00382-015-2938-x
- Koutroulis, A.G., et al., 2018. Freshwater vulnerability under high end climate change. A pan-European assessment. Science of the Total Environment, 613, 271–286. doi:10.1016/j.scitotenv.2017.09.074
- Krause, P., Boyle, D.P., and Base, F., 2005. Comparison of different efficiency criteria for hydrological model assessment. Advances in Geoscience, 5, 89–97. doi:10.5194/adgeo-5-89-2005
- Malagó, A., et al., 2016. Regional scale hydrologic modelling of a karst-dominant geomorphology: the case study of the island of Crete. Journal of Hydrology, 540, 64–81. doi:10.1016/j.jhydrol.2016.05.061
- Maraun, D., et al., 2010. Precipitation downscaling under climate change: recent developments to bridge the gap between dynamical models and the end user. Reviews of Geophysics, 48, RG3003. doi:10.1029/2009RG000314
- Maraun, D., 2016. Bias Correcting Climate Change Simulations – a critical review. Current Climate Change Reports, 2, 211–220. doi:10.1007/s40641-016-0050-x
- Mariotti, A., 2010. Recent changes in the Mediterranean water cycle. A Pathway toward Long-term Regional Hydroclimatic Change? Journal of Climate, 23, 1513–1525.
- Mendlik, T. and Gobiet, A., 2016. Selecting climate simulations for impact studies based on multivariate patterns of climate change. Climatic Change, 135, 381–393. doi:10.1007/s10584-015-1582-0
- Milano, M., et al., 2013. Current state of Mediterranean water resources and future trends under climatic and anthropogenic changes. Hydrological Sciences Journal, 58 (3), 498–518. doi:10.1080/02626667.2013.774458
- Monfreda, C., Ramankutty, N., and Foley, J., 2008. Farming the planet: 2. Geographic distribution of crop areas, yields, physiological types, and net primary production in the year 2000. Global Biogeochemical Cycles, 22, GB1022. doi:10.1029/2007GB002947
- Moriasi, D.N., et al., 2007. Model evaluation guidelines for systematic quantification of accuracy in watershed simulations. Transactions of the American Society of Agricultural and Biological Engineers, 50, 885–900.
- Moss, R.H., et al., 2010. The next generation of scenarios for climate change research and assessment. Nature, 463, 747–756. doi:10.1038/nature08823
- Nash, J.E. and Sutcliffe, J.V., 1970. River flow forecasting through conceptual models; Part IA discussion of principles. Journal of Hydrology, 10, 282–290. doi:10.1016/0022-1694(70)90255-6
- Neitsch, S.L., et al., 2011. Soil and water assessment tool theoretical documentation version 2009. College Station, TX, USA: Texas Water Resources Institute.
- Nelson, G.C., et al., 2009. Climate change: impact on agriculture and costs of adaptation. Washington, DC: IFPRI.
- Nerantzaki, S.D., et al., 2015. Modeling suspended sediment transport and assessing the impacts of climate change in a Karstic Mediterranean Watershed. Science of the Total Environment, 538, 288–297. doi:10.1016/j.scitotenv.2015.07.092
- Nikolaidis, N.P., et al. 2016. Program of drought measures for the Region of Crete. Innovative solutions to climate change adaptation and governance in the water management of the Region of Crete. Crete, Greece: Aquaman, Report No. 2015ΣΕ07580018. (In Greek). Available from: http://aquaman.tuc.gr [Accessed 25 Mar 2018].
- Nikolaidis, N.P., Bouraoui, F., and Bidoglio, G., 2013. Hydrologic and geochemical modeling of a karstic Mediterranean watershed. Journal of Hydrology, 477, 129–138. doi:10.1016/j.jhydrol.2012.11.018
- Nikulin, G., et al., 2015. Bias Correction Intercomparison Project (BCIP): an introduction and the first results. In: EGU general assembly conference abstracts, 2250, 12 – 17 April 2015, Vienna, Austria.
- Nunes, J.P., Jacinto, R., and Keizer, J.J., 2017. Combined impacts of climate and socio-economic scenarios on irrigation water availability for a dry Mediterranean Reservoir. Science of the Total Environment, 584, 219–233. doi:10.1016/j.scitotenv.2017.01.131
- O’Neill, B.C., et al., 2013. A new scenario framework for climate change research: the concept of shared socioeconomic pathways. Climatic Change, 122, 387–400. doi:10.1007/s10584-013-0905-2
- Pagliero, L., et al., 2015. Large-scale hydrological simulations using the soil water assessment tool, protocol development, and application in the Danube Basin. Journal of Environmental Quality, 43, 145–154. doi:10.2134/jeq2011.0359
- Panwar, S. and Chakrapani, G.J., 2013. Climate change and its influence on groundwater resources. Current Science, 105 (1), 37–46.
- Papadimitriou, L.V., et al., 2016. High-end climate change impact on European runoff and low flows – exploring the effects of forcing biases. Hydrology and Earth System Sciences, 20, 1785–1808. doi:10.5194/hess-20-1785-2016
- Papadimitriou, L.V., et al., 2017. The effect of GCM biases on global runoff simulations of a land surface model. Hydrology and Earth System Sciences Discussions, 1–43. doi:10.5194/hess-2017-208
- Pascual, D., et al., 2015. Impacts of climate change on water resources in the Mediterranean Basin: a case study in Catalonia, Spain. Hydrological Sciences Journal, 60 (12), 2132–2147. doi:10.1080/02626667.2014.947290
- Riahi, K., Grübler, A., and Nakicenovic, N., 2007. Scenarios of long-term socio-economic and environmental development under climate stabilization. Technological Forecasting and Social Change, 74, 887–935. doi:10.1016/j.techfore.2006.05.026
- Romanazzi, A., Gentile, F., and Polemio, M., 2015. Modelling and management of a Mediterranean Karstic coastal aquifer under the effects of seawater intrusion and climate change. Environmental Earth Sciences, 74, 115–128. doi:10.1007/s12665-015-4423-6
- Selby, J., et al., 2017. Climate change and the Syrian Civil war revisited. Political Geography, 60, 232–244. doi:10.1016/j.polgeo.2017.05.007
- Sharma, D., Das Gupta, A., and Babel, M.S., 2007. Spatial disaggregation of bias-corrected GCM precipitation for improved hydrologic simulation: ping River Basin, Thailand. Hydrology and Earth System Sciences Discussions, 11, 1373–1390. doi:10.5194/hess-11-1373-2007
- Special Water Secretariat of Greece, 2015. River Basin management plan of the water department of crete (GR13). Athens, Greece: Water Secretariat of Greece (In Greek). Available from: http://wfdver.ypeka.gr/el/project/gr13-00-approved-legislation-fek-gr/ [Accessed 27 Jun 2019].
- Statistics of Agriculture of Greece, 2005. 46 Pireos St. Eponiton St. 185 10, Piraeus. Available from: http://www.statistics.gr/en/statistics/agr [Accessed 27 Jun 2019].
- Stocker, T.F., et al., 2013. Technical summary. In: Climate change 2013: the physical science basis. Contribution of Working Group I to the Fifth Assessment Report of the Intergovernmental Panel on Climate Change. (T.F. Stocker, et al., Eds.). Cambridge, UK: Cambridge University Press, 33–115. doi:10.1017/CBO9781107415324.005
- Sunyer, M.A., et al., 2015. Inter-comparison of statistical downscaling methods for projection of extreme precipitation in Europe. Hydrology and Earth System Sciences, 19 (4), 1827–1847. doi:10.5194/hess-19-1827-2015
- Taylor, K.E., Stouffer, R.J., and Meehl, G.A., 2012. An overview of CMIP5 and the experiment design. Bulletin of the American Meteorological Society, 93, 485–498. doi:10.1175/BAMS-D-11-00094.1
- Themeßl, M.J., Gobiet, A., and Heinrich, G., 2012. Empirical-statistical downscaling and error correction of regional climate models and its impact on the climate change signal. Climatic Change, 112, 449–468. doi:10.1007/s10584-011-0224-4
- Trenberth, K.E., Zhang, Y., and Gehne, M., 2017. Intermittency in precipitation: duration, frequency, intensity, and amounts using hourly data. Journal of Hydrometeorology, 18, 1393–1412. doi:10.1175/JHM-D-16-0263.1
- Trigo, R.M., Gouveia, C.M., and Barriopedro, D., 2010. The intense 2007–2009 drought in the Fertile Crescent: impacts and associated atmospheric circulation. Agricultural Meteorology, 150 (9), 1245–1257. doi:10.1016/j.agrformet.2010.05.006
- UNEP-MAP (United Nations Environment Programme – Mediterranean Action Plan), 2006. Mediterranean strategy for sustainable development. 68Athens: UNEP-MAP.
- van Vuuren, D.P., et al., 2011. The representative concentration pathways: an overview. Climatic Change, 109 (1), 5–31. doi:10.1007/s10584-011-0148-z
- van Vuuren, D.P., Lucas, P.L., and Hilderink, H., 2007. Downscaling drivers of global environmental change: enabling use of global SRES scenarios at the national and grid levels. Global Environmental Change, 17, 114–130. doi:10.1016/j.gloenvcha.2006.04.004
- Viola, F., et al., 2014. The state of water resources in major Mediterranean islands. Water Resources, 41 (6), 639–648. doi:10.1134/S0097807814060207
- Wada, Y., et al., 2010. Global depletion of groundwater resources. Geophysical Research Letters, 37. doi:10.1029/2010GL044571
- Wise, M., Calvin, K., and Thomson, A., 2009. Implications of limiting CO2 concentrations for land use and energy. Science (80-), 324, 1183–1186. doi:10.1126/science.1168475
- Zakhem, B.A. and Kattaa, B., 2016. Cumulative drought effect on Figeh karstic spring discharge (Damascus Basin, Syria). Environmental Earth Sciences, 75, 125. doi:10.1007/s12665-015-5013->
- Zappa, G. and Shepherd, T.G., 2017. Storylines of atmospheric circulation change for European regional climate impact assessment. Journal of Climate, 30, 6561–6577. doi:10.1175/JCLI-D-16-0807.1