
 ?Mathematical formulae have been encoded as MathML and are displayed in this HTML version using MathJax in order to improve their display. Uncheck the box to turn MathJax off. This feature requires Javascript. Click on a formula to zoom.
ABSTRACT
With the rapid economic development and urbanization in Taihu Basin (eastern China), the river system has decayed and the connectivity of rivers and lakes has weakened, resulting in frequent floods. The impact of changes in river system structure on hydrological processes in the plain river network area was analysed against a background of urbanization. An indicator system was built to describe the quantitative, morphological and spatial structure of the river system. Analysis of the change in annual average and extreme water levels revealed the influencing mechanism of the changes in river system structure on the hydrological processes. The results indicate a decreasing tendency in the density of the river system in the study area, with a reduction in water surface ratio by about 20% in the past 50 years. Since the 1960s, the maximum and annual average water levels have increased. The degree of change in the mean monthly, annual lowest and annual highest water levels was great, with that in the non-flood season being higher than in the flood season. The decrease in the number of rivers directly reduced the storage and adjustable capacity of the basin.
Editor A. Castellarin; Guest editor Y. Jia
1 Introduction
The influence of human activities on water environment and water circulation has gradually become a hot topic in the field of hydrology (Suriya and Mudgal Citation2012, Chu et al. Citation2013, Kalantari et al. Citation2014). Natural river systems have ecological and social functions, such as supplying water resources, regulating the local climate, degrading pollution, resisting flood disaster (Cummins Citation1974, Yang et al. Citation2013), as well as being an important natural landscape. In order to meet the demand of land for developing urbanization, rivers have been buried and diverted to a certain extent, resulting in a great change in river system structure (Roy et al. Citation2009). For example, in the Rouge River watershed in southeast Michigan, USA, stream density has decreased since 1949, which coincided with a rapid population increase and systematic burial of urban streams (Napieralski et al. Citation2015). Of the total stream length, 14% of primarily first- and second-order streams, in a 16 000-km2 area of southwestern Ontario, Canada, has been buried (Stammlera et al. Citation2013). Elmore and Kaushal (Citation2008) found that 20% of all streams were buried in the basin of a major tributary to the Chesapeake Bay, Virginia, USA, while smaller headwater streams were more extensively buried than larger streams, and this difference increased with increasing impervious surface area. The structure of a river system is consistent with its function, and the deterioration of a river system leads to the degradation of its functions, such as the storage and adjustable capacity, flood discharge, self-purification and ecological restoration (Pennino et al. Citation2013, Beaulieu et al. Citation2014). This not only has a negative impact on the natural ecosystem, but also threatens the safety of the human life and property, and it is not conducive to sustainable development (Feng et al. Citation2001, Mishra et al. Citation2017, Ntajal et al. Citation2017).
The rapid development of urbanization in China has led to an increase in impervious area. As a result, the structure of river systems has been significantly affected. Huang et al. (Citation2008) found that, during the rapid urbanization in Shenzhen, the length, area and fractal dimension of the river system declined to different degrees, and the river tended to be simple. A study on the eastern coastal city of Zhejiang Province showed that the higher the level of urbanization, the more obvious the destruction of the river system structure was, and the number and length of low-order rivers was reduced the most seriously (Chen et al. Citation2007). The degree of change of the whole river system structure in Zhengzhou City resulted in altered states and the river system structure tended to be simplified (Qi et al. Citation2016).
The river system structure is closely related to the hydrological processes in a river basin. In particular, its function of regulating runoff and water levels can effectively reduce flooding. The quantitative and morphological characteristics of a river system structure directly determine the storage and adjustable capacity of the basin, and the spatial characteristics have an influence on the hydrological connectivity of the basin (Schröder Citation2006, Meng et al. Citation2014b). Furthermore, these characteristics have an impact on water transfer and the storage and adjustable capacity of the basin. Therefore, changes in the river system structure will affect the hydrological processes of the basin and may reduce the regulation of river water levels. The storage and adjustable capacity of a natural river system play an important role in regional flood control and disaster mitigation, and many studies have shown that the reduction of storage capacity is an important factor resulting in increases in regional flood disasters (Nat et al. Citation2002, Arnaud-Fassetta et al. Citation2003, Boccaletti et al. Citation2006, Cui et al. Citation2009). White and Greer (Citation2006) found that in the period 1966–2000, in Penasquitos River, California, USA, urban land-use area increased from 9% to 37%, and the magnitude of river floods increased significantly. The change in storage capacity of the river system in Shanghai, China, was similar to its spatial variation, and had a reverse relationship with the urbanization level (Yuan et al. Citation2005). However, most current research is focused on the impact of construction of reservoirs and other engineering structures on hydrological processes (Li et al. Citation2016, Vicente-Serrano et al. Citation2017, Yaghmaei et al. Citation2018), and discusses the changes in runoff and water level following the construction of reservoirs. In western countries, in particular, only a few studies have explored the effect of changes in river system structure on the hydrological processes in a river basin. Studies of river system structure in China mainly focus on its changing characteristics and driving factors (Han et al. Citation2015, Deng et al. Citation2016), or unilaterally analyse the influence of changes in river system on storage and adjustable capacity (Wang et al. Citation2016). There are few comprehensive analyses on the influencing mechanism of the change in river system structure on the hydrological processes from the aspect of the quantitative, morphological and spatial structure characteristics, by combining the evaluation of hydrological connectivity, storage and adjustable capacity.
The Taihu Basin is located in the Yangtze River Delta region, which is one of the most economically developed and urbanized areas in China. It reaches the Yangtze River in the north, faces the East China Sea to the east, is low altitude in the middle and high in the surrounding areas. Taihu is located in the centre of the basin, with advantageous natural conditions. The area of Taihu Basin accounts for about 0.4% of the total land area of China, while its GDP accounted for about 9.9% of the whole country in 2015. Taihu Basin is one of the most highly urbanized areas of China with densely distributed rivers and lakes. In recent years, the accelerating development of urbanization and industrialization has brought about a booming economy, as well as significant changes in land use and land cover (Qiao et al. Citation2016). Rivers of all orders, especially the terminal tributaries, have been constantly occupied by urban constructions, resulting in serious attenuation of the river system and a reduction in the connectivity of rivers and lakes. The water circulation in the basin has been affected as a result. At the same time, extreme precipitation events have increased in the basin (Yu et al. Citation2012, Liu et al. Citation2015), causing a series of problems in the water environment, such as the frequent occurrence of floods, which have largely restricted the sustainable development of the region. The Taihu Basin is located in the plain river network area, so the river runoff in the basin belongs to the reciprocating flow. The study of hydrological processes in this area is mainly concerned with analysis of the changes in water level. Therefore, in order to mitigate flood disasters and improve and protect the river system, it is urgent to carry out research on river system structure under the effect of urbanization.
The amount of annual rainfall over the Taihu Basin has not changed significantly over the years (Ding et al. Citation2010, Yin et al. Citation2013), and the change in river system structure caused by urbanization is an important factor affecting hydrological processes in the basin. Therefore, the objective of this study is to analyse the changing characteristics of river system structure and its influence on the hydrological processes in Taihu Basin.
2 Study area and data
2.1 Study area
Taihu Basin is located in the subtropical monsoon climate area, which has abundant rainfall. The seasonal distribution of precipitation is uneven, and the rainfall in the flood season accounts for about 60% of total volume. Taihu Basin is a typical river network plain in China, with numerous criss-crossing waterways and scattered lakes. In order to meet the requirements of flood control and water environment protection, Taihu Basin is divided into eight water conservancy districts: Huxi, Zhexi, Taihu, Wuchengxiyu, Yangchengdianmao, Hangjiahu, Puxi and Pudong.
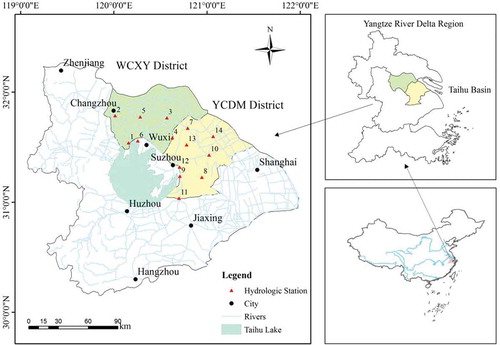
This study looks at the two districts Wuchengxiyu (WCXY) and Yangchengdianmao (YCDM), which are the most typical in the river network plain of Taihu Basin (). The area of WCXY district is 3838 km2, accounting for 10.4% of the basin, while the area of YCDM district is 4910 km2, accounting for of 13.3%. More than 15 million people live in this area and there are large cities, Suzhou, Wuxi and Changzhou in these two districts. In 2015, the per capita GDP of the three cities was around US$21 987, US$21 040 and US$18 018, respectively, much higher than the national level (US$8016). The structure and connectivity of the river system in this area has changed markedly due to the rapid growth of the population, the fast development of industry and the intensive expansion of the construction lands. If a flood disaster occurs, the economic loss in this area will be serious. The two water conservancy districts under study have different characteristics. There is no large lake in WCXY district, and the water surface ratio is relatively low, while there are several lakes in YCDM district. Furthermore, YCDM district is closer to Shanghai City, with faster economic growth. Therefore, taking WCXY and YCDM districts as typical areas is of important theoretical and practical significance.
Figure 1. Map showing the location, river system and hydrological stations in Taihu Basin.
2.2 Data
The river system data of the 1960s and 1980s are derived from digitized paper topographic maps, river systems maps, and the data of the 2010s is from a digital line graphic at a scale of 1:50 000. According to the classification method for streams (Strahler Citation1952) and its natural characteristics and social attributes, the rivers of Taihu Basin are divided into four orders ().
Table 1. Classification method of rivers of Taihu Basin.
Daily hydrological data of 14 stations in the study area are obtained from the Annual Hydrological Report of China from 1961 to 2014. The information of these hydrological stations is given in and .
Table 2. Details of the hydrological stations in the study area.
3 Method
An evaluation model () is established to analyse the impact of the changes in river system structure on hydrological processes in the plain river network area under the background of urbanization:
The indicator system for the changing characteristics of the river system is built to quantitatively describe the quantitative, morphological and spatial structural characteristics of the river system structure in the plain area.
Based on the characteristics of flow in the plain area, the changes in hydrological processes are revealed by analysing the change in annual average and extreme water levels in the study area. The indicators of hydrological alteration (IHA) approach is applied to quantitatively assess the impact of human activities on the hydrological conditions.
By calculating the change in storage and adjustable capacity, and combining it with the change in hydrological connectivity in the study area, the influencing mechanism of the changes in river system structure on the hydrological processes is revealed.
Figure 2. Flow chart of the evaluation model.
3.1 Characteristic indicators of river system structure
According to the flow characteristics of river system structure in plain area, and combined with the representativeness of indexes and the availability of the data, five indicators are selected to quantitatively describe the characteristics of river system structure in the plain area (). These indicators are: river density, water surface ratio, main river area–length ratio, river development coefficient and box dimension, and they can describe the river system from the three aspects of quantitative and morphological characteristic, and spatial structure.
Table 3. Indicator system of river network change.
3.2 Analysis of the changes of water level
3.2.1 Statistical analysis of the changes of water level
The variation of the annual average water level in the study area is assessed by applying the anomaly analysis method. The increment of the highest and lowest water levels in the study area and the difference between the two are reflected by the contour map. The method of Mann-Kendall (Hulme et al. Citation1992) is adopted to analyse the change of water level.
3.2.2 Indicators of hydrological alteration (IHA)
To quantitatively assess the impact of human activities on the hydrological conditions, this study uses the IHA proposed by Richter et al. (Citation1996, Citation1997). The IHA model includes 33 indicators and evaluates the changes in hydrological status of a river system from five aspects: flow/water level, and the time, frequency, duration and rate of change. In this paper, 31 indicators are selected and the range of variability (RVA) approach is used to analyse the change in hydrological factors after the disturbance by human activities. The degree of hydrological alteration, D, can be estimated as:
where No is the number of years in which the IHAs actually fall within the RVA target after disturbance by human activity, Ne is the number of years in which the IHAs are expected to fall within the RVA target after disturbance by human activities, r is the proportion of IHAs within the RVA target before disturbance by human activities, and Nt is the total number of years of the hydrological data after disturbance by human activities.
The range of 25–75% is selected as the RVA target. Accordingly, r is taken as 50% (Richter et al. Citation1998). To estimate the hydrological alteration, we divide the range of possible average values for hydrological alteration (0–100%) into three classes of equal range and assign each class a distinct pattern: (i) 0–33% represents little or no alteration; (ii) 34–67% represents moderate alteration; and (iii) 68–100% represents a high degree of alteration.
3.3 Storage and adjustable capacity of the river system
To analyse the regulation function of the river system, the storage and adjustable capacity per unit area (ASR) index is adopted. According to the actual conditions in the study area, the ASR refers to the increased volume of the river from the lowest water level to the warning water level per unit area. This index can effectively explain the storage and adjustable capacity of the river system. The greater the value, the stronger the natural regulation function of the study area is, so this is the core index for characterizing the storage and adjustable capacity. ASR is measured by:
where Wd is the water level difference between the lowest and the warning water levels, Rw is the river width, Rl is the river length, and A is the area of the water conservancy district (km2). In the calculation of ASR of the channel, it is assumed that the channel is rectangular.
3.4 Evaluation of hydrological connectivity
The concept of hydrological connectivity is abstract and different scholars have different understandings of it. It is mainly used to characterize the efficiency of water flow or the transfer of organic matter in water (Western et al. Citation2001, Pringle Citation2003, Freeman et al. Citation2007). This efficiency can be quantified by flow time, flow rate, flow persistence, water level change, water temperature change, etc. At present, the main methods to evaluate the hydrological connectivity include hydrological modelling, graph theory, and the response of index values between control points (Lesack and Marsh Citation2010, Karim et al. Citation2011, Xu et al. Citation2012b).
The study area is the plain river network area, the velocity of flow is slow and the flow direction is changeable. Therefore, the hydrological process is characterized by the change in water level. In the plain river network area, the water level of adjacent stations is closely related. For two adjacent stations connected by the river, the difference between the change in water level of the stations can be used to reflect the hydrological connectivity. For a certain period of time, if the difference between adjacent stations is small, it shows that the hydrological connectivity is good, and there is good synchronization between the two stations. In contrast, if the difference between the two stations is large, the hydrological connectivity is assumed to be poor. This can be measured as:
where is the hydrological connectivity between station a and b,
is the difference between the change in water level between the adjacent stations, and Lai, Laj, Lbi and Lbj are the water levels of stations a and b for periods i and j, respectively. To avoid the situation that the value of
is zero, and to control the value of Ch between 0 and 1, the following formula derived:
where . The larger the value of the difference of the change in water level between the adjacent stations, the closer Ch is to 0, and the smaller it is, the closer Ch is to 1. When the change in the water level of the two stations is the same, the value is 1, and the hydrological connectivity is the strongest. The hydrological connectivity in the study area is calculated based on the data of daily water level.
4 Results and discussion
4.1 Changing characteristics of the river system structure
As can be seen from , the changes in river system in these two districts are significant during the 1960s–2010s. In terms of quantitative characteristics, the density of the river system in the two districts in the 1960s is above 3.5 km/km2, and the degree of river development is relatively high. In subsequent periods, the river density in WCXY district has been in steady decline, while in YCDM district, the process first increased and then decreased. The water surface ratios of WCXY and YCDM districts have reduced, respectively, by 23.5% and 19.4% in the past 50 years. During the 1960s–1980s, the decrease rates are 8.3% and 7.4%, respectively, while during the 1980s–2010s, they are higher at 13% and 16.5%, respectively. The length and area of the secondary and tertiary rivers decreased sharply, while those of the primary and quaternary rivers showed a slight upward trend. This indicates that the quantitative characteristics of the river system in Taihu Basin are gradually decreasing, and the decrease is more severe since the 1980s.
Figure 3. Maps showing the river system in the study area in three different periods.
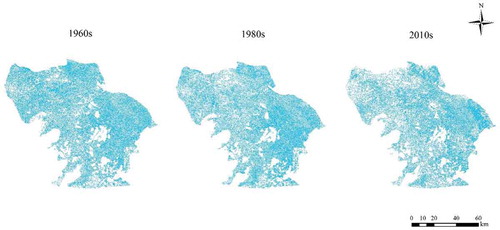
In terms of morphological characteristics, the main river area–length ratio shows an increase first and then a decrease in both districts. This may be due to the construction of new drainage channels and the widening of the original main river to meet the needs of city flood control. In terms of spatial structure, the river development coefficient of WCXY district has been decreasing in the last 50 years, while that in YCDM district increased to a certain extent, owing to the excavation of the river channel in the 1960s–1980s, after which the river development coefficient decreased to 2.56 by the 2010s. From the 1960s to the 2010s, the box dimension of WCXY and YCDM districts decreased by 7.8% and 2%, respectively, which indicates that the spatial structure of the river system in Taihu Basin tends to be primary and simple.
4.2 Changes in the hydrological processes
The Taihu Basin is located in the plain river network area, where the flow direction of the river is not fixed, so it is difficult to analyse the runoff directly. Changes in the hydrological processes are mainly reflected by changes in water level in the study area. Therefore, this study mainly discusses the characteristics and rules of water level change in the Taihu Basin under the influence of changes in the river system structure.
4.2.1 Analysis of water level change in Taihu River Basin
Urbanization is the main influencing factor of river system structure change. The impervious area increases and many tributary rivers are buried during the process of urbanization, causing the length and area of the river in Taihu Basin to decline, and the river system structure tends to be simple. The river system structure bears the hydrological processes, so changes in river system will have a direct impact on the hydrological processes of the basin.
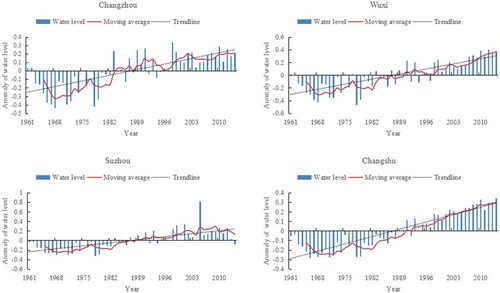
shows the anomaly variation and 5-year moving average of water level at four hydrological stations, among which Changzhou and Wuxi stations are located in WCXY district, and Suzhou and Changshu stations are located in YCDM district. The curves of water level change of the four representative stations show that the water level in the study area has been increasing significantly in the last 50 years. As can be seen from the process of water level change at Changzhou and Wuxi stations, there has been great fluctuation in water level in the period 1961–2014, but the overall trend is of rising water levels. The water level at Suzhou station in 2005 was relatively higher, and the change in water level was relatively small in the last 50 years, while the water level at Changshu station has been rising steadily from the 1960s to the 2010s. In general, from the beginning of the 1960s to the end of the 1970s, the observed water level of the four representative stations remained low and was generally lower than the annual average, and the fluctuation is notable. Since the 1980s, the water level of the four stations is higher than the annual average. It can be concluded that in the past 50 years, the water level in the Taihu Basin has been on the rise, with a significant change occurring in the 1980s.
Figure 4. Anomaly variation and a 5-year moving average of water level (m) at the four representative stations.
The statistical analysis of annual extreme water level and average water level of typical stations in Taihu Basin shows that the annual highest water level, the lowest water level and the average water level are all on the rise. Based on the characteristic statistics of long time series of water level data and MK analysis, the highest and lowest water levels in the study area are seen to have experienced an abrupt change around 1980. This is in accordance with the analysis results of the anomaly variation of water level mentioned in the previous paragraph. Since the 1980s, urbanization in this region has been developing rapidly, and the impervious area has been increasing steadily, resulting in great rise in water levels. The water level data were divided into a relative period (1981–2014) and a baseline period (1961–1980) to discuss the disturbing degree of influence of human activities on the hydrological processes.
To further explore the spatial characteristics of extreme water level change, a contour map of the increment of the highest and lowest water levels after the abrupt change was plotted based on the spatial interpolation technique. As shown in , the highest increase in the contour line of the lowest water level is 15%, and the lowest increase is 9%. The gradient is clearly larger than the highest water level (13% and 0, respectively). That is, the rise in the lowest water level is relatively large in space. The contour line of the increment of the highest water level is denser, which indicates that the difference in the highest water level increase is large, while that of the lowest water level is sparse, which indicates that the difference in the lowest water level increase is small. With the attenuation of river system structure, the highest and lowest water levels in the study area show a clear upward trend.
Figure 5. Contour maps of the increment of water level increase (%) after the abrupt change in water level in the study area: (a) highest water level and (b) lowest water level.
4.2.2 Analysis of the hydrological alteration
The water level data of Wuxi hydrological station are selected for the IHA analysis. To avoid the influence of relatively high or low water levels during a wet or dry year, the water level data of the normal year (25% < precipitation frequency < 75%) are used in the IHA analysis, including the years 1960, 1964, 1973, 1983, 1984, 1986, 1988, 1990, 1995, 1996, 2001, 2004, 2007, 2008 and 2012. The results are shown in .
Table 4. Results of the indicators of hydrological alteration (IHA) analysis for Taihu Basin.
It can be seen from that after the disturbance due to human activities (1981–2014), the monthly mean water levels increased to different degrees, among which the hydrological alteration of monthly mean water levels in February, August, January, November and December are most notable, and that of monthly mean water level in the non-flood season is higher than in the flood season. The average annual water level of the lowest 1 day and 3 days in the year, and the average annual water level of the highest 1, 3, 7, 30 and 90 days increased to varying degrees, which shows a high degree of alteration. The occurrence times and duration of high water levels increased, and the degree of hydrological alteration of low water level was also very high.
Among the 31 indicators, 16 show a high degree of alteration, six show moderate alteration, nine show little or no alteration, and a high degree of alteration is shown overall. Since the water level data used here are from a normal year, the influence of precipitation change on water level is eliminated to some extent, so the above conclusions are the result of human activities. In the highly urbanized area, the dramatic changes in land use have led to an increasing tendency in the water level of the basin (Xu et al. Citation2012a, Song et al. Citation2016).
The storage and adjustable capacity of the river system is crucial to the regulating function of the basin. The decrease of river channels and the disappearance of lakes result in a decrease in the regulating function of the river system in Taihu Basin, and the typical values of water level generally show an upward trend. The rapid urbanization in the basin has led to a significant increase in the impervious area, resulting in a great change in runoff generation and confluence and a rise in the flood peak water level.
4.3 The influencing mechanism of changes in river system structure on hydrological processes
4.3.1 Analysis of the change in storage and adjustable capacity
Since the 1960s, there has been a downward trend in the storage and adjustable capacity of the study area, with a reduction by 7.57% and 12.61% in the 1960s–1980s and 1980s–2010s, respectively, during which period the speed and magnitude of decrease also clearly increased. The storage and adjustable capacity of the river system is in reverse proportion to the level of urbanization. During the 1960s–2010s, the attenuation of the river system structure caused by urbanization has led to a clear decrease in flood regulating function and a change in the environment leading to flood risk, thus increasing the flood control pressure of typical regions in Taihu Basin.
shows the ASR of different orders of rivers in different periods in the study area. As can be seen from , there are marked differences in the storage and adjustable capacity of the river system in the study area according to the order of river. Since the 1960s, the storage and adjustable capacity of the primary river have shown a slight increasing trend, which is in line with the changing trend in the quantitative characteristics of primary rivers. During this period, in order to reduce the pressure on flood control in the area, some new artificial channels were excavated and some primary rivers dredged, so that the number of primary rivers increased slightly. The quaternary rivers were buried and disappeared less quickly than the high-order rivers converting into quaternary rivers during the process of urbanization, so the storage and adjustable capacity of the quaternary rivers show a slight increase. The storage and adjustable capacity of the secondary and tertiary rivers show a clearly decreasing trend, with rates of 10.80% in the 1960s–1980s and 20.13% in the 1980s–2010s. The decline in storage and adjustable capacity of the secondary and tertiary rivers contributes most to their reduction across the whole region. The large disappearance of secondary and tertiary rivers has led to a reduction in regional water surface ratio and, with the increase in impervious surface area, the regulating function of the urban rivers is seriously weakened.
Figure 6. Storage and adjustable capacity per unit area (104 m3/km2) of different orders of river courses in the three study periods.
The flood regulating function is one of the most important functions of the river system, and it is closely related to the quantitative characteristics of the rivers. Because of the numerous rivers and large water surface area, the storage capacity of the river system is considerable in the plain river network (Wang et al. Citation1999). The strong storage and adjustable capacity enables the river network to store and regulate the water effectively when facing high-intensity or continuous rainfall. It can reduce excessive rise in water level, so as to ensure regional safety in the flood season and prevent flood disaster. However, accompanied by urbanization and intense human activities, a large number of terminal rivers are occupied. And river density and water surface ratio decrease at different degrees, which leads to the decrease of regulating function and intensified flood disaster (Yang et al. Citation2004).
The storage and adjustable capacity of the river system are more affected by a large number of low-order rivers. Because low-order rivers are more susceptible to urbanization, most of the rivers that have been buried in the process of urbanization in Taihu Basin are low-order rivers. The disappearance of low-order rivers directly affects the urban flood control capacity and threatens water security in the city (Meng et al. Citation2005). The secondary and tertiary rivers in the study area have also disappeared in vast numbers, which has greatly reduced the storage and adjustable capacity of the basin, resulting in continuous accumulation of precipitation in the limited river channels. Finally, the annual average water level of the river system continues to increase. Since the 1980s, in particular, the rapid growth of urbanization in the Taihu Basin has accelerated the rate of attenuation in the river system and, in turn, the increment of water level change. In the face of a high-intensity rainfall event, the regulation and discharge capacity of the river is insufficient, and the water level rises rapidly in a short time.
Meanwhile, there are similar changes in other regions. Since the 1960s, the curvature of the rivers in the Hai River Basin has decreased, and the longitudinal continuity of the river has been severely damaged, causing many water environmental problems (Ding et al. Citation2016). During the period 1980–2005 in Shenzhen City, China, the river system structure has followed a trend from complexity to simplicity, and the density of the river system decreased from 0.84 to 0.65 km/km2 (Zhou et al. Citation2008). This intensified urban flood risk to some extent. Vanacker et al. (Citation2005) found that the active river channel narrowed by over 45%, and the riverbed was incised on average by over 1.0 m in the northwestern part of the Benin Owena River Basin (Nigeria), which affected the hydrological processes.
Different orders of river are also restricted by local natural conditions and development needs. Taihu Basin is located in the river network plain, and the pressure of flood control and drainage is great, so the first-order river has been protected during the process of urbanization. There are also some studies showing that first-order streams are largely replaced by urban infrastructure, which greatly affects the hydrological state in the watershed (Kaushal and Belt Citation2012). In Brazil, most first-order streams are even more vulnerable to land-use and climate change (Taniwaki et al. Citation2017). Of the different demands in varying areas, urbanization exerts various impacts on river systems, and the changing processes of different orders of river have regional characteristics. Therefore, the actual situation should be taken into consideration when formulating water environment management policy.
4.3.2 Analysis of the change in hydrological connectivity
There are many studies on the connectivity of river system worldwide (e.g. Bracken et al. Citation2013, Zilli and Paggi Citation2013, Connon et al. Citation2014). Although the definition of hydrological connectivity is not yet unified, the basic concepts and functional orientation are consistent. Hydrological connectivity plays an important role in biological survival and water quality in a river basin. It is vital for hydrological processes, storage and adjustable capacity and the allocation of water resources in the watershed (Quinton et al. Citation2003, Phillips et al. Citation2011). An unimpeded river system can realize the regulation of water resources and increase the ability of a region to cope with environmental changes, forming an important basis for regional flood control, water supply and ecological security. The hydrological connectivity is bound to the spatial structure of the river system. The complexity of the spatial structure of a river system and the integrity of its tributaries are important to ensure the connectivity of a river system.
In this study, we divide the hydrological stations into three categories. The first group of hydrological stations is located in the primary rivers, the second group is located in the primary rivers and the low-order rivers, respectively, and the third group is located in the low-order rivers. The value of Ch (Equation (5)) reflects the hydrological connectivity between different positions in the respective rivers. The changes in hydrological connectivity between different orders of river are shown in .
Table 5. Changes in hydrological connectivity between different orders of river.
The hydrological connectivity of adjacent stations on the primary rivers in the study area shows a tendency of increasing overall during the 1960s–2010s (). Although the hydrological connectivity between the primary rivers and the low-order rivers fluctuates, it shows a downward trend in the period 1960s–2010s. The hydrological connectivity between the low-order rivers also shows a downward trend. The results are consistent with other evaluation results based on the graph theory in this area (Shao et al. Citation2012).
In order to ensure the flood discharge capacity of the primary river, dredging and widening have been carried out, which increased its storage and adjustable capacity. The low-order rivers are the connecting channels between the primary rivers and low-order rivers, as well as the connecting channels between the low-order rivers. Along with the high-speed growth of urbanization, the low-order rivers have been occupied and buried, so that the complexity of the river system has been reduced and its hydrological connectivity is destroyed (Meng et al. Citation2014a, Zhou et al. Citation2017). The hydrological circulation in the basin is impeded, so the storage and adjustable capacity of the basin is reduced. Eventually, the water level of the river system continues to rise, and the risk of flood increases.
The decay of river system structure caused by rapid urbanization leads to the decline of storage and adjustable capacity, which ultimately affects the hydrological processes of the basin. On the one hand, the disappearance of a large number of the secondary and tertiary rivers has led to a reduction in regional water surface ratio, and with the increase in impervious surface area, the regulating function of the urban rivers is seriously weakened. The decline in quantitative and morphological characteristics of the river system structure directly reduces the storage and adjustable capacity of the basin. On the other hand, the complexity of the river system is reduced, which affects the hydrological circulation in the basin. The decline in the spatial characteristics of the river system structure causes a decrease in the hydrological connectivity in the basin, and the hindered hydrological circulation results in a reduction in the storage and adjustable capacity of the river system. The development of urbanization has changed the quantitative, morphological and spatial structural characteristics of the river system, and directly or indirectly increased the risk of flood in the basin.
The change in river system structure in the study area has the most direct and significant influence on the hydrological processes. Therefore, in the process of urbanization, we should pay attention to protect the water surface area of the river system, so as to ensure a certain water surface ratio and relieve the pressure of regional flood control and drainage. At the same time, accompanied by the development of urbanization, the change in land use will also change the process of runoff generation and confluence (Aladejana et al. Citation2018). The operation of water conservancy projects will also affect the hydrological processes (Remo et al. Citation2018). Thus, it is necessary to make rational use of water conservancy facilities (Lu et al. Citation2012, Alrajoula et al. Citation2016, Liu et al. Citation2017).
5 Conclusions
Based on the evaluation model, the changing regulation and characteristics of the river system structure under the influence of urbanization in the Taihu Basin have been revealed, the changes in hydrological processes in the study area have been analysed, and the influencing mechanism of influence of changes in river system structure on hydrological processes have been discussed.
The river density and the water surface ratio in the study area show a decreasing tendency, and the decrease has been more sever since the 1980s. The spatial structure of the river system in Taihu Basin has tended to become simple.
The changes in river system structure have greatly influenced the hydrological processes in the basin. Since the 1960s, the extreme water level and the annual average water level have increased significantly. The analysis results of IHA at Wuxi hydrological station show that the changes in the degree of hydrological alterations of the mean monthly water level, and the lowest and highest annual water levels are great, and the degree of alteration in the non-flood season is higher than that of the flood season.
Since the 1960s, the overall storage and adjustable capacity of study area has been weakened, and the risk of flooding is increasing. Due to the need for flood control, the primary rivers have been dredged and expanded to a certain extent. On the one hand, the increase in water surface ratio of the primary rivers directly leads to an increase in their storage and adjustable capacity. On the other hand, the hydrological connectivity is enhanced, also making the storage and adjustable capacity increase. Nevertheless, the secondary and tertiary rivers with the most significant influence on the storage and adjustable capacity of the whole basin have decayed markedly. A large number of low-order rivers have become buried in the process of urbanization. The spatial complexity of the river system has decreased and the hydrological connectivity has been weakened, leading to a reduction in the storage and adjustable capacity of the whole basin.
This evaluation model can be popularized and applied in river network plain areas of China and other countries.
Acknowledgements
The authors are grateful to the two reviewers and guest associate editor Dr Yangwen Jia for offering us detailed and valuable comments.
Disclosure statement
No potential conflict of interest was reported by the authors.
Additional information
Funding
References
- Aladejana, O.O., Salami, A.T., and Adetoro, O.O., 2018. Hydrological responses to land degradation in the Northwest Benin Owena River Basin, Nigeria. Journal of Environmental Management, 225, 300–312. doi:10.1016/j.jenvman.2018.07.095
- Alrajoula, M.T., et al., 2016. Hydrological, socio-economic and reservoir alterations of Er Roseires Dam in Sudan. Science of the Total Environment, 566–567, 938–948. doi:10.1016/j.scitotenv.2016.05.029
- Arnaud-Fassetta, G., et al., 2003. River channel changes in the Rhone Delta (France) since the end of the Little Ice Age: geomorphological adjustment to hydroclimatic change and natural resource management. Catena, 51 (2), 141–172. doi:10.1016/S0341-8162(02)00093-0
- Beaulieu, J.J., et al., 2014. Effects of urban stream burial on organic matter dynamics and reach scale nitrate retention. Biogeochemistry, 121, 107–126. doi:10.1007/s10533-014-9971-4
- Boccaletti, S., et al., 2006. Complex networks: structure and dynamics. Physics Reports, 424 (4–5), 175–308. doi:10.1016/j.physrep.2005.10.009
- Bracken, L.J., et al., 2013. Concepts of hydrological connectivity: research approaches, pathways and future agendas. Earth-Science Reviews, 119, 17–34. doi:10.1016/j.earscirev.2013.02.001
- Chen, Y., Xu, Y., and Fu, W., 2007. Influences of river network in the coastal areas of East Zhejiang province. Advances in Water Science, 18 (1), 68–73. doi:10.14042/j.cnki.32.1309.2007.01.012
- Chu, M.L., et al., 2013. Impacts of urbanization on river flow frequency: a controlled experimental modeling-based evaluation approach. Journal of Hydrology, 495 (495), 1–12. doi:10.1016/j.jhydrol.2013.04.051
- Connon, R.F., et al., 2014. Changing hydrologic connectivity due to permafrost thaw in the lower Liard River valley, NWT, Canada. Hydrological Processes, 28 (14), 4163–4178. doi:10.1002/hyp.10206
- Cui, B., et al., 2009. River channel network design for drought and flood control: a case study of Xiaoqinghe River basin, Jinan City, China. Journal of Environmental Management, 90, 3675–3686. doi:10.1016/j.jenvman.2009.07.010
- Cummins, K.W., 1974. Structure and function of stream ecosystems. Bioscience, 24 (11), 631–641. doi:10.2307/1296676
- Deng, X.J., et al., 2016. Spatial-temporal changes of river systems in Jiaxing under the background of urbanization. Acta Geographica Sinica, 71 (1), 75–85. doi:10.11821/dlxb201601006
- Ding, J.J., et al., 2010. Effect of urbanization on regional precipitation in Suzhou-Wuxi-Changzhou area. Resources and Environment in the Yangtze Basin, 19 (8), 873–877.
- Ding, Y.K., Zhang, H., and Shan, B.Q., 2016. The spatial distribution and evolution trend of rivers in Hai River Basin. Acta Scientiae Circumstantiae, 36 (1), 47–54. doi:10.13671/j.hjkxxb.2015.0140
- Elmore, A.J. and Kaushal, S.S., 2008. Disappearing headwaters: patternsof stream burial due to urbanization. Frontiers in Ecology and the Environment, 6 (6), 308–312. doi:10.1890/070101
- Feng, Q., Endo, K.N., and Cheng, G.D., 2001. Towards sustainable development of the environmentally degraded arid rivers of China-a case study from Tarim River. Environmental Geology, 41 (1–2), 229–238. doi:10.1007/s002540100387
- Freeman, M.C., Pringle, C.M., and Jackson, C.R., 2007. Hydrologic connectivity and the contribution of stream headwaters to ecological integrity at regional scales. Journal of the American Water Resources Association, 43 (1), 5–14. doi:10.1111/j.1752-1688.2007.00002.x
- Han, L.F., et al., 2015. Temporal and spatial change of stream structure in Yangtze River Delta and its driving forces during 1960s–2010s. Acta Geographica Sinica, 70 (5), 819–827. doi:10.11821/dlxb201505012
- Huang, Y., et al., 2008. Stream construction characteristics in rapid urbanization area: shenzhen city as a case. Geographical Research, 27 (5), 1212–1220. doi:10.3321/j.issn:1000-0585.2008.05.024
- Hulme, M., Marsh, R., and Jones, P.D., 1992. Global changes in a humidity index between 1931–60 and 1961–90. Climate Research, 2 (1), 1–22. doi:10.3354/cr002001
- Kalantari, Z., et al., 2014. Quantifying the hydrological impact of simulated changes in land use on peak discharge in a small catchment. Science of the Total Environment, 466–467 (1), 741–754. doi:10.1016/j.scitotenv.2013.07.047
- Karim, F., et al., 2011. Modelling wetland connectivity during overbank flooding in a tropical floodplain in north Queensland, Australia. Hydrological Processes. doi:10.1002/hyp.8364
- Kaushal, S.S. and Belt, K.T., 2012. The urban watershed continuum: evolving spatial and temporal dimensions. Urban Ecosystems, 15 (2), 409–435. doi:10.1007/s11252-012-0226-7
- Lesack, L.F.W. and Marsh, P., 2010. River-to-lake connectivities, water renewal, and aquatic habitat diversity in the Mackenzie River Delta. Water Resources Research, 46 (12), 439–445. doi:10.1029/2010WR009607
- Li, C., et al., 2016. Damming effect on the Changjiang (Yangtze River) river water cycle based on stable hydrogen and oxygen isotopic records. Journal of Geochemical Exploration, 165, 125–133. doi:10.1016/j.gexplo.2016.03.006
- Liu, Q., et al., 2017. Joint optimization scheduling for water conservancy projects in complex river networks. Water Science and Engineering, 10 (1), 43–52. doi:10.1016/j.wse.2017.03.008
- Liu, X., et al., 2015. Characteristics analysis of extreme precipitation in Taihu Lake Basin in the last 30 years. Water Resources and Power, 33 (9), 1–4.
- Lu, S., et al., 2012. Hydro-ecological impact of water conservancy projects in the Haihe River Basin. Acta Oecologica, 44 (10), 67–74. doi:10.1016/j.actao.2011.07.003
- Meng, F., et al., 2005. Dynamic changes of river network under intensive human activities: a case of Pudong new area, Shanghai municipality. Resources Science, 27 (6), 156–161. doi:10.3321/j.issn:1007-7588.2005.06.025
- Meng, H.F., et al., 2014a. Study on rivers connectivity evaluation in plain river network area. Resources and Environment in the Yangtze Basin, 23 (5), 626–631. doi:10.11870/cjlyzyyhj201405005
- Meng, X.Y., 2014b. Evaluation system of urban water system connectivity. Journal of Hohai University (natural Sciences), 42 (1), 24–28. doi:10.3876/j.issn.1000-1980.2014.01.005
- Mishra, B.K., et al., 2017. Assessment of Bagmati river pollution in Kathmandu Valley: scenario-based modeling and analysis for sustainable urban development. Sustainability of Water Quality & Ecology, 9–10, 67–77. doi:10.1016/j.swaqe.2017.06.001
- Napieralski, J., et al., 2015. Urban stream deserts as a consequence of excess stream burial in Urban Watersheds. Annals of the Association of American Geographers, 105 (4), 649–664. doi:10.1080/00045608.2015.1050753
- Nat, D., et al., 2002. Imundation dynamics in braided floodplains: tagliamento River, Northest Italy. Ecosystems, 5, 636–647. doi:10.1007/s10021-002-0170-0
- Ntajal, J., et al., 2017. Flood disaster risk mapping in the Lower Mono River Basin in Togo, West Africa. International Journal of Disaster Risk Reduction, 23, 93–103. doi:10.1016/j.ijdrr.2017.03.015
- Pennino, M.J., et al., 2013. Effects of urban stream burial on nitrogen uptake and ecosystem metabolism: implications for watershed nitrogen and carbon fluxes. Biogeochemistry, 121, 247–269. doi:10.1007/s10533-014-9958-1
- Phillips, R.W., et al., 2011. Connectivity and runoff dynamics in heterogeneous basins. Hydrological Processes, 25 (19), 3061–3075. doi:10.1002/hyp.8123
- Pringle, C., 2003. What is hydrologic connectivity and why is it ecologically important? Hydrological Processes, 17 (13), 2685–2689. doi:10.1002/hyp.5145
- Qi, Q., Zhang, Z., and Gao, Y., 2016. Comprehensive evaluation of the effects of urbanization on Zhengzhou City river structure. Environmental Engineering, 34 (4), 156–160. doi:10.13205/j.hjgc.201604032
- Qiao, W.F., et al., 2016. Research on urban expansion and land use change in Nanjing over the past 32 years. Journal of Geo-information Science, 18 (2), 200–209.
- Quinton, W.L., Hayashi, M., and Pietroniro, A., 2003. Connectivity and storage functions of channel fens and flat bogs in northern basins. Hydrological Processes, 17, 3665–3684. doi:10.1002/hyp.1369
- Remo, J.W.F., et al., 2018. Assessing the impacts of dams and levees on the hydrologic record of the Middle and Lower Mississippi River, USA. Geomorphology, 313, 88–100. doi:10.1016/j.geomorph.2018.01.004
- Richter, B.D., et al., 1996. A method for assessing hydrologic alteration within ecosystems. Conservation Biology, 10 (4), 1163–1174. doi:10.1046/j.1523-1739.1996.10041163.x
- Richter, B.D., et al., 1997. How much water does a river need? Freshwater Biology, 37 (1), 231–249. doi:10.1046/j.1365-2427.1997.00153.x
- Richter, B.D., et al., 1998. A spatial assessment of hydrologic alteration within a river network. Regulated Rivers Research and Management, 14 (4), 329–340. doi:10.1038/sj.ejcn.1601689
- Roy, A.H., et al., 2009. Urbanization affects the extent and hydrologic permanence of headwater streams in a midwestern US metropolitan area. Journal of the North American Benthological Society, 28 (4), 911–928. doi:10.1899/08-178.1
- Schröder, B., 2006. Pattern, process, and function in landscape ecology and catchment hydrology – how can quantitative landscape ecology support predictions in ungauged basins? Hydrology and Earth System Sciences, 10 (6), 967–979. doi:10.5194/hess-10-967-2006
- Shao, Y.L., Xu, Y.P., and Ma, S.S., 2012. Change of river structure and stream network connectivity in the Taihu Lake Basin under the urbanization development. Resources and Environment in the Yangtze Basin, 21 (10), 1167–1172.
- Song, S., et al., 2016. The long-term water level dynamics during urbanization in plaincatchment in Yangtze River Delta. Agricultural Water Management, 174, 93–102. doi:10.1016/j.agwat.2016.01.010
- Stammlera, K.L., et al., 2013. Buried streams: uncovering a potential threat to aquatic ecosystems. Landscape and Urban Planning, 114, 37–41. doi:10.1016/j.landurbplan.2013.02.008
- Strahler, A.N., 1952. Hypsometric (area-altitude) analysis of erosional topography. Geological Society of America Bulletin, 63 (11), 1117. doi:10.1130/0016-7606(1952)63[1117:HAAOET]2.0.CO;2
- Suriya, S. and Mudgal, B.V., 2012. Impact of urbanization on flooding: the Thirusoolam sub watershed-a case study. Journal of Hydrology, 412 (1), 210–219. doi:10.1016/j.jhydrol.2011.05.008
- Taniwaki, R.H., et al., 2017. The native vegetation protection law of Brazil and the challenge for first-order stream conservation. Perspectives in Ecology and Conservation, 16 (1), 49–53. doi:10.1016/j.pecon.2017.08.007
- Vanacker, V., et al., 2005. River channel response to short-term human-induced change in landscape connectivity in Andean ecosystems. Geomorphology, 72 (1–4), 340–353. doi:10.1016/j.geomorph.2005.05.013
- Vicente-Serrano, S.M., et al., 2017. Effect of reservoirs on streamflow and river regimes in a heavily regulated river basin of Northeast Spain. Catena, 149 (3), 727–741. doi:10.1016/j.catena.2016.03.042
- Wang, L., et al., 1999. Analysis of the storage capacity of river network in Taihu Watershed. Journal of Nanjing University (natural Sciences), 6, 712–718.
- Wang, Y.F., et al., 2016. Influence of stream structure change on regulation capacity of river networks in Taihu Lake Basin. Acta Geographica Sinica, 71 (3), 449–458. doi:10.11821/dlxb201603008
- Western, A.W., Blöschl, G., and Grayson, R.B., 2001. Toward capturing hydrologically significant connectivity in spatial patterns. Water Resources Research, 37 (1), 83–97. doi:10.1029/2000WR900241
- White, M.D. and Greer, K.A., 2006. The effects of watershed urbanization on the stream hydrology and riparian vegetation of Los Peñasquitos Creek, California. Landscape and Urban Planning, 74 (2), 125–138. doi:10.1016/j.landurbplan.2004.11.015
- Xu, G., et al., 2012a. Changes of water level induced by human activities at Hangzhou-Jiaxing-Huzhou Plain in recent 50 years. Scientia Geogrphica Sinica, 32 (10), 1262–1268. doi:10.13249/j.cnki.sgs.2012.10.019
- Xu, G.L., et al., 2012b. Evaluation of river network connectivity based on hydraulic resistance and graph theory. Advances in Water Science, 23 (6), 776–781. doi: CNKI: 32.1309.P.20121101.1800.017.
- Yaghmaei, H., et al., 2018. Effect of dam operation on monthly and annual trends of flow discharge in the Qom Rood Watershed, Iran. Journal of Hydrology, 557, 254–264. doi:10.1016/j.jhydrol.2017.12.039
- Yang, K., et al., 2004. Stream structure characteristics and its urbanization responses to tidal river system. Acta Geographica Sinica, 59 (4), 557–564. doi:10.3321/j.issn:0375-5444.2004.04.009
- Yang, T., Liu, J., and Chen, Q., 2013. Assessment of plain river ecosystem function based on improved gray system model and analytic hierarchy process for the Fuyang River, Haihe River Basin, China. Ecological Modelling, 268 (5), 37–47. doi:10.1016/j.ecolmodel.2013.07.023
- Yin, Y.X., et al., 2013. Analysis of effects of urbanization on regional hydrological processes based on water level duration curve - a case study of water level changes in the river network of Taihu Lake Basin. Bulletin of Soil and Water Conservation, 33 (3), 91–94+258.
- Yu, W.J., et al., 2012. Study on spatial and temporal characteristics of rainstorm in Taihu Lake Basin. Journal of Natural Resource, 27 (5), 766–777. doi:10.1007/s11783-011-0280-z
- Yuan, W., et al., 2005. Stream structure characteristics and their impact on storage and flood control capacity in the urbanized plain river network. Geographical Research, 24 (5), 717–724. doi:10.3321/j.issn:1000-0585.2005.05.008
- Zhou, F., Lv, H.H., and Xu, Y.P., 2017. Change of river structure and river network connectivity in plain river network area. Resources and Environment in the Yangtze Basin, 26 (3), 402–409. doi:10.11870/cjlyzyyhj201703010
- Zhou, H.J., Wang, J.A., and Shi, P.J., 2008. Influence of river network change in 1980–2005 on flood Hazard in Shenzhen City, China. Journal of Natural Disasters, (1), 97–103. doi:10.13577/j.jnd.2008.0117
- Zilli, F.L. and Paggi, A.C., 2013. Ecological responses to different degrees of hydrologic connectivity: assessing patterns in the bionomy of Benthic Chironomids in a large river-floodplain system. Wetlands, 33 (5), 837–845. doi:10.1007/s13157-013-0440-y