
 ?Mathematical formulae have been encoded as MathML and are displayed in this HTML version using MathJax in order to improve their display. Uncheck the box to turn MathJax off. This feature requires Javascript. Click on a formula to zoom.
ABSTRACT
Hydrological processes in hilly watersheds are significantly affected by variations in elevation; however, the hydrological functions of different vertical vegetation belts, have rarely been reported. The distributed hydrological model WEP-L (Water and Energy transfer Process in Large river basins) was applied to analyse vertical variations in the hydrological processes of Qingshui River basin (QRB), Wutai Mountain (altitude: 3058 m a.s.l.), China. The results show that the highest ratio of evapotranspiration to precipitation occurs at 1800 m a.s.l. Below 1800 m, evapotranspiration is mainly controlled by precipitation, and in regions above1800 m it is controlled by energy. The runoff coefficients for different vertical vegetation belts may be ranked as follows: farmland > grassland > subalpine meadow > evergreen coniferous shrub forest > deciduous broad-leaved forest. Grassland is the largest runoff production area, contributing approximately 39.10% to the annual water yield of the QRB. The runoff from forested land decreased to a greater extent than the grassland runoff. Increasing forest cover may increase evapotranspiration and reduce runoff. These results are important, not only for further understanding of the hydrological mechanisms in this basin, but also for implementing the sustainable management of water resources and ecosystems in other mountainous regions.
Editor A. CastellarinGuest editor Y. Chen
1 Introduction
Mountainous regions are important water source areas, especially in arid and semi-arid areas, providing more than 90% of the freshwater for human daily activities and production; mountain ecosystems are highly vulnerable to extreme precipitation events and temperature changes due to their high gradients (Diaz et al. Citation2003). River catchments in mountainous areas are characterized by strong variations in terrain, climatic and snow cover conditions, soil and vegetation, all of which are closely related to elevation (Gurtz et al. Citation1999). Therefore, the water cycle will change as the elevation increases. For instance, rainfall was found to increase nonlinearly with elevation in the Indus basin (Dahri et al. Citation2016). In the Thur River Basin in northeast Switzerland, the actual evapotranspiration showed greater variability in lower and medium altitude areas than in the upper elevation areas, and the total discharge showed a clear increase with altitude (Gurtz et al. Citation1999). In the headwater watershed of the southern Sierra Nevada, where the elevation is between 1800 and 2400 m a.s.l., the annual runoff coefficient increased by approximately 0.1 per 300 m (Hunsaker et al. Citation2012). Additionally, changes in mountainous terrain result in vertical differences in climate and vegetation, especially when coupled with changes in altitude, as different vegetation landscapes exist at different elevations. Different landscape zones have different hydrological processes as well as different production and flooding mechanisms. Zhang et al. (Citation2016) compared the surface energy fluxes and evapotranspiration in three alpine ecosystems (Kobresia meadow, Potentilla fruticosa shrub and Achnatherum splendens steppe) of the Qinghai Lake basin, China. They found that annual sensible heat accounted for 56–64% of net radiation, with the highest flux occurrung in the P. fruticosa shrub and the lowest in the A. splendens steppe; the P. fruticosa shrub had the highest annual evapotranspiration, followed by the Kobresia meadow, and the A. splendens steppe had the lowest evapotranspiration. There are inconsistent proportions of surface runoff in different landscape zones in the Mafengou River basin in the Qilian mountainous area of China; for example, 11% of runoff occurred in the glacier-snow zone, 20% in the alpine cold desert zone and alpine shrub meadow zone, and 9% in the alpine grassland zone (Yang et al. Citation2012a). Grassland was shown to be the main area of water production, followed by bare rock and alpine meadow in the Pailugou catchment in the Qilian Mountains of northwestern China (He et al. Citation2012).
The water cycle links atmospheric water, surface water, groundwater and ecological water. Changes in the water cycle profoundly affect the structure and evolution of global water resources and ecological environment systems, as well as anthropogenic activities. Additionally, the water cycle is widely affected by land-use change in a variety of ways (Zhang et al. Citation2015). The effects of land use on evapotranspiration, infiltration and soil water consequently altered the quantity of runoff (Peng et al. Citation2013a, Zucco et al. Citation2014). Rapid urbanization in China had increased peak flow and even led to flooding, having an adverse impact on urban hydrological processes (Chen et al. Citation2015). Water is the key resource for economic and agricultural development, and runoff is an important factor for understanding the water cycle and tracking undesirable changes in global water systems. Due to the heterogeneity of the underlying surface properties, different landscape zones exhibit different hydrological processes, especially in terms of forested land. There are three perspectives on this effect: that increasing forest cover will decrease the water yield; thus, cutting down forests led to an increase in runoff (Sahin and Hall Citation1996, Siriwardena et al. Citation2006). Similarly, the water yield of a conifer-type forest increased by 20–25 mm after the forest cover was reduced by 10% (Sahin and Hall Citation1996). Another perspective is that decreased forest cover may reduce the water yield (Cheng Citation1999), and thirdly, it is suggested that forest cover change may have no effect on runoff (Beck et al. Citation2013). These studies show that the effect of changes in forest cover on streamflow is a complicated scientific issue and varies depending on the different geological characteristics, climatic conditions and forest types.
Additionally, social and economic development in mountainous areas has led to the gradual urbanization of rural areas (Dietz Citation1987). In China, nearly 170 million migrant workers leave their hometowns to move to cities each year, resulting in 2 million hectares of farmland falling out of production (Liu and Li Citation2017). Over time, this farmland has ceased to be cultivated and is gradually replaced by secondary forests (Beck et al. Citation2013). Moreover, China has actively advocated for ecological restoration policies, such as returning cultivated fields to forests and returning livestock to grasslands, as in the Green Wall of China Project and Grain-for-Green Project in 1999, with the primary aims of retiring and converting steep farmlands (slope > 15°) to green lands (Qiu et al. Citation2017). The impacts of land conversion on runoff should be evaluated.
Wutai Mountain, located in the western Haihe River Basin in northern China, is the highest mountain in this region (3058 m a.s.l., with a relative height difference of over 2000 m) and is also the origin of the Qingshui River. Clear differences in surface cover create a unique mountain hydrological process. The Qingshui River Basin (QRB) is an important water source for the Haihe River Basin. However, runoff of the QRB has significantly decreased as a result of human activity and climate change (Tian et al. Citation2009, Yang et al. Citation2010). Given the relative height difference of more than 2300 m in the QRB, the hydrological cycle fluxes and energy fluxes change with altitude. Moreover, there are different vertical belts of vegetation due to differences in terrain, climate and soil at different altitudes. Hydrological processes in hilly watersheds are significantly affected by variation in elevation; however, the hydrological functions of different vertical vegetation belts have rarely been reported.
Although previous studies had been conducted in this region, three questions must be investigated further: What is the relationship among water cycle fluxes, energy fluxes and elevation? What are the differences in the hydrological processes among different vertical vegetation belts? and How has land-use change affected runoff in the QRB? Answering these questions is important, not only for gaining an in-depth understanding of the hydrological mechanism in this catchment, but also for facilitating the sustainable management of mountain water resources and ecosystems.
2 Study area, data and methods
2.1 Study area description
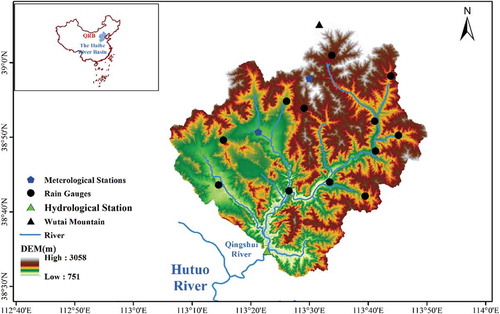
The Qingshui River () originates from Wutai Mountain and enters into the Huto River. The QRB is located between 113°07′–113°50′E and 38°32′–39°03′N, and the drainage area is 2298.42 km2. The elevation ranges from 751 to 3058 m a.s.l. The QRB is located in a semi-arid and semi humid area with a continental monsoon climate. The area is dry and cold in winter but rainy and hot in summer. The annual average air temperature was 9.0°C in the period 1960–2015, and approximately 60% of the annual rainfall occurs between June and September.
Figure 1. Location and digital elevation model of the Qingshui River Basin.
Land-use types in the QRB include farmland, urban area, grassland, evergreen coniferous shrub forest, deciduous broad-leaved forest and subalpine meadow (). Together, forest and grassland comprise the main land cover types, accounting for 90.59% of the entire basin. The differences in terrain, climate and soil at different altitudes form the different vertical landscape belts (): the farmland belt is below 1200 m and accounts for 9.20% of the total area; grasslands are below 2000 m and account for 33.60% of the total area; evergreen coniferous shrub forest is in the elevation range 1000–2000 m (13.65%); deciduous broad-leaved forest is in the elevation range 1200–2500 m (40.80%); and subalpine meadow is at the highest elevation, above 2000 m. Finally, urban area are sporadically distributed in the QRB and account for only 0.21% of the total area.
Figure 2. Land-use map of the QRB.
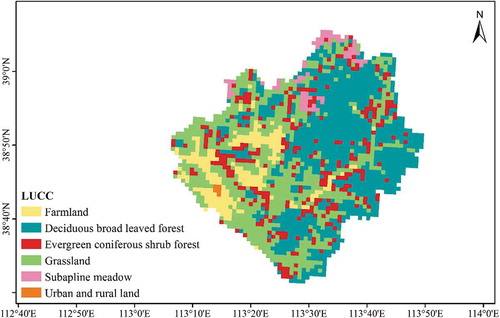
Figure 3. Vertical landscape belts in the QRB.
2.2 Database description
Daily rainfall, mean air temperature, relative humidity, wind speed and sunshine duration data for the period 1960–2015 were collected from two meteorological stations in the QRB; all data were downloaded from the National Meteorological Information Center of the China Meteorological AdministrationFootnote1. To reduce the impact of the large spatial variability in precipitation, the daily precipitation data for the period 1960–2015 from 12 rainfall stations in the QRB were extracted from the China Hydrological Year Book (published by the Hydrological Bureau of China) The QRB has a high altitude, and the temperature varies greatly with elevation. In this study, we used the temperature and elevation data of the meteorological stations, and then obtained the elevation of the computing unit and the relationship between the temperature and altitude (–0.58°C/100 m) (Cui et al. Citation2005). Then, the temperature of the computing unit was interpolated using the Thiessen polygon approach. The monthly streamflow data for the period 1960–2000 at the Nanpo hydrological station were extracted from the China Hydrological Year Book. To further validate the model results, we also used evapotranspiration data, which were collected from MODIS (Moderate Resolution Imaging Spectroradiometer)Footnote2 , global data acquired every 8 days to develop a 1-km resolution dataset (Herman et al. Citation2018). In this study, we used the MOD16A2 evapotranspiration data spanning the period 2001–2015 and further validated the simulated results of the distributed hydrological model.
2.3 Water and energy transfer processes in large river basin (WEP-L) model
The WEP-L model is a distributed hydrological model that has been successfully used in many catchments in China with different terrain, geological and climatic conditions (Jia et al. Citation2004, Citation2005a, Citation2006, Citation2012, Peng et al. Citation2013b). WEP-L simulations include the water cycle and energy processes. The water cycle simulation includes evapotranspiration, infiltration, runoff, confluence and water use, while energy processes include net radiation, longwave and shortwave radiation, geothermal heat, latent heat and sensible heat (Jia et al. Citation2006, Citation2012, Peng et al. Citation2013b). In the WEP-L model, the Penman formula or the Penman-Monteith formula was used to calculate evapotranspiration. Surface runoff was divided into super-osmotic flow and full-charge flow, and the Green-Ampt model and the Richards equation were used to calculate these two flows, respectively. For the snowmelt process, we adopted the temperature index method (Jia et al. Citation2012). A detailed description of the WEP-L model may be found in previous studies (Jia et al. Citation2005b, Citation2009, Citation2012, Peng et al. Citation2013b).
The main parameters of the WEP-L model are the maximum interception depth of vegetation, maximum reservoir depth in the depression, saturated soil transmissivity, parameters of the soil moisture absorption curve, conductivity coefficient of the groundwater aquifer, water production coefficient, permeability coefficient of the riverbed material, and slope and roughness of the river (Jia et al. Citation2012). In our study, we calibrated the main parameters using three methods: the Nash-Sutcliffe coefficient (NS), relative error (RE), and correlation coefficients between the observed and simulated monthly streamflow (R2) (Nash and Sutcliffe Citation1970, Moriasi et al. Citation2007):
where Qobs and Qsim are the observed and simulated streamflow, respectively; and
are the average values of Qobs and Qsim, respectively; and Rsim and Robs are the simulated and observed total water resources, respectively.
2.4 Calibration and validation of the WEP-L
In this study, 1960–1985 was selected as the calibration period, and 1986–2000 was selected as the validation period. Compared to the observed streamflow data, the WEP-L simulation provided good results. The monthly streamflow dynamics for the calibration and validation periods () were adequately captured. In this study, the NS, RE, and R2 for the monthly streamflow were, respectively, 0.78, – 4.3%, and 0.89 for the calibration period (), and 0.70, 3.7% and 0.86 for the validation period (). To further illustrate the reliability of the model calculation results, we used the MOD16A2 remote sensing evapotranspiration data (for the period from 2001–2015) to validate the evapotranspiration results of the WEP-L model. For the verification period, the annual ET series between MOD16A2 and the WEP-L in the QRB showed inter-annual variability, with a relative error of 3.76% (as shown in ). In short, the WEP-L model showed good applicability in the QRB, and the simulated results are considered appropriate for the subsequent analysis.
Figure 4. Simulation results of monthly streamflow in the QRB for (a) the calibration period (1960–1985) and (b) the validation period (1986–2000).
Figure 5. Comparison of annual evapotranspiration from WEP-L and MODIS in the QRB for the period 2001–2015.
2.5 Hypothetical scenarios
If land-use change is less than 10%, it would be difficult to quantitatively analyse the influence of the main land-use types on the runoff, and the data cannot provide a reasonable reference for the planning of future land-use patterns in the basin (Li et al. Citation2016). To solve this problem, we used the extreme land-use method to construct four main land-use scenarios, in which all the land-use types in the catchment are classified as either farmland, grassland, evergreen coniferous shrub forest, or deciduous broad-leaved forest. Then, we analysed the response relationship between the single land-use type and runoff amount. Additionally, the socio-economic development in mountainous areas indicates the gradual urbanization of rural areas (Dietz Citation1987). Also, over time, farmland that is no longer cultivated is gradually replaced by grassland and secondary forests (Beck et al. Citation2013). Moreover, China has actively advocated for ecological restoration policies, such as returning cultivated fields to forests and returning livestock areas to grasslands. Thus, we set up three farmland conversion scenarios in which farmland was converted into grassland, evergreen coniferous shrub forest, or deciduous broad-leaved forest, and streamflow responses to different land-use changes were analysed.
3 Results
3.1 Changes in water cycle fluxes and energy fluxes with elevation
The simulations of annual mean precipitation, evapotranspiration, infiltration, runoff, net radiation, sensible heat, latent heat and ground heat (the heat flux from soil to ground surface) in the QRB for the period 1960–2015 were calculated at 100 m altitude spacing. The total area of the region above 2600 m is 8.20 km2 and this area occupies only 0.36% of the total area of the basin. Therefore, regions above 2600 m were considered as one section. shows the variation in annual mean water cycle fluxes (precipitation, evapotranspiration, infiltration and runoff) and energy fluxes (net radiation, sensible heat, latent heat and ground heat) with altitude. For the water cycle fluxes (), precipitation and evapotranspiration increased with altitude, and the correlations were 0.93 and 0.85, respectively. For the regions above 2100 m, the evapotranspiration did not increase with elevation and tended to flatten or even decrease. However, infiltration decreased with elevation, with a correlation of 0.29. Runoff changed with altitude to form ‘V’ shaped curves, and the lowest runoff occurred in the areas with elevations ranging from 1600 to 2000 m. For the energy fluxes (), the net radiation increased slightly with altitude. The sensible heat and ground heat decreased with elevation, while the latent heat increased with altitude, with correlations of 0.35, 0.95 and 0.86, respectively. These results illustrate that precipitation, latent heat, ground heat and evaporation are significantly related to elevation in the study area. While the correlations among infiltration, runoff, net radiation, sensible heat and elevation are non-significant, these factors may be influenced by the slope, aspect, vegetation type, and so on.
Figure 6. Changes with elevation in mean value of (a) water cycle flux and (b) energy flux in the QRB for the period 1960–2015.
To further understand how the water cycle fluxes and energy fluxes change with increases in elevation, we evaluated the differences among the changes in evapotranspiration, infiltration and runoff with altitude and the changes in precipitation with altitude; the variations in sensible heat, latent heat and ground heat with elevation; and the variations in net radiation with elevation. The variations in the evapotranspiration coefficient (ratio of evapotranspiration to precipitation, ET/P), infiltration coefficient (ratio of infiltration to precipitation, INF/P), and runoff coefficient (ratio of runoff to precipitation, R/P) are shown in . The ratios of sensible heat to net radiation (H/RN), latent heat to net radiation (LE/RN), and ground heat to net radiation (G/RN) are shown in . The ET/P was highest at an altitude of 1800 m, with a value of 0.85 (). The ET/P increased with elevation, for elevations below 1800 m, and decreased with elevation for elevation above 1800 m. The relationship between the runoff coefficient and elevation was opposite to that between the evapotranspiration coefficient and elevation and presented a ‘V’ shape (). The infiltration coefficient decreased significantly with elevation (R2 = 0.77) (). The H/RN decreased slightly with altitude (R2 = 0.29) (), while the LE/RN and G/RN decreased significantly with altitude (R2 = 0.66 and 0.91, respectively) ().
Figure 7. Changes with elevation in mean value of (a) water cycle flux coefficients and (b) energy flux ratios in the QRB for the period 1960–2015.
3.2 Vertical zonality of the water cycle and energy cycle
Based on the simulation, shows the water cycle fluxes and energy fluxes of different vertical vegetation belts in the QRB in the period 1960–2015. For the QRB water cycle fluxes, the runoff coefficient is 0.18, and the runoff amount 251.15 × 10⁶ m3, and for the QRB energy fluxes, the sensible heat, latent heat, and ground heat accounted for 52%, 30% and 18% of the net radiation, respectively. The sensible heat was the main category of land surface energy in the QRB.
Table 1. Water cycle fluxes and energy fluxes for each vertical vegetation belt and the whole QRB for the period 1960–2015. Coniferous: evergreen coniferous shrub forest; Deciduous: deciduous broad-leaved forest.
shows the comparison of the water cycle fluxes and energy fluxes for various vertical vegetation belts. For the water cycle fluxes (), precipitation in the subalpine meadow was the largest, followed by the deciduous broad-leaved forest, evergreen coniferous shrub forest, grassland and farmland. The relationship between the evapotranspiration in different vertical vegetation zones is similar to that of precipitation. The runoff in the subalpine meadow was the largest, followed by farmland, while deciduous broad-leaved forest had the least runoff. The infiltration for different vegetation vertical belts can be ranked as follows: farmland > grassland > subalpine meadow > evergreen coniferous shrub forest > deciduous broad-leaved forest. For the energy fluxes (), net radiation for different vegetation vertical belts are ranked as follows: farmland > subalpine meadow > grassland > deciduous broad-leaved forest > evergreen coniferous shrub forest. The sensible heat was the largest for the evergreen coniferous shrub forest, followed by deciduous broad-leaved forest, farmland, grassland and subalpine meadow. Latent heat for the different vertical belts could be ranked as follows: subalpine meadow > deciduous broad-leaved forest > evergreen coniferous shrub forest > grassland > farmland, while the ground heat exhibited the opposite ranking to that of the latent heat.
Figure 8. Comparison of mean (a) water cycle flux and (b) energy flux for various vertical vegetation belts for the period 1960–2015.
To eliminate the effects of precipitation and net radiation, we compared the water cycle flux coefficients and energy flux ratios for various vegetation vertical belts (). The evapotranspiration coefficient of forest was higher than that of grassland and farmland, and the runoff coefficients for different vertical belts could be ranked as follows: farmland > grassland > subalpine meadow > evergreen coniferous shrub forest > deciduous broad-leaved forest (). For the energy flux ratio (), the H/RN of the forest was greater than 0.5, while the other three vegetation vertical belts were lower than 0.5, especially for the subalpine meadow, which was only 0.33. The LE/RN for different vegetation vertical belts could be ranked as follows: subalpine meadow > deciduous broad-leaved forest > evergreen coniferous shrub forest > grassland > farmland; G/RN exhibited the opposite pattern to LE/RN.
Figure 9. Comparison of mean (a) water cycle flux coefficients and (b) energy flux ratio for various vertical vegetation belts for the period 1960–2015.
also shows the runoff amount and runoff amount ratio for each vegetation vertical belt. The area of deciduous broad-leaved forest was the largest land cover region (40.80% of the QRB) and contributed 34.59% of the runoff amount. In contrast, grassland (33.60%) contributed 39.10% of the runoff amount to the total water yield of the basin, and was the largest water yield contribution region. Moreover, the runoff amount ratio of farmland, grassland and subalpine meadow was larger than the area ratio, while the water yield ratio of the forest was smaller than the area ratio. These results show that grassland was the main productive area for annual water yield in the QRB.
Given China’s reform and opening-up policy in 1979 and the Grain-for-Green project in 1999, we divided the study period into three periods: 1960–1979, 1980–2000 and 2001–2015, to better understand the runoff sources. The water balances of the different vertical vegetation belts for the three periods are shown in . It can be seen from that the runoff coefficient decreased and the total runoff amounts of the three periods decreased significantly. Additionally, the runoff coefficient and runoff amount of the different vertical belts also decreased during the three periods. In terms of the contribution of each vertical belt to the total water yield, while that of the deciduous broad-leaved forest decreased (37.22% to 28.42%) and that of grassland increased (36.06% to 44.74%), the variations in contribution of the other three vertical belts decreased by less than 3%. These results illustrate that deciduous broad-leaved forest runoff decreased to a greater extent than that of grassland.
Table 2. Water balance for each vertical vegetation belt for the three study periods. Coniferous: Evergreen coniferous shrub forest; Deciduous: deciduous broad-leaved forest. ET: evapotranspiration.
3.3 Runoff responses to land-use change
The changes in the water cycle fluxes and runoff amounts in different land-use scenarios are shown in . Compared to the present scenario, the simulation results shown in clearly indicate that increased forest area (all evergreen coniferous shrub forest and all deciduous broad-leaved forest scenarios) would increase evapotranspiration but decrease runoff. The evergreen coniferous shrub forest scenario led to an increase in evapotranspiration and a decrease in water yield, while for the ‘all’ deciduous broad-leaved forest scenario, evapotranspiration increased and runoff decreased (). In contrast, an increased area of farmland or grassland resulted in reduced evapotranspiration and increased runoff. The evapotranspiration increased and the runoff decreased in the three farmland conversion scenarios, but the changes were not obvious, since the farmland area occupied only 9.41% of the basin. These results illustrate that increased forest cover would increase evapotranspiration and reduce runoff in the basin, and that increased areas of farmland or grassland would result in an increase in runoff.
Table 3. Results of the water cycle elements and runoff amounts under different simulated scenarios (1960–2015). Present: present land use; ‘All’ refers to the present land use of converted land in each case; the last three scenarios represent the conversion of present farmland to different land use. Change ratio is ratio of the difference between the changed scenario and the present scenario to the present scenario.
4 Discussion
4.1 Hydrological processes in different vertical belts
Evapotranspiration was controlled by precipitation in locations below 1800 m elevation, and the areas of the QRB above 1800 m were energy-limited, as shown by the results in . Evapotranspiration variation is dominated by precipitation variations under dry-hot climatic conditions by potential variations in evaporation under wet-cold climatic conditions (Zeng and Cai Citation2015). According to the results of the changes in precipitation and temperature along with elevation in the QRB in the period 1960–2015, the precipitation increased with altitude and the temperature decreased with altitude, leading to a hot-dry climate at low elevations and a cold-wet climate at high elevations. Combined with the results of Zeng and Cai (Citation2015), these findings show that the QRB evapotranspiration is limited by precipitation in dry and warm environments at low elevations, and evapotranspiration is limited by temperature in cold and humid environments at high elevations. According to and , areas below 1800 m are mainly farmland and grassland, while those above 1800 m are forested; the leaf area index and growth seasons decrease with increasing elevation. These data led to the highest ratio of evapotranspiration to precipitation (ET/P) at an altitude of 1800 m.
The ranking of the vegetation belts is described in Section 3.2. The evapotranspiration coefficient of evergreen coniferous shrub forest was the largest due to the long evapotranspiration time, because leaves are evergreen for the whole year, and the high temperature promotes transpiration. The farmland evapotranspiration was the lowest, which was likely because the growing season was from May to October and transpiration occurred during only half of the year. Farmland was bare, except during the growing season, which may be why the runoff coefficient was maximized in the farmland. Due to interception by the vegetation canopy, litter layer and strong evapotranspiration to sustain tree growth, the runoff ratio for the forest (0.16) was lower than that of the other land-use zones. This result is nearly consistent with the findings of Yaseef et al. (Citation2010) and Gao et al. (Citation2016). Yaseef et al. (Citation2010) showed that ET accounted for 85% of precipitation when rainfall was greater than 300 mm in the Yatir forest in southern Israel. Gao et al. (Citation2016) showed that the runoff coefficient of the coniferous forest was 0.18, which was lower than the other land-use types in the Upper Heihe Basin in China. Furthermore, Wang et al. (Citation2004) researched the annual water balance of shrubs and found that the evaporation ratio was approximately 0.94 in the southeast Tengger Desert, Shapotou, China, which is higher than that obtained in this study. This difference is due to the differences in temperature and elevation between the two study regions.
Grassland contributed to the maximum proportion of the annual water yield (accounting for 39.10%) and was the main runoff production area in the QRB. In the QRB, forest covered 54.45% of the total area, but contributed 46.39% to the water yield, while grassland occupied 33.60% of the total area of the QRB but contributed 39.10% to the water yield, which is the largest water yield proportion. This result occurred because the runoff coefficient and the area of grassland were larger, causing to grassland to be the main runoff production area for the QRB, a result that is in line with previous studies (Yang et al. Citation2011, He et al. Citation2012).
In this study, deciduous broad-leaved forest runoff decreased to a greater extent than grassland runoff. According to the water balance equation, runoff reduction is the reason for decreased precipitation and increased evapotranspiration. As shown in , between the periods 1960–1979 and 2001–2015, the deciduous broad-leaved forest precipitation decreased by 11% (from 648.98 to 576.51 mm), evapotranspiration increased by 3% (503.43 to 517.51 mm), and the evapotranspiration coefficient increased from 0.78 to 0.90, while runoff decreased by 65% (168.47 to 96.14 mm) and the runoff coefficient decreased by 60%. For grasslands, the precipitation decreased by 9% (597.91 to 543.06 mm), evapotranspiration increased by 3% (438.26 to 451.48 mm), and the evapotranspiration coefficient increased from 0.73 to 0.83, while runoff decreased by 43% (168.47 to 96.14 mm) and the runoff ratio decreased by 37%. In other words, mainly due to decrease in precipitation and increased evapotranspiration, the high evapotranspiration coefficient caused the runoff to decrease to a greater extent in the deciduous broad-leaved forest. Wang et al. (Citation2004) studied the water balance of shrubs in the desert and found that the evapotranspiration coefficient ratio was approximately 94% in the southeast Tengger Desert, Shapotou, China. Wang et al. (Citation2008) researched the annual water balance of different vegetation types in the semi-arid Liupan Mountains, northwest China, and found that the evapotranspiration coefficient was 60% for grassland, 93% for shrubs and >95% for forestland. These results also show that forestland has a lower runoff coefficient than other land-use zones.
4.2 Forest impact on runoff
Since forest has been recognized as one of the important areas influencing runoff, many ecohydrologists have analysed the relationship between forest and runoff using various hydrological models and experiments (Sahin and Hall Citation1996, Wang et al. Citation2004, Beck et al. Citation2013). Moreover, more information about how increased forest cover affects the hydrological cycle and water resources is crucial. In this study, our results illustrate that increased forest cover would reduce the runoff amount, which is consistent with previous findings (Guo et al. Citation2008, Zhang et al. Citation2015). There are four reasons for a reduction in runoff. First, increasing forest cover allows the vegetation canopy to intercept more rainfall and the intercepted rainfall return to the atmosphere through evaporation (Xu Citation2011, Yang et al. Citation2012b, Liang et al. Citation2015). Second, litter layers beneath the trees enhance rainfall infiltration and the remainder of the intercepted water is dissipated to the atmosphere by evapotranspiration during the dry season (Xu Citation2011, Liang et al. Citation2015). Third, plant root uptake consumes some of the precipitation infiltration, slows the infiltration process and leads to dry soil layers (Wang et al. Citation2011). Finally, vegetation transpiration also consumes substantial precipitation (Liang et al. Citation2015). Therefore, increasing forest cover will reduce runoff amount. Moreover, decreasing forest land increased water yield in the Hun-Taizi River basin from 1980 to 2000 (Zhang et al. Citation2014). This finding can also be explained by the idea that increasing forest cover reduces runoff. Notably, if rainfall does not increase in the future, increasing forest cover as a result of the present ecological restoration policy will reduce runoff. Therefore, this forest cover increase will reduce the supply of water to the lower reaches and exacerbate the water shortage crisis. Hence, the current ecological restoration policy in the QRB may need to be modified. The amount of forest cover that should be maintained in the QRB requires further examination in future studies.
5 Conclusions
The distributed hydrological model WEP-L was developed for the Qingshui River Basin on the Wutai Mountain, and the hydrological processes of the QRB were simulated. The WEP-L model was validated using observational streamflow data and remote sensing evapotranspiration data. We analysed the relationship between the hydrological processes and elevation; additionally, the differences in the water cycle fluxes and energy fluxes were analysed for the five main vertical vegetation belts: farmland, grassland, evergreen coniferous shrub forest, deciduous broad-leaved forest and subalpine meadow. Finally, we analysed the streamflow responses to land-use change by setting up four extreme land-use scenarios and three farmland conversion scenarios. The four main results of our study are as follows:
The highest ratio of evapotranspiration to precipitation was at an altitude of approximately 1800 m. Evapotranspiration was mainly controlled by precipitation below 1800 m, and the areas with altitudes higher than 1800 m were energy-limited.
Precipitation, latent heat, ground heat and evapotranspiration were significantly related to elevation, while the correlations between infiltration, runoff, net radiation, sensible heat and elevation were non-significant. The ratio of sensible heat to net radiation decreased slightly with altitude, while the ratio of latent heat to net radiation and the ratio of ground radiation to net radiation decreased significantly with altitude.
The runoff coefficients for different vertical belts were ranked as follows: farmland > grassland > subalpine meadow > evergreen coniferous shrub forest > deciduous broad-leaved forest. Grassland was the main runoff production area and contributed approximately 39.10% of the water yield of the QRB. Forest runoff decreased to a greater extent than grassland and farmland runoff.
Increasing the forest cover would increase evapotranspiration and reduce runoff, and increased areas of farmland or grassland would result in increased runoff.
Disclosure statement
No potential conflict of interest was reported by the authors.
Additional information
Funding
Notes
References
- Beck, H.E., et al., 2013. The impact of forest regeneration on streamflow in 12 mesoscale humid tropical catchments. Hydrology & Earth System Sciences, 17 (7), 2613–2635. doi:10.5194/hess-17-2613-2013
- Chen, Y.B., et al., 2015. Urban flood risk warning under rapid urbanization. Environmental Research, 139, 3–10. doi:10.1016/j.envres.2015.02.028
- Cheng, G.W., 1999. Forest change: hydrological effects in the upper Yangtze River valley. AMBIO, 28, 456–459.
- Cui, H.T., et al., 2005. Mountain ecology and alpine forest line research. Beijing: Science Press.
- Dahri, Z.H., et al., 2016. An appraisal of precipitation distribution in the high-altitude catchments of the Indus basin. Science of the Total Environment, 548–549, 289–306. doi:10.1016/j.scitotenv.2016.01.001
- Diaz, H.F., Grosjean, M., and Graumlich, L., 2003. Climate variability and change in high elevation regions: past, present and future. Climatic Change, 59, 1–4. doi:10.1023/A:1024416227887
- Dietz, J.L., 1987. Economic history of Puerto Rico, institutional change and political development. Princeton, NJ: Princeton University Press.
- Gao, B., et al., 2016. Modeling ecohydrological processes and spatial patterns in the upper Heihe Basin in China. Forests, 7 (1), 1–21. doi:10.3390/f7010010
- Guo, H., Hu, Q., and Jiang, T., 2008. Annual and seasonal streamflow responses to climate and land-cover changes in the Poyang Lake basin, China. Journal of Hydrology, 355, 106–122. doi:10.1016/j.jhydrol.2008.03.020
- Gurtz, J., Baltensweiler, A., and Lang, H., 1999. Spatially distributed hydrotope-based modelling of evapotranspiration and runoff in mountainous basins. Hydrological Processes, 13 (17), 2751–2768. doi:10.1002/(ISSN)1099-1085
- He, Z.B., et al., 2012. Effect of forest on annual water yield in the mountains of an arid inland river basin: a case study in the Pailugou catchment on northwestern China’s Qilian Mountains. Hydrological Processes, 26 (4), 613–621. doi:10.1002/hyp.8162
- Herman, M.R., et al., 2018. Evaluating the role of evapotranspiration remote sensing data in improving hydrological modeling predictability. Journal of Hydrology, 556, 39–49. doi:10.1016/j.jhydrol.2017.11.009
- Hunsaker, C.T., Whitaker, T.W., and Bales, R.C., 2012. Snowmelt runoff and water yield along elevation and temperature gradients in California’s Southern Sierra Nevada. Journal of the American Water Resources Association, 48 (4), 667–678. doi:10.1111/j.1752-1688.2012.00641.x
- Jia, Y.W., et al., 2004. Distributed hydrologic modeling and river flow forecast for water allocation in a largescaled inland basin of Northwest China. In: Proceedings of 2nd APHW Conference, vol. 2, July Singapore, 285–292.
- Jia, Y.W., et al., 2005b. Theory and practices of distributed watershed hydrological models. Chapter 7. Beijing: China Water & Power Press, 111–132.
- Jia, Y.W., et al., 2009. Distributed modeling of landsurface water and energy budgets in the inland Heihe River basin of China. Hydrology and Earth System Science, 13 (10), 1849–1866. doi:10.5194/hess-13-1849-2009
- Jia, Y.W., et al., 2012. Attribution of water resources evolution in the highly water-stressed Hai River Basin of China. Water Resources Research, 48, W02513. doi:10.1029/2010WR009275
- Jia, Y.W., Kinouchi, T., and Yoshitani, J., 2005a. Distributed hydrologic modeling in a partially urbanized agricultural watershed using WEP model. Journal of Hydrologic Engineering ASCE, 10 (4), 253–263. doi:10.1061/(ASCE)1084-0699(2005)10:4(253)
- Jia, Y.W., et al., 2006. Development of the WEP-L distributed hydrological model and dynamic assessment of water resources in the Yellow River basin. Journal of Hydrology, 331, 606–629. doi:10.1016/j.jhydrol.2006.06.006
- Li, Y.Y., et al., 2016. Spatiotemporal responses of runoff to land use change in Wei River Basin. Transactions of the Chinese Society of Agricultural Engineering, 32 (15), 232–238. [in Chinese].
- Liang, W., et al., 2015. Quantifying the impacts of climate change and ecological restoration on streamflow changes based on a Budyko hydrological model in China’s Loess Plateau. Water Resources Research, 51 (8), 6500–6519. doi:10.1002/2014WR016589
- Liu, Y.S. and Li, Y.H., 2017. Revitalize the world’s countryside. Nature, 548 (7667), 275–277. doi:10.1038/nature23004
- Moriasi, D.N., et al., 2007. Model evaluation guidelines for systematic quantification of accuracy in watershed simulations. Transactions of the Asabe, 50 (3), 885–900. doi:10.13031/2013.23153
- Nash, J.E. and Sutcliffe, J.V., 1970. River flow forecasting through conceptual models part I – A discussion of principles. Journal of Hydrology, 10 (3), 282–290. doi:10.1016/0022-1694(70)90255-6
- Peng, H., et al., 2013b. Assessing climate change impacts on the ecohydrology of the Jinghe River basin in the Loess Plateau, China. Hydrological Sciences Journal, 58 (3), 1–20. doi:10.1080/02626667.2013.774457
- Peng, S.Z., et al., 2013a. Estimating the effects of climatic variability and human activities on streamflow in the Hutuo River Basin, China. Journal of Hydrologic Engineering, 18 (4), 422–430. doi:10.1061/(ASCE)HE.1943-5584.0000664
- Qiu, L.L., et al., 2017. Spatiotemporal response of the water cycle to land use conversions in a typical hilly-gully basin on the Loess Plateau, China. Hydrology and Earth System Sciences, 21, 6485–6499. doi:10.5194/hess-21-6485-2017
- Sahin, V. and Hall, M.J., 1996. The effects of afforestation deforestation on water yields. Journal of Hydrology, 178, 293–309. doi:10.1016/0022-1694(95)02825-0
- Siriwardena, L., Finlayson, B.L., and McMahon, T.A., 2006. The impacts of land use change on catchment hydrology in large catchments: the Comet River, Central Queensland, Australia. Journal of Hydrology, 326, 199–214. doi:10.1016/j.jhydrol.2005.10.030
- Tian, F., Yang, Y.H., and Han, S.M., 2009. Using runoff slope-break to determine dominate factors of runoff decline in Hutuo River Basin, North China. Water Science & Technology, 60 (8), 2135–2144. doi:10.2166/wst.2009.578
- Wang, X.P., et al., 2004. Water balance change for a re-vegetated xerophyte shrub area. Hydrological Sciences Journal, 49, 283–295. doi:10.1623/hysj.49.2.283.34841
- Wang, Y.H., et al., 2008. Water-yield reduction after afforestation and related processes in the semiarid Liupan Mountains, northwest China. Journal of the American Water Resources Association, 44 (5), 1086–1097. doi:10.1111/j.1752-1688.2008.00238.x
- Wang, Y.Q., et al., 2011. Impacts of land use and plant characteristics on dried soil layers in different climatic regions on the Loess Plateau of China. Agricultural and Forest Meteorology, 151 (4), 437–448. doi:10.1016/j.agrformet.2010.11.016
- Xu, J.X., 2011. Variation in annual runoff of the Wudinghe River as influenced by climate change and human activity. Quaternary International, 244 (2), 230–237. doi:10.1016/j.quaint.2010.09.014
- Yang, H.B., Yang, D.W., and Lei, Z.D., 2010. Impact of decreasing orographic precipitation on water resources in Wutai Mountain region, China. Advances in Water Science, 21 (5), 674–680. [In Chinese].
- Yang, Y.G., et al., 2011. Hydrological processes in different landscapes on Mafenggou River basin. Advances in Water Science, 22 (5), 624–630. [In Chinese].
- Yang, Y.G., et al., 2012a. Hydrological processes in the different landscape zones of alpine cold regions in the wet season, combining isotopic and hydrochemical tracers. Hydrological Processes, 26 (10), 1457–1466. doi:10.1002/hyp.8275
- Yang, Y.T., Shang, S.H., and Jiang, L., 2012b. Remote sensing temporal and spatial patterns of evapotranspiration and the responses to water management in a large irrigation district of North China. Agricultural and Forest Meteorology, 164, 112–122. doi:10.1016/j.agrformet.2012.05.011
- Yaseef, N.R., et al., 2010. Ecohydrology of a semi-arid forest: partitioning among water balance components and its implications for predicted precipitation changes. Ecohydrology, 3 (2), 143–154.
- Zeng, R.J. and Cai, X.M., 2015. Assessing the temporal variance of evapotranspiration considering climate and catchment storage factors. Advances in Water Resources, 79, 51–60. doi:10.1016/j.advwatres.2015.02.008
- Zhang, L.L., et al., 2015. Different land management measures and climate change impacts on the runoff – A simple empirical method derived in a mesoscale catchment on the Loess Plateau. Journal of Arid Environments, 120, 42–50. doi:10.1016/j.jaridenv.2015.04.005
- Zhang, S.-Y., et al., 2016. Surface energy fluxes and controls of evapotranspiration in three alpine ecosystems of Qinghai Lake watershed, NE Qinghai-Tibet Plateau. Ecohydrology, 9, 267–279. doi:10.1002/eco.1633
- Zhang, Y.F., et al., 2014. Impacts of climate change and land use change on runoff of forest catchment in northeast China. Hydrological Processes, 28 (2), 186–196. doi:10.1002/hyp.9564
- Zucco, G., et al., 2014. Influence of land use on soil moisture spatial-temporal variability and monitoring. Journal of Hydrology, 516 (6), 193–199. doi:10.1016/j.jhydrol.2014.01.043