
 ?Mathematical formulae have been encoded as MathML and are displayed in this HTML version using MathJax in order to improve their display. Uncheck the box to turn MathJax off. This feature requires Javascript. Click on a formula to zoom.
ABSTRACT
Flood-risk is affected by both climatic and anthropogenic factors. In this study, we assess changes in flood risk induced by a combination of climate change and flood prevention sets in the Baiyangdian (BYD) Lake area of China. Extreme storm events are analysed by the bias-corrected climate data from global climate models. A hydrological model is implemented and integrated with a hydrodynamic model to assess flood risk under three scenarios. The streamflow into the BYD was validated against historical flash-flood events. The results indicate that the changing climate increased extreme precipitation, upstream total inflow and the flood risk at the core region of Xiong’an New Area (XNA), the newly announced special economic zone in the BYD area. However, flood prevention measures can effectively mitigate the climatic effect. The research highlights the severe flash-flood risk at BYD and demonstrates the urgent need for a climate-resilient plan for XNA.
Editor A. CastellarinGuest editor M. Borga
Introduction
In recent decades, floods are among the major disasters causing a large number pf casualties and huge economic losses across the world (Wu et al. Citation2016). The special report on extremes (SREX report) of the Intergovernmental Panel on Climate Change (IPCC) assessed the risks of extreme events under climate change scenarios (Field et al. Citation2012) and projected increases in flood risk were examined (Field et al. Citation2012, Hirabayashi et al. Citation2013). Changes in flood risk could be an integrated response of climatic factors (e.g. precipitation) and anthropogenic factors (e.g. hydraulic engineering) (Seneviratne et al. Citation2012, Handmer et al. Citation2012, Bouwer Citation2013, Tang and Ge Citation2018). To quantify the changes in flood risk, climate change projections and the impacts of hydraulic engineering need to be quantified and computed using a series of numerical models.
General circulation models (GCMs) are the primary tools used to provide future climate change projections under various cumulative greenhouse gas emissions climate scenarios (e.g. Mehrotra et al. Citation2013, Chen et al. Citation2017, Tan et al. Citation2017, Yin et al. Citation2017, Reshmidevi et al. Citation2018), such as the representative concentration pathways (RCP) scenarios of the IPCC (e.g. Meinshausen et al. Citation2011) and the Special Report on Emission Scenarios (SRES) (Nakićenović et al. Citation2000, Citation2003). Generally, GCM outputs are too coarse to be directly used to drive a hydrological model. To this end, downscaling methods, including statistical methods (e.g. Reynard et al. Citation2001, Mehrotra and Sharma Citation2010) and dynamic methods (e.g. Orlowsky et al. Citation2008, Dominguez et al. Citation2012) have been developed and adopted to provide matching spatio-temporal scales for the hydrological simulation.
Various kinds of hydrological model have been applied to assess the hydrological impacts of climate change, such as lumped or semi-distributed conceptual models, e.g. HBV (Bergström Citation1995), GR4J (Perrin et al. Citation2003), PDM (Moore Citation2007), VIC (Liang et al. Citation1994), WSFS (Vehviläinen Citation1994), and grid-based distributed models, e.g. DHSVM (Wigmosta et al. Citation1994, Citation2002), LISFLOOD (De Roo et al. Citation2000), MIKE SHE (Graham and Butts Citation2006), CLASSIC (Crooks et al. Citation2000), Liuxihe model (Chen et al. Citation2011), WEP model (Yang et al. Citation1998) and DBH model (Tang and Oki Citation2016). A great challenge when implementing hydrological models is the issue of parameter optimization. Numerous studies of optimization algorithms have been devoted to solving the optimization problem (e.g. Duan et al. Citation1994, Kollat and Reed Citation2006, Tolson et al. Citation2009, Fu et al. Citation2012, Asadzadeh and Tolson Citation2013, Chen et al. Citation2016). However, the selection of hydrological model in realistic application is determined by the comprehensive consideration of meteorological, hydrological, morphologic and geological characteristics of the study basin.
Numerical models for flood inundation estimation can be divided into different categories according to their spatial scale. One type of numerical model is the physically-based routing models for global flood estimation (e.g. Yamazaki et al. Citation2011, Wu et al. Citation2014). Another option is the basin-scale overland-flooding hydrodynamic models (e.g. Galland et al. Citation1991, Hervouet and Van Haren Citation1996, Horritt and Bates Citation2001, Mignot et al. Citation2006, Liang et al. Citation2008, Lai et al. Citation2010, Wang et al. Citation2011, Citation2013, Yang et al. Citation2016, Logah et al. Citation2017), which are based on high-resolution data that greatly benefits the consideration of anthropogenic factors (especially for hydraulic engineering). The relatively high-resolution digital elevation model (DEM) data enable the model to reproduce the effects of hydraulic engineering such as a dike or dam. For large-scale (e.g. basin-scale) simulation, the computational efficiency based on the high-resolution data is usually a big concern. One strategy to deal with this issue is to develop a GPU-based high-performance hydrodynamic model for the basin-scale application (e.g. Smith and Liang Citation2013, Citation2015, Liang et al. Citation2016).
In this work, we assessed the overland flood risk affected by climate change and hydraulic engineering in Baiyangdian (BYD) Lake area. Five GCMs were employed to project future changes in extreme precipitation and a semi-distributed hydrological model was used to estimate the changes in river discharge. With the changing river discharge and hydraulic engineering works, we further predicted the overland flood characteristics using a hydrodynamic model. The objectives of this study are: (a) to estimate the future storm of 50-year return period based on the GCM projections; (b) to assess the risks of three scenarios: a historic 50-year flood, a historic 50-year flood with heightened dike and reservoirs, and a future 50-year flood with heightened dike and reservoirs; and (c) to quantify the differences among these three scenarios, in terms of flood inundation area, inundation water depth and flood arrival time.
Materials and methods
Study area
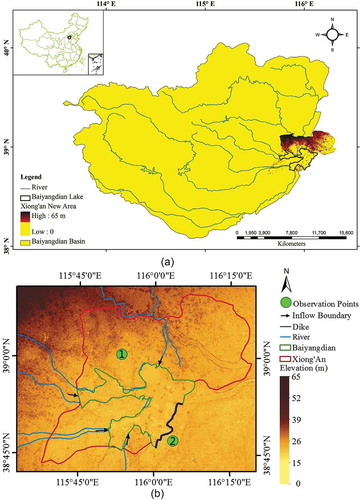
Lake Baiyangdian (BYD) lies in the middle stream of the Daqing River catchment within the Hai River basin, about 108 km south of Beijing, China. The Xiong’an New Area, which includes the counties of Xiongxian, Rongcheng and Anxin of Hebei Province, is situated in this region (see ). As a major historic strategic choice made by President Xi, the establishment of Xiong’an New Area is a great millennium plan, covering about 2000 km2, with a population of 2–2.5 million, to be constructed according to President Xi’s call for “world vision, international standards, Chinese characteristics and high goals”. The BYD Lake is the largest freshwater lake and wetland in the North China Plain, with a total surface area of 366 km2 (). The lake depth varies depending on the hydrological conditions, but is usually less than 2.0 m (Li et al. Citation2017). In this region, the annual mean temperature is generally in the range of 7–12°C and the annual mean precipitation is around 550 mm. Due to the dominance of a continental monsoon climate, the hydro-climatic regime of this region is characterized by clear wet and dry seasons within the year. The cumulative precipitation in July–September contributes 80% of total annual precipitation. This uneven distribution of annual and inter-annual precipitation makes the area susceptible to flooding (Jiang et al. Citation2017). In August 1963, the BYD region was hit by the greatest recorded extreme storm, with a duration of 7 days (3–9 August) and consecutive areal precipitation of over 400 mm, resulting in an unprecedented disastrous flood, referred to as the ‘1963–8ʹ flood (Han Citation1981). During the period of the 1963–8 flood, the BYD Lake received about 6 × 10⁹ m3 of upstream water and the water level exceeded 11 m for 13 days, causing huge economic losses and loss of human livelihoods (Han Citation1981).
Figure 1. Study area: (a) Daqinghe river basin; (b) Baiyangdian Lake and the Xiong’an New Area.
Data
In this study, a set of 59-year (1952–2010) gridded daily meteorological data generated at the Institute of Geographic Sciences and Natural Resources Research (IGSNRR) of the Chinese Academy of Sciences (hereafter referred to as IGSNRR data) was used to create a design storm and calibrate the hydrological model. The IGSNRR data were derived by interpolating the 756 official ground stations from the China Meteorological Administration (CMA) into a 0.25º spatial resolution, including precipitation, maximum temperature, minimum temperature and wind speed. More details about the IGSNRR data are provided in Zhang et al. (Citation2014). The amount of 7-day cumulative precipitation of the 1963–8 storm was used to derive the design storm. Specifically, we calculated the maximum 7-day cumulative precipitation for each year from 1952 to 2010, and then generated a sequence that included 59 ensemble members of 7-day total precipitation. Because the 1963–8 flood is viewed as a 50-year event (Yu Citation2010), we derived the design storm with a 50-year return period using Pearson Type-III frequency analysis. To enable daily hydrological modelling, the 50-year design storm (i.e. 7-day total precipitation) was assigned to each of the 7 days following the daily precipitation proportion calculated from the observational IGSNRR data.
Five GCM models were employed – HadGEM2-ES, GFDL-ESM2M, IPSLCM5A-LR, MIROC-ESM-CHEM and NorESM1-M – from the Inter-Sectoral Impact Model Intercomparison Project (ISI-MIPFootnote1 ), which aims to provide a framework for consistently projecting the impacts of climate change across affected sectors and spatial scales (Warszawski et al. Citation2014). The ISI-MIP climate data, for the period 1950–2099, were bias corrected against the 40-year (1960–1999) WATCH forcing data (WFD, Weedon et al. Citation2011) using a trend-preserving statistical approach and downscaled to the daily temporal scale and 0.5° × 0.5° spatial scale (Hempel et al. Citation2013). Here, the daily bias-corrected climate data from these five GCM models under RCP8.5 scenarioFootnote2 , were used to project future changes in extreme precipitation and floods. To enable the future design storm/flood to be directly compared with the historical design storm/flood, we introduced the widely-used delta change (DC) method (Hay et al. Citation2000, Leng and Tang Citation2014) to remove the systematic errors of GCM data relative to IGSNRR data during the overlap period. This method is essential to adjust the monthly observed climate data using a scaling (or shift) factor calculated as the climatological difference predicted by the GCMs for the historic and future periods. In this study, the IGSNRR data from 1952 to 2010 were used as observational reference to derive the 59-year future climate scenarios for the period 2032–2090. Specifically, the projected flux variables (e.g. precipitation) were generated as follows.
where varscale and varobs are the scaled flux variables in the future projected period and the historic observed period, respectively; i indicates each calendar month within a year (i = 1, 2, …, 12); and j indicates the day within each calendar month. is the monthly scaling factor calculated as:
where and
are the monthly mean value for month i over the future projected period (2032–2090) and the historic period (1952–2010), respectively.
In contrast, a shift factor, rather than a scaling factor, was applied to adjust the state variables (e.g. maximum and minimum temperature) for each month.
Using the corrected future precipitation projections, we calculated and extracted the maximum 7-day consecutive precipitation for each year from 2032 to 2090 and then derived the 50-year design storm with the Pearson Type-III frequency analysis. To project the possible most severe situation of flood inundation in the future, only the maximum magnitude of 50-year design storm among the five GCM models was chosen and used for the following analysis.
Hydrological and hydrodynamic modelling
Hydrological model
In this study, the variable infiltration capacity (VIC) model was used for the hydrological modelling (Liang et al. Citation1994). The VIC model is a large-scale, semi-distributed hydrological model, developed based on the soil–vegetation–atmosphere transfer (SVAT) scheme. One distinguishing feature of the VIC model is that both water and energy budgets are resolved at each simulation step. Furthermore, VIC incorporates a statistical parameterization of sub-grid heterogeneity to dynamically represent the infiltration and excess runoff generation schemes. Moreover, the baseflow recession in the VIC model is depicted as a nonlinear process with the so-called ARNO model (Todini Citation1996). To date, the VIC model has been successfully used for hydrological modelling over many large rivers in China (e.g. Zhang and Tang Citation2015, Tang et al. Citation2016, Zhang et al. Citation2017a, Citation2017b).
In this study, the VIC model was calibrated with 6 × 10⁹ m3 upstream flow into the BYD Lake (Han Citation1981) during the 1963–8 flood event. Specifically, we ran the VIC model with IGSNRR data from 1960 to 1963 and removed the first 3-year period as the model spin-up period. The total volume accumulated from the whole BYD region during the period 3–9 August 1963 was calculated and compared with the 6 × 10⁹ m3 observations. Here the relative error Er (%) between the simulated and observed flow volumes was calculated to assess the performance of model calibration as follows:
where and
are, respectively, the simulated and observed flow volumes during the 1963–8 flood event.
It should be noted that there are five large reservoirs located at the upstream of BYD Lake, namely Hengshanling, Koutou, Wangkuai, Xidayang and Angezhuang, with a total storage capacity of 3 × 10⁹ m3 and a total drainage area of 9719 km2. These reservoirs, together with BYD Lake and dike, create an independent flood prevention system (Yu Citation2010). Given that the reservoir parameterization is still not included in the employed VIC hydrological model, this study assesses the protective roles of the reservoirs in flood control by directly removing the 3 × 10⁹ m3 water storage from the VIC simulations.
Hydrodynamic model
The GPU-based, high-performance integrated hydrodynamic modelling system (HiPIMS) is based on a two-dimensional (2D) finite-volume Godunov-type scheme, solving the fully 2D shallow water equations (Equations (6a)–(6d)) and incorporating a Harten-Lax-van-Leer-Contact (HLLC)’s approximate Riemann solver on the basis of a uniform Cartesian grid (Smith and Liang Citation2013, Citation2015). In HiPIMS, non-negative reconstruction of Riemann states is operated incorporating the compatible discretization of slope source term, without any modifications of fluxes and flow variables (clipping treatments) (Liang Citation2010). The friction source term is discretized by a splitting implicit scheme (Liang Citation2010). The explicit scheme is controlled by the Courant-Friedrichs-Lewy (CFL) criterion to maintain the numerical stability. HiPIMS is a robust tool of capability to accurately simulate different flow regimes including shock-like flow discontinuities, to efficiently deal with the complex domain topography and wetting/drying problems, and to represent high roughness value along the flood route.
where η is the water surface elevation (η = zb + h); zb is the bed elevation above datum; h is the water depth; u and v are the depth-averaged velocity components in the x- and y-directions; g is the acceleration due to gravity; ρ is the water density; and
are the bed slope in the Cartesian directions; and τbx and τby denote the bed friction stresses, which can be calculated as follows:
in which the bed roughness coefficient Cf can be evaluated by Cf = gn2/h1/3 and n is the Manning roughness coefficient.
In this study, three flooding scenarios are considered: (1) the historic 50-year flood; (2) the historic 50-year flood with heightened dike of 2 m and reservoirs; and (3) the future 50-year flood with heightened dike of 2 m and reservoirs. The location of inflow, dike and observation points (G1 and G2) are shown in . The grid cells are categorized into dike cells and fluid cells. In scenarios 2 and 3, the bed elevation of dike cell is increase by 2 m. Point G1 is located in the core region of Xiong’an New Area, while G2 is located at the downstream of the dike. In this simulation, the 30-m DEM grid is adopted as the computational mesh containing 5.6 million grid cells. The Manning’s n is set to be 0.020 s m−1/3 in BYD Lake and 0.025 s m−1/3 outside. The simulation is carried out for a 15-day flood event (1–15 August).
Results and discussion
Design storm
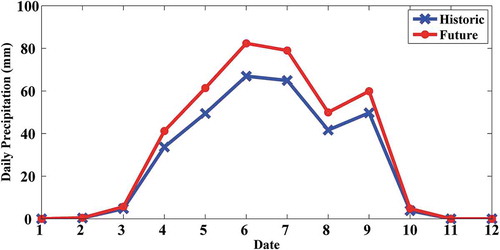
shows the 50-year design storm for the historic and future periods. The basin-averaged daily precipitation before 4 August is less than 10 mm. Thereafter, the daily precipitation amount dramatically increases to around 65 mm on 6 and 7 August, and then gradually decreases till to 10 August. The 7-day cumulative precipitation for 3–9 August is about 311 mm, averaged over the whole BYD region. When it comes to the future design storm, the magnitude is projected to reach 379 mm, which is 1.2 times larger than that in the historic period. This suggests the future extreme precipitation is expected to become more intensive as a result of global warming. Coincidently, the future 50-year flood is likely to be larger than the historic 50-year event.
Figure 2. The 50-year design daily precipitation for historic and future periods.
Model calibration and validation
shows the simulated daily upstream flow entering into BYD Lake during 1–15 August 1963 (taken as “Historic”). Clearly, the flow is relatively stable before 4 August. Coinciding with the extreme storm, the inflow volume began to increase after 4 August, reached a peak on 6 August, and then decreased and stabilized at a certain low value after 10 August. Thus, the period 4–10 August was taken as the “1963–8 flood period”. From the VIC simulations, the total inflow across the BYD region for the period 4–10 August is 6.1 × 10⁹ m3, and the metric Er relative to the observations (6 × 10⁹) is less than 1.5%, suggesting the VIC model, after calibration, can successfully reproduce the flood peak flow over the BYD region.
Figure 3. Total inflow to BYD Lake under the historic and future 50-year design storm scenarios, with and without reservoirs.
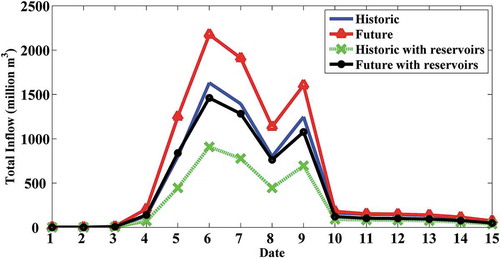
Furthermore, the future total inflow is simulated to be 8.5 × 10⁹ m3 during the 1963–8 flood period. With the effect of upstream reservoirs, the total inflow was decreased to 5.5 × 10⁹ m3 and the historic total inflow dropped to 3.1 × 10⁹ m3 during 1963–8 flood period. The simulated total inflows of the “Historic”, “Historic with reservoirs” and “Future with reservoirs” scenarios were taken as the inflow boundary for the flood scenario simulation.
Flood scenario simulation
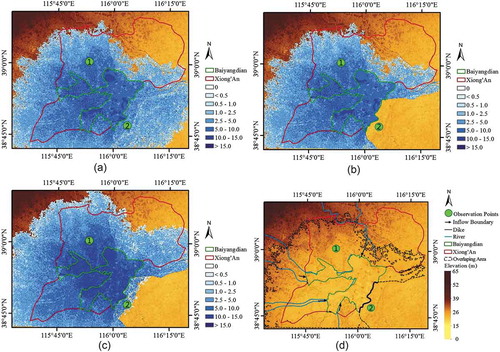
presents a snapshot of the extent of flood inundation on 10 August under the three scenarios (described in the Hydrodynamic model section). The simulation of Scenario 1 reproduced the flood process of the 1963–8 flood and was taken as the benchmark. In Scenario 1, the flood inundation covered the whole BYD Lake area and flooded the core region with an inundation area of 2578.9 km2. The mean and maximum water inundation depths are 2.32 and 17.1 m, respectively. In Scenario 2, the reservoirs effectively reduced the total inflow and the dike successfully protected the downstream region. The mean and maximum water inundation depths under this scenario are, respectively, 1.486 and 16.4 m. Compared with the results under Scenario 1, the flood inundation area is 2018.9 km2 (decreased by 21.7%). In Scenario 3, the flood overflowed the dike with a flood inundation area of 2457.7 km2. The mean and maximum water inundation depths are 2.44 and 17.5 m, respectively, both slightly higher than in Scenario 1. For these three scenarios, the overlapping area of flood inundation extent is about 1975.2 km2, as presented in (the region within the dashed line). This demonstrates that the Xiong’an New Area, except the northeast region, all face a huge flood risk. These analyses show that the dike can effectively prevent the downstream region from flood risk under the historic flood period scenario (Scenario 1), but this positive protection is significantly offset by the projected intensified flood as a result of climate change. This highlights the potential huge effects of climate change.
Figure 4. Flood inundation under: (a) Scenario 1, (b) Scenario 2 and (c) Scenario 3; and (d) the overlapping area.
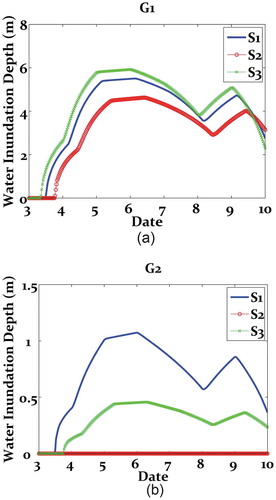
shows the history of water inundation depth at two observation points, G1 at the core region and G2 at the downstream of the dike. At G1, the lowest water inundation depth appeared in Scenario 2 and the flood first arrived in Scenario 3. At G2, the highest water inundation depth and the first arrival of the flood waters both occurred in Scenario 1. These results demonstrate that the southeast dike tends to aggravate flood risk at the core region, even though the dike indeed protects the downstream region.
Figure 5. History of water inundation depth at observation points: (a) G1 and (b) G2 for the period 3–10 August.
Discussion
In this study, we aimed to assess the overland flood risk in the BYD region under the dual effect of climate change and hydraulic engineering. Towards this end, we used five GCMs to generate climate projections of extreme precipitation under the highest greenhouse gas emissions scenario (RCP8.5), and a capable hydrological model to simulate hydrological processes under the climate projections and to project the discharge time series, and then a reliable and efficient hydrodynamic model to model the overland flood inundation and to estimate flood characteristics under the projections of the upstream discharge. Although numerous studies have been published either using GCMs integrated with the hydrological model to investigate the climatic impact on hydrological processes under RCP/IPCC-SRES scenarios (e.g. Mehrotra et al. Citation2013, Reshmidevi et al. Citation2018), or focusing on the application of the combined hydrological-hydrodynamic model in a changing environment (e.g. Zhu et al. Citation2016, Felder et al. Citation2017, Wu et al. Citation2017), it is still a great challenge to handle the discrepancies between spatial and temporal scales in the integrating framework of climatic-hydrological-hydrodynamic model. This work is a preliminary attempt. Further research is ongoing to explore the uncertainty of the integrated framework and the downscaling/upscaling method (Liu et al. Citation2017).
As a result of the limitation of historic gauging data in the BYD area, we used the recorded 6.1 × 10⁹ m3 total upstream inflow into BYD as the calibration criterion of the hydrological model. Given that the VIC model has been successfully applied to simulate hydrological fluxes and states in China (e.g. Zhang et al. Citation2014) and the upstream inflow into BYD was well constrained by the observations during the historical flood event, the VIC simulations should be able to demonstrate the hydrological discrepancies under the different climatic scenarios. In addition, the hydrodynamic model has been successfully adopted to assess the anthropogenic impact, such as land-use/cover change, in the ungauged region (e.g. Wang et al. Citation2013, Yang et al. Citation2016). Hence, we have confidence in the represented discrepancies of the overland flood simulation affected by the reservoir and dike in the present study.
Conclusions
Climate change and artificial flood-prevention structures are both vital for the flood risk assessment and management. This study implemented GCMs to project an extreme heavy storm (extreme precipitation), and used a hydrological model to simulate the upstream inflow under the RCP8.5 climate change scenario; we used an advanced hydrodynamic model to simulate the flood inundation characteristics (flooded area, mean and maximum water inundation depth and arrival time). The flood risk assessment under three different scenarios of various climatic and anthropogenic factors can be summarized as follows:
Changes in extreme precipitation and total inflow: The magnitude of the future design storm is 1.2 times larger than that in the historic period, and the future total inflow is 1.5 times larger than that in the historic period. This suggests that a warmer climate will lead to more intensive extreme precipitation and runoff.
Changes in flood inundation characteristics: The smallest and largest flood inundation areas occurred in Scenario 2 and Scenario 1, respectively, and the highest mean and maximum water inundation depth were seen under Scenario 3. The shortest flood arrival time at the core region (G1) appeared in Scenario 3 and the shortest flood arrival time at the downstream of the dike (G2) occurred in Scenario 1. These results demonstrate that the impacts of climate change on flood inundation characteristics are highly sensitive to local terrestrial change, especially to the artificial flood prevention engineering.
Flood risk assessment and implication: Generally, the flood risk is relatively high in the local district of the BYD area under future climate change scenarios. In particular, the core region of Xiong’an New Area is prone to high flood risk. These assessment results raise an urgent need to plan a climate resilient city for the Xiong’an New Area. This study implies that flood adaptation strategies should be considered jointly with climate change and urbanization (local artificial construction and socio-economic development). We need to further develop interdisciplinary scientific methodology towards the issue of flood risk under changing climate and rapid urbanization.
Disclosure statement
No potential conflict of interest was reported by the authors.
Additional information
Funding
Notes
2 Representative concentration pathway, based on a possible value of radiative forcing of 8.5 W/m2 in the year 2100 (Fifth Assessment Report of the Intergovernmental Panel on Climate Change; http://www.ipcc.ch).
References
- Asadzadeh, M. and Tolson, B., 2013. Pareto archived dynamically dimensioned search with hypervolume-based selection for multi-objective optimization. Engineering Optimization, 45 (12), 1489–1509. doi:10.1080/0305215X.2012.748046
- Bergström, S., 1995. The HBV model. In: V.P. Singh, ed. Computer models of watershed hydrology. Highlands Ranch, CO: Water Resources Publications, 443–476.
- Bouwer, L.M., 2013. Projections of future extreme weather losses under changes in climate and exposure. Risk Analysis, 33 (5), 915–930. doi:10.1111/j.1539-6924.2012.01880.x
- Chen, J., et al., 2017. Assessing changes of river discharge under global warming of 1.5º and 2º in the upper reaches of the Yangtze River Basin: approach by using multiple-GCMs and hydrological models. Quaternary International, 453, 63–73. doi:10.1016/j.quaint.2017.01.017
- Chen, Y., et al., 2011. Liuxihe model and its modelling to river basin flood. Journal of Hydrologic Engineering, 16, 33–50. doi:10.1061/(ASCE)HE.1943-5584.0000286
- Chen, Y., Li, J., and Xu, H., 2016. Improving flood forecasting capability of physically based distributed hydrological model by parameter optimization. Hydrology and Earth System Sciences, 20, 375–392. doi:10.5194/hess-20-375-2016
- Crooks, S.M., et al., 2000. EUROTAS (European river flood occurrence and total risk assessment system) final report [online]. Task T3: Thames Catchment Study, EU Contract ENV4-CT97-0535, 84. Available from: https://scholar.google.com/scholar?q=EUROTAS%20,%20Final%20Report%20Task%20T3:%20Thames%20Catchment%20Study%20%20EU%20Contract%20ENV4-CT97-0535
- De Roo, A.P.J., Wesseling, C.G., and Van Deurzen, W.P.A., 2000. Physically-based river basin modelling within a GIS: the LISFLOOD model. Hydrological Processes, 14, 1981–1992. doi:10.1002/1099-1085(20000815/30)14:11/12<1981::AID-HYP49>3.0.CO;2-F
- Dominguez, F., et al., 2012. Changes in winter precipitation extremes for the western United States under a warmer climate as simulated by regional climate models. Geophysical Research Letters, 39 (5), 0874. doi:10.1029/2011GL050762
- Duan, Q., Sorooshian, S., and Gupta, V.K., 1994. Optimal use of the SCE-UA global optimization method for calibrating watershed models. Journal of Hydrology, 158 (3–4), 265–284. doi:10.1016/0022-1694(94)90057-4
- Felder, G., Zischg, A., and Weingartner, R., 2017. The effect of coupling hydrologic and hydrodynamic models on probable maximum flood estimation. Journal of Hydrology, 550, 157–165. doi:10.1016/j.jhydrol.2017.04.052
- Field, C.B., et al., 2012. Managing the risks of extreme events and disasters to advance climate change adaptation. Special Report of Working Groups I and II of the Intergovernmental Panel on Climate Change (IPCC). Cambridge, UK: Cambridge University Press.
- Fu, G., Kapelan, Z., and Reed, P., 2012. Reducing the complexity of multi-objective water distribution system optimization through global sensitivity analysis. Journal of Water Resources Planning and Management, 138 (3), 196–207. doi:10.1061/(ASCE)WR.1943-5452.0000171
- Galland, J.C., Goutal, N., and Hervouet, J.M., 1991. TELEMAC: a new numerical model for solving shallow water equations. Advances in Water Resources, 14 (3), 138–148. doi:10.1016/0309-1708(91)90006-A
- Graham, D.N. and Butts, M.B., 2006. Flexible, integrated watershed modelling with MIKE SHE. In: V.P. Singh and D.K. Frevert, eds. Watershed models. Highlands Ranch, CO: Water Resources Publications, 245–272.
- Han, J.T., 1981. A brief introduction of “63.8” large flood event over Hai River basin (in Chinese). Hydrology, (5), 56–59.
- Handmer, J., et al., 2012. Changes in impacts of climate extremes: human systems and ecosystems. In: C.B. Field, et al., ed. Managing the risks of extreme events and disasters to advance climate change adaptation. Special Report of Working Groups I and II of the Intergovernmental Panel on Climate Change (IPCC). Cambridge, UK: Cambridge University Press, 231–290.
- Hay, L.E., Wilby, R.L., and Leavesle, G.H., 2000. A comparison of Delta Change and downscaled GCM scenarios for three mountainous basins in the United States. Journal of the American Water Resources Association, 36 (2), 387–397. doi:10.1111/j.1752-1688.2000.tb04276.x
- Hempel, S., et al., 2013. A trend-preserving bias correction - the ISI-MIP approach. Earth System Dynamics, 4, 219–236. doi:10.5194/esd-4-219-2013
- Hervouet, J.M. and Van Haren, L., 1996. Recent advances in numerical methods for fluid flows. In: M.G. Anderson, D.E. Walling, and P.D. Bates, eds. Floodplain processes. Chichester, UK: Wiley, 183–214.
- Hirabayashi, Y., et al., 2013. Global flood risk under climate change. Nature Climate Change, 3, 816–821. doi:10.1038/nclimate1911
- Horritt, M.S. and Bates, P.D., 2001. Predicting floodplain inundation: raster-based modelling versus the finite-element approach. Hydrological Processes, 15 (5), 825–842. doi:10.1002/(ISSN)1099-1085
- Jiang, B., et al., 2017. Evaluation of the economic value of final ecosystem services from the Baiyangdian wetland (In Chinese). Acta Ecologica Sinica, 37 (8), 2497–2505. doi:10.5846/stxb201410091984
- Kollat, J.B. and Reed, P.M., 2006. Comparing state-of-the-art evolutionary multi-objective algorithms for long-term groundwater monitoring design. Advances in Water Resources, 29 (6), 792–807. doi:10.1016/j.advwatres.2005.07.010
- Lai, J.S., et al., 2010. A well-balanced upstream flux-splitting finite-volume scheme for shallow-water flow simulations with irregular bed topography. International Journal for Numerical Methods in Fluids, 62 (8), 927–944.
- Leng, G. and Tang, Q., 2014. Modelling the impacts of future climate change on irrigation over China: Sensitivity to adjusted projections. Journal of Hydrometeorology, 15, 2085–2103. doi:10.1175/JHM-D-13-0182.1
- Li, C.H., et al., 2017. Effects of urban non-point source pollution from Baoding City on Baiyangdian Lake, China. Water, 9 (4), 249. doi:10.3390/w9040249
- Liang, Q., et al., 2008. Flood inundation modelling with an adaptive quadtree grid shallow water equation solver. Journal of Hydraulic Engineering, 134 (11), 1603–1610. doi:10.1061/(ASCE)0733-9429(2008)134:11(1603)
- Liang, Q., 2010. Flood simulation using a well-balanced shallow flow model. Journal of Hydraulic Engineering, 136 (9), 669–675. doi:10.1061/(ASCE)HY.1943-7900.0000219
- Liang, Q., Smith, L., and Xia, X., 2016. New prospects for computational hydraulics by leveraging high-performance heterogeneous computing techniques. Journal of Hydrodynamics, 28 (6), 977–985. doi:10.1016/S1001-6058(16)60699-6
- Liang, X., et al., 1994. A simple hydrologically based model of land surface and energy fluxes for general circulation models. Journal of Geophysical Research, 99 (14), 415–428. doi:10.1029/94JD00483
- Liu, X., et al., 2017. Multimodel uncertainty changes in simulated river flows induced by human impact parameterizations. Environmental Research Letters, 12, 025009. doi:10.1088/1748-9326/aa5a3a
- Logah, F.Y., et al. 2017. Floodplain hydrodynamic modelling of the Lower Volta River in Ghana. Journal of Hydrology: Regional Studies, 14, 1–9.
- Mehrotra, R., et al., 2013. Assessing future rainfall projections using multiple GCMs and a multi-site stochastic downscaling model. Journal of Hydrology, 488, 84–100. doi:10.1016/j.jhydrol.2013.02.046
- Mehrotra, R. and Sharma, A., 2010. Development and application of a multisite rainfall stochastic downscaling framework for climate change impact assessment. Water Resources Research, 46 (7), 759–768. doi:10.1029/2009WR008423
- Meinshausen, M., et al., 2011. The RCP greenhouse gas concentrations and their extension from 1765 to 2300. Climate Change, 109, 213–241. doi:10.1007/s10584-011-0156-z
- Mignot, E., Paquier, A., and Haider, S., 2006. Modelling floods in a dense urban area using 2D shallow water equations. Journal of Hydrology, 327 (1–2), 186–199. doi:10.1016/j.jhydrol.2005.11.026
- Moore, R.J., 2007. The PDM rainfall-runoff model. Hydrology and Earth System Sciences, 11, 483–499.
- Nakićenović, N., et al., 2000. IPCC special report on emissions scenarios. Cambridge, UK and New York, NY: Cambridge University Press, 599.
- Nakićenović, N., et al., 2003. IPCC SRES revisited: a response. Energy and Environment, 14 (2), 187–214. doi:10.1260/095830503765184592
- Orlowsky, B., et al., 2008. A resampling scheme for regional climate simulations and its performance compared to a dynamical RCM. Theoretical and Applied Climatology, 92, 209–223. doi:10.1007/s00704-007-0352-y
- Perrin, C., Michel, C., and Andréassian, V., 2003. Improvement of a parsimonious model for streamflow simulation. Journal of Hydrology, 279 (1–4), 275–289. doi:10.1016/S0022-1694(03)00225-7
- Reshmidevi, T.V., et al., 2018. Estimation of the climate change impact on a catchment water balance using an ensemble of GCMs. Journal of Hydrology, 556, 1192–1204. doi:10.1016/j.jhydrol.2017.02.016
- Reynard, N.S., et al., 2001. The flood characteristics of large UK rivers: potential effects of changing climate and land use. Climate Change, 48, 343–359. doi:10.1023/A:1010735726818
- Seneviratne, S.I., et al., 2012. Changes in climate extremes and their impacts on the natural physical environment. In: C.B. Field, et al., ed. Managing the risks of extreme events and disasters to advance climate change adaptation. Special Report of Working Groups I and II of the Intergovernmental Panel on Climate Change (IPCC). Cambridge, UK: Cambridge University Press, 109–230.
- Smith, L.S. and Liang, Q., 2013. Towards a generalised GPU/CPU shallow-flow modelling tool. Computers & Fluids, 88, 334–343. doi:10.1016/j.compfluid.2013.09.018
- Smith, L.S. and Liang, Q., 2015. A high-performance integrated hydrodynamic modelling system for urban flood simulations. Journal of Hydroinformatics, 17 (4), 518–533. doi:10.2166/hydro.2015.029
- Tan, M.L., et al., 2017. Climate change impacts under CMIP5 RCP scenarios on water resources of the Kelantan River Basin, Malaysia. Atmospheric Research, 189, 1–10. doi:10.1016/j.atmosres.2017.01.008
- Tang, Q., et al., 2016. Hydrological monitoring and seasonal forecasting: progress and perspectives. Journal of Geographical Sciences, 26 (7), 904–920. doi:10.1007/s11442-016-1306-z
- Tang, Q. and Ge, Q., eds., 2018. Atlas of environmental risks facing China under climate change. IHDP/Future Earth-Integrated Risk Governance Project Series. Singapore: Springer.
- Tang, Q. and Oki, T., eds., 2016. Terrestrial water cycle and climate change: natural and human-induced impacts. American Geophysical Union (AGU) Geophysical Monograph Series. Vol. 221. New York, NY: John Wiley & Sons.
- Todini, E., 1996. The ARNO rainfall–runoff model. Journal of Hydrology, 175, 339–382. doi:10.1016/S0022-1694(96)80016-3
- Tolson, B.A., et al., 2009. Hybrid discrete dynamically dimensioned search (HD-DDS) algorithm for water distribution system design optimization. Water Resources Research, 45 (12), 1–15. doi:10.1029/2008WR007673
- Vehviläinen, B., 1994. The watershed simulation and forecasting system in the national board of waters and environment. Publications of the Water and Environment Research Institute, 17, 3–16.
- Wang, Y., et al., 2011. A 2D shallow flow model for practical dam-break simulations. Journal of Hydraulic Research, 49 (3), 307–316. doi:10.1080/00221686.2011.566248
- Wang, Y., et al., 2013. Land use/cover change effects on floods with different return periods: a case study of Beijing, China. Frontiers of Environmental Science & Engineering, 7 (5), 769–776. doi:10.1007/s11783-013-0542-z
- Warszawski, L., et al., 2014. The inter-sectoral impact model intercomparison project (ISI-MIP): project framework. Proceedings of the National Academy of Sciences of the United States of America (PNAS), 111, 3228–3232. doi:10.1073/pnas.1312330110
- Weedon, G.P., et al., 2011. Creation of the watch forcing data and its use to assess global and regional reference crop evaporation over land during the twentieth century. Journal of Hydrometeorology, 12, 823–848. doi:10.1175/2011JHM1369.1
- Wigmosta, M.S., Nijssen, B., and Storck, P., 2002. The distributed hydrology soil vegetation model. In: V.P. Singh and D.K. Frevert, eds. Mathematical models of small watershed hydrology and applications. Littleton, CO: Water Resource Publications, 7–42.
- Wigmosta, M.S., Vail, L.W., and Lettenmaier, D.P., 1994. A distributed hydrology soil vegetation model for complex terrain. Water Resources Research, 30 (6), 665–1679. doi:10.1029/94WR00436
- Wu, B., et al., 2017. Integrated hydrologic and hydrodynamic modelling to assess water exchange in a data-scarce reservoir. Journal of Hydrology, 555, 15–30. doi:10.1016/j.jhydrol.2017.09.057
- Wu, H., et al., 2014. Real-time global flood estimation using satellite-based precipitation and a coupled land surface and routing model. Water Resource Research, 50, 2693–2717. doi:10.1002/2013WR014710
- Wu, H., et al., 2016. Hydrometeorological hazards: monitoring, forecasting, risk assessment, and socioeconomic responses. Advances in Meteorology, 2016, 2367939. doi:10.1155/2016/2367939
- Yamazaki, D., et al., 2011. A physically based description of floodplain inundation dynamics in a global river routing model. Water Resources Research, 47 (4), W04501. doi:10.1029/2010WR009726
- Yang, D., Herath, S., and Musiake, K., 1998. Development of a geomorphology-based hydrological model for large catchments. Annual Journal of Hydraulic Engineering, JSCE, 42, 169–174. doi:10.2208/prohe.42.169
- Yang, X., et al., 2016. Evaluation of the effect of land use/cover change on flood characteristics using an integrated approach coupling land and flood analysis. Hydrology Research, 47 (6), 1161–1171. doi:10.2166/nh.2016.108
- Yin, Y., et al., 2017. Water scarcity under various socio-economic pathways and its potential effects on food production in the Yellow River Basin. Hydrology and Earth System Sciences, 21, 791–804. doi:10.5194/hess-21-791-2017
- Yu, J.Y., 2010. Combined regulations of Baiyangdian Lake and upstream reservoirs for flood controlling over Daqinghe River basin (In Chinese). Water Resources Planning and Design, 5, 14–16.
- Zhang, X., et al., 2014. A long-term land surface hydrologic fluxes and states dataset for China. Journal of Hydrometeorology, 15, 2067–2084. doi:10.1175/JHM-D-13-0170.1
- Zhang, X., et al., 2017a. Soil moisture drought monitoring and forecasting using satellite and climate model data over southwestern China. Journal of Hydrometeorology, 18 (6), 5–23. doi:10.1175/JHM-D-16-0045.1
- Zhang, X., et al., 2017b. On the dominant factor controlling seasonal hydrological forecast skill in China. Water, 9 (11), 902. doi:10.3390/w9110902
- Zhang, X. and Tang, Q., 2015. Combining satellite precipitation and long-term ground observations for hydrologic monitoring in China. Journal of Geophysical Research: Atmospheres, 120 (13), 6426–6443.
- Zhu, Z., et al., 2016. Integrated urban hydrologic and hydraulic modelling in Chicago, Illinois. Environmental Modelling & Software, 77, 63–70. doi:10.1016/j.envsoft.2015.11.014