
 ?Mathematical formulae have been encoded as MathML and are displayed in this HTML version using MathJax in order to improve their display. Uncheck the box to turn MathJax off. This feature requires Javascript. Click on a formula to zoom.
ABSTRACT
The growing availability of smart devices with advanced sensors has increased the opportunities for citizen science applications for environmental monitoring. Accurate and widespread monitoring of river stage is vital for modeling water resources. Reliable data points are required for model calibration and validation in forecast studies. While current embedded monitoring systems provide accurate measurements, the cost to replicate these systems on a large domain is prohibitively expensive, limiting the quantity of data available. This project describes a new method to accurately measure river levels using smartphone sensors. Pictures of the same point on the river’s surface are taken to perform calculations based on the GPS location and spatial orientation of the smartphone. The proposed implementation is significantly more accessible than existing water measuring systems while offering similar accuracy. A case study is performed to evaluate the accuracy and sensitivity of the measurements to changes in distance.
Editor A. Castellarin Guest editor C. Cudennec
1 Introduction
In the light of recent extreme catastrophic events such, as the flooding induced by hurricanes Harvey and Irma, real-time monitoring and prediction of stream levels are as vital as ever. A common strategy to mitigate the impacts of extreme weather events is to enhance resilience at both the individual and community levels. The National Research Council report outlines the importance of the utilization of new technologies to improve monitoring and data acquisition approaches for disaster management and increased resilience (NRC Citation2007). The report highlights how natural disaster forecasts can be enhanced through large-scale sensor networks and advancements in sensor technology. Rich data collection efforts are actively used in validation studies for remote sensing, environmental modeling and informing public (Demir and Beck Citation2009, Demir et al. Citation2009, Citation2015). Recent developments in remote sensing approaches and in situ monitoring of streams induced further advancements in flood forecasting and inundation modeling (Mason et al. Citation2009). Accurate measurement of the surface elevation of a water body (e.g. river, lake, reservoir, and sea) is essential for developing flood forecasting models as well as real-time monitoring of flood-prone areas.
There are various approaches and implementations to measure stream levels developed by academic, commercial, and government organizations. Common stream measurement approaches include pressure, optic, or acoustic based sensor. Kruger et al. (Citation2016) described stream height sensors that utilize sonar signals to determine the distance between the surface of the stream and the sensor. Data transmission is achieved through a cell modem, and the device is solar-powered while being resistant to extreme weather scenarios. For each deployment site, other parameters (e.g. location, elevation, temperature, voltage) are collected to support flood monitoring and forecast. The US Geological Survey (USGS), a federal agency responsible for stream stage measurements, builds and maintains two types of streamflow gaging stations hosted in a small cabin. One type of the stations is equipped with a tube with an opening to the deeper level of the stream, supplied by a gas cylinder. Gas pressure is measured using a manometer and this measurement indicates a correlation with the water body above the opening. Thus, the water level can be assessed relative to a known measurement. A different type of station uses a stilling well to measure the water depth (Buchanan and Somers Citation1996). In addition to stream stage, USGS also estimate discharge and develop rating curves at sensor locations.
Current implementations for river stage measurement are costly to design, deploy, and operate, and require exhaustive installation and deployment processes. Trained staff is often needed on site for deployment and routine maintenance. Moreover, deployed sensors that are accessible by the public are prone to the risk of vandalism. Although their functionality proved to be reliable and durable over long periods of time, new approaches should be developed to enable vast and dense coverage for river stage measurements. As the prevalence of smartphones greatly increased over the past decade, various sensors embedded in smartphones can be utilized to support environmental data collection and analysis. The concept of citizen science promotes the scientific contribution by the public in different ways such as providing computational resources, collecting data and working on manual tasks that require a human (Bonney et al. Citation2009). Given the economic and temporal challenges of deploying and maintaining a sensor network over a vast area (Demir et al. Citation2018), crowdsourcing can prove to be advantageous in providing a complementary approach to achieve comprehensive monitoring coverage with minimal blind spots.
1.1 Prior work
There are several studies using crowdsourcing and smart devices for environmental monitoring (Tauro et al. Citation2018). Camera-based and photogrammetric solutions for estimating water level, object height, water surface extend, topography, discharge and velocity have been studied extensively in the literature (Chandler et al. Citation2008, Lowry and Fienen Citation2013, Young et al. Citation2015, Gleason et al. Citation2015). A common approach for water level estimation is to automate the monitoring of a staff gauge installed on a solid structure that intersects the water vertically using camera-equipped embedded systems (Kim et al. Citation2011, Lin et al. Citation2013). Image processing techniques are used to determine the intersection of the water body with the staff gauge and recognize the numbers from the image. Kim et al. (Citation2011) overcame the challenges introduced by the light reflection by constructing a reflection variation histogram using previous and current images to reveal the boundary between the water surface and the ruler. For conditions at night, images are taken with the help of a flashlight on the camera. Lin et al. (Citation2013) benefited from infrared spotlights and wipers to avoid complications caused by dark or rainy weather conditions. Leduc et al. (Citation2018) utilized a time-lapse camera installed on the ground to monitor a stream and automatically process the video feed to extract the stage and water surface extend. Water level gauging is done by using a staff gauge that is installed on site in addition to the cameras. The proposed method requires a recognizable structure that exists on the stream such as a boulder.
Stereo imaging can be used to generate depth maps by utilizing two cameras looking at the same scene from two different angles. Given that the distance between cameras and their focal lengths are known, epipolar geometry is used to find the corresponding points in two images followed by the calculation of disparity (Mordvintsev and Abid Citation2013). Mrovlje and Vrancic (Citation2008) present a method to use stereoscopic images to understand the distance of a selected object to the camera by benefiting from the technical information such as the displacement of the object between pictures, focal length, and the distance between the cameras. Both stereo imaging approaches only show that objects are at different depths and does not provide quantitative analysis of the actual height of the target.
Momeni-K et al. (Citation2012) outline a method to estimate the height of an object in a picture knowing only the height and pitch angle (with respect to the ground) of a single camera and a vanishing point. The vanishing point does not need to be in the picture taken. It is only required that a vanishing point can be determined. The results of the experiment were accurate at low pitch angles, though higher percentage errors corresponded to higher pitch angles.
The summarized approaches introduce several challenges and limitations as the coverage density and the size of the deployment area increases. Installing devices and/or metrics requires obtaining permission from authorized parties. Some of these approaches require recognizable structures around the monitoring area. As the end goal of these applications is the public use, image processing may become computationally costly considering a large-scale implementation. Server-based approaches suffer from this computational need economically while client-based approaches may jeopardize the user experience which may result in poor user engagement and retention. Furthermore, camera-based solutions for water level assessment introduces an error margin as the scene conditions (i.e. lighting, weather, background, unforeseen events) vary.
This study proposes a novel methodology for water level measurement by introducing geometric solutions that utilize prevalent smartphone sensors. The introduced approach creates a distinct opportunity for citizen science applications by allowing the public to perform and share surveys to power environmental research and decision making. A survey consists of taking a picture of a point of interest (POI) via a dedicated software suite that collects and analyzes real-time smartphone sensor (e.g. GPS sensor, gyroscope, accelerometer, and magnetometer) readings. The framework consists of a mobile application to allow users to perform and save surveys, and a web application as a centralized information system to view and analyze crowdsourced measurements. In the future, augmented reality, as well as gamification techniques, will benefit the mobile application to increase public engagement and retention.
One of the major contributions of this work is the development of a software-based solution to assess the relative position of a real-world point of interest. The approach reduces requirements by eliminating the need for using a staff gauge, recognizable structure, image processing or computations. In this study, our solution is optimized, implemented, and benchmarked for river stage prediction to demonstrate how it can be utilized to augment and complement the existing dedicated and expensive water level measurement hardware through citizen science. The proposed solution can be modified and implemented for various purposes including finding the height and distance of a structure, distance to land from a watercraft, and for any scenarios where the camera-based relative or absolute position inference is desired. Low-cost camera-based embedded systems that automatize the proposed solution can be developed for use in the field.
The remainder of this paper is organized as follows: Section 2 describes the proposed methodology and approaches and discusses challenges associated with different conditions. Section 3 focuses on the mathematical background for the proposed approach and presents its implementation under the framework consisting of a mobile and web application. Section 4 presents a case study along with benchmarks for real-world experiments. Section 5 discusses future work and conclusions.
2 Methodology
We present geometry-based solutions for water level measurement that uses prevalent smartphone sensors rather than requiring specialized devices. Most smartphones possess specialized sensors including GPS, accelerometer, gyroscope, magnetometer, and barometer. Benefiting from the capabilities of sensors embedded in everyday smartphones, five approaches had been developed to estimate water levels using geometric techniques.
2.1 Proposed geometry-based approaches
The proposed approaches are designed for performing surveys with a camera-equipped smartphone that has required sensors (e.g. GPS, gyroscope). Approaches presented in this paper are listed with their sensor and survey requirements in . A survey is performed by taking a snapshot of the sensor readings while aiming the camera at the desired location of measurement (i.e. an intersection of water surface with another feature in the scene). All presented approaches use altitude and pitch angle of the camera from smartphone survey as a common requirement.
Table 1. Requirements for geometry-based approaches.
Approach 1. This approach proposes the construction of a three-dimensional (3D) vector between the camera and the water intersection with the land to estimate the water level. It employs the 3D model of the Earth’s surface using Light Detection and Ranging (LIDAR) data and digital elevation model (DEM) resources, while utilizing pitch and roll angles of the smartphone to create a directional vector that starts from the user’s location. POI can be discovered at the intersection of the user aimed vector and the land surface performing only one survey.
Approach 2. The second approach needs two surveys of the same POI to construct 3D vectors using the roll and pitch angles of the smartphone. The point where two vectors intersect, or have the minimum distance from each other, represents the POI, thus providing the water level relative to the user’s original location.
Approach 3. This approach aims to find the water level by virtually constructing a 2D vector between the camera and the water intersection with a structure. It requires a clearly visible structure (i.e. bridge column, building, etc.) with an even surface and known geolocation that intersects with the water. The geolocation of the structure is retrieved from a database of known locations filtered by a predetermined radius from the user’s location. Once it is available, a 3D vertical vector with infinite height (i.e. the size of points on the y-axis) is constructed using only the latitude and longitude. A 2D plane is distinguished between the vertical infinite vectors of the structure and the user, thus eliminating the need for roll angle. A 2D vector is then generated using the user’s geolocation as the starting point in the direction of the pitch angle of the smartphone. The intersection of these two vectors results in the desired altitude, which, along with the latitude and longitude of the structure, constitutes the 3D point of interest. Thus, one survey is sufficient to estimate the water level.
Approach 4. This approach introduces an addition to Approach 2 to eliminate the need for roll angle. For both surveys, it is assumed that the user’s geolocation will not differ in terms of the x-axis, i.e. will be fixed on point x = a. Furthermore, the POI has to be on the same x = a plane as well. This enables the opportunity to construct a 2D plane in which only the pitch angle will have a role in identifying the altitude of the POI relative to the user’s original location. A practical use case of this approach is to perform surveys in the same location (e.g. window) in a building on different floors.
Approach 5. The final approach requires the construction of three cones as a result of the three surveys of the same POI from different locations independent of the axis of difference. The pitch angle of the smartphone is used as the slope of each unique cone. The intersection of the first two cones yields a circle, which then intersects with the third cone to discover the location of the POI relative to the user’s original location.
2.1.1 Limitations and sensitivity issues
The quality and variety of the sensors offered in smartphones are increasing at a rapid pace. However, certain challenges are introduced when high precision is vital to the application. Some sensors (e.g. magnetometer) are easily disturbed or interfered with by surrounding elements (e.g. metal). Global positioning system (GPS) sensors provide geolocation and time information by receiving information from multiple satellites (i.e. a minimum of four) with known precise locations. GPS sensors do not require an internet connection in order to work and those embedded in smartphones are generally accurate to within a radius of 4.9 m under good environmental conditions (van Diggelen and Enge Citation2015). This accuracy can easily deteriorate in cases of signal blockage, indoor use, and signal reflection, due to surrounding structures and plants. Signal quality can also be affected by the number of available satellites for given time and location, though it constitutes a less likely risk. One method to assess altitude using smartphones is to use GPS to perform geometric calculations by facilitating a reference ellipsoid. However, GPS-based elevation estimates typically have even more error margins compared to latitude and longitude. Altitude can also be determined using the embedded barometer, which measures atmospheric pressure. Without frequent calibration, using atmospheric pressure to calculate altitude can result in inaccurate results, since the pressure is directly affected by the weather condition.
There is extensive research on calculating more accurate orientation (i.e. azimuth, pitch, roll) estimation as the popularity of augmented and virtual reality increases. Accelerometer, gyroscope, and magnetometer sensors provide estimations on acceleration subject to gravity, angular velocity, and the Earth’s magnetic field, respectively. An accelerometer measures the acceleration of the device with reference to its own rest frame, whereas a gyroscope is used to measure the orientation of the device. A magnetometer sensor detects the Earth’s magnetic field along X, Y and Z axes, and can be used to correct other sensor measurements (e.g. accelerometer). Rather than being utilized alone, these sensors can be fused together to complement each other and reduce the noise. Major sensor fusion algorithms include complementary (Euston et al. Citation2008), Mahony (Mahony et al. Citation2008), Madgwick (Madgwick Citation2010), and Kalman (Bishop and Welch Citation2001) filters. Available sensors in the client device and other environmental variables should be considered while selecting a fusion algorithm. Assuming all the sensors provide ideal measurements, mathematical conversions (e.g. calculating geographical distances) and natural obstacles can still cause an error-margin. For example, the accuracy of a magnetometer can easily be affected by nearby electromagnetic components (e.g. antennas, speakers). In such cases, the fusion algorithm should be selected in a way to minimize or eliminate the magnetometer’s involvement to assure maximum accuracy.
Approaches 1 and 2 require the usage of roll angle from the smartphone, which is found to be more prone to provide imprecise readings, while the pitch angle is found to be accurate and provide consistent measurements. Though the first approach requires only one survey, use of a DEM introduces challenges because of its dynamic nature such as erosion, mudslide, and plant growth. The third approach is suitable for places that feature a distinct structure that directly intersects with water (e.g. bridge, building). Furthermore, the dependence of Approach 3 on the absolute position of the surveyor and the fact it requires only one survey makes it more plausible for implementation as a stand-alone, camera-based sensor. Approach 4 requires fewer calculations and surveys than Approach 5 and does not require a known structure nearby; however, it imposes that both surveys and the POI should be on the same x = a plane. Thus, the employment of this method is more reasonable for stand-alone sensors that are deployed on points with the same latitude and longitude, but different altitude, in locations that do not feature a known structure. Approach 5, the 3-cone intersection method, has been chosen because of its minimum requirements, ability for generalization, and suitability for citizen science applications. It is resistant to small differentials in measured values and distance to the point of interest, and can be applied to anywhere in the world without any prior knowledge.
2.1.2 Cone intersection method
In the spherical coordinate system, a point is defined by radius, azimuth, and inclination (r, θ, and ϕ, respectively). Similar to polar coordinates, the radius is the Euclidean distance of the point from the origin, whereas the azimuth is the angle from the x-axis in the x–y plane. Inclination (i.e. polar angle) represents the angle from the positive z-axis to the line segment from origin to point. If the radius is removed from the function, the azimuth and inclination define a vector of infinite length. Additionally, removal of the azimuth allows the polar angle to define an infinite cone. In Cartesian coordinates, the equation of a cone is defined as:
where and
are the x- and y-translation of the vertex (i.e. the point of the cone, apex) and
is the slope of the cone surface. The x- and y-translations are the displacements in the x and y directions of the vertex of the cone. The slope of the cone, c, can be calculated using the pitch angle. It is assumed that the line segment, s, represents the surface of the cone, whereas
represents the pitch angle. Since
is the slope of
, it can be deduced that
. Thus, an infinite cone is uniquely determined by its vertex and its slope. It is known that the target point of interest (POI) lies somewhere on the surface of this cone.
An additional survey is needed on the same point of interest to construct the second cone. Once constructed, the intersection of these two cones, when projected into , can be formulated as:
where ,
, and
are the x-translation, y-translation, and slope of the cone
, respectively. The point of interest now lies in the set
, which defines all the points in
where the two cones have the same z-coordinate.
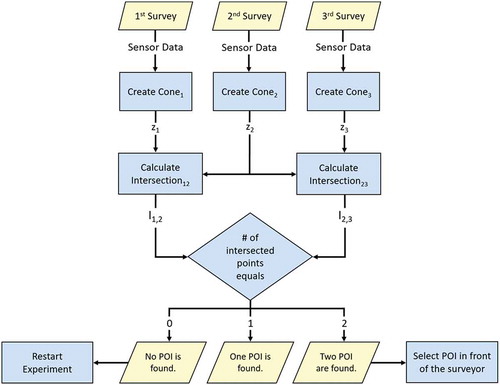
Finally, the third cone is constructed upon a survey of the same POI, and its intersection with the first cone (i.e. ) is calculated as explained above (). This intersection yields the set of all the points where cones 1 and 3 have the same z-value. Then, the intersection of intersected cone pairs (i.e.
) is found (). There are three cases depending on how many points are in the set
: (a)
, meaning that no intersections were found; (b)
, meaning that one potential POI is discovered; and (c)
, meaning that two potential POIs are discovered, in which case the point that is in front of the surveyor is selected as the POI. Once the POI is determined, the height can be found by entering the
and
values of the POI into any of the original cone equations. shows the flowchart for the 3-cone intersection method.
Figure 1. 3D visualization of the 3-cone intersection method.
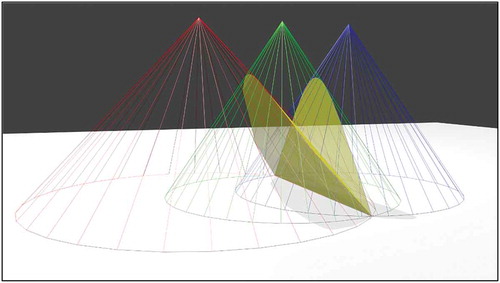
Figure 2. Flowchart for the 3-cone intersection method.
2.2 Implementation
In this study, the 3-cone intersection method is realized as a mobile application to utilize the capabilities of a smartphone along with a web-based system for data management. Both the mobile and web applications are fully developed and currently in beta phase. Application will be publicly released after the quality and stability of the application have been tested and assured.
2.2.1 Smartphone application
A mobile application (Android) is developed to implement the 3-cone intersection method that gathers and optimizes all required sensor readings while facilitating the survey process (). Android is an open-source mobile operating system that enables application development using an integrated development environment (IDE) that contains the necessary tools (i.e. Android SDK) to create, compile, and package smartphone applications. The prototype is deployed and tested on a smartphone. The application is written in Java script and requires several permissions (i.e. access_fine_location, camera, write_external_storage, read_external_storage, internet, access_network_state) to be granted in order to function properly. The application requires the smartphone to be equipped with a camera, an inertial measurement unit (IMU), and a receiver for at least one global navigation satellite system (e.g. GPS, GLONASS, Galileo). Today, virtually any device that is categorized as a smartphone comes with these capabilities by default.
Figure 3. Screenshots of the smartphone application for the initial two surveys.
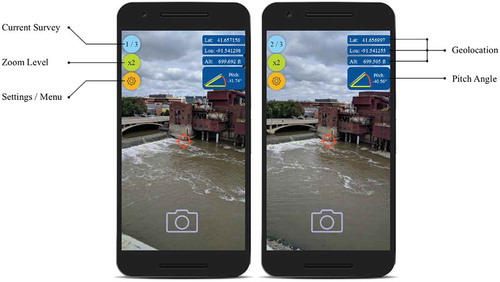
The 3-cone intersection approach expects various parameters (i.e. pitch angle, latitude, longitude, altitude) from the smartphone sensors. Pitch angle is calculated using the getRotationMatrix method in conjunction with getOrientation method in Android API Level 22. The getRotationMatrix method processes the readings from both accelerometer and magnetometer to compute the rotation matrix with respect to the magnetic North Pole. Then, the device orientation (i.e. pitch, azimuth, and roll angles) is calculated in radians using the rotation matrix. Latitude, longitude, and altitude are retrieved using the Fused Location API while setting the priority to high accuracy. Choosing between network or GPS helps to achieve better precision results as location sources are not consistent for each location (Location Strategies Citation2018). If available, altitude is expressed in meters above the WGS 84 reference ellipsoid.
In order to simplify the surveys for users, several features are implemented in the application. Independent of the smartphone model, a crosshair is shown at the center of the screen for the user to aim to the POI accurately. In case the POI is far or not seen clearly, zooming capability is added along with the auto-focus feature. To allow flexibility to the user for different scenes, where applicable, both rear and front cameras can be used. It should be noted that the application does not actually use the taken images, rather uses the sensor measurements that have been recorded while the picture is being taken. Thus, the quality and content of the survey pictures are extraneous when calculating the water level.
A remote database (i.e. PostgreSQL) is utilized through a REST-based web service to communicate with the smartphone application. Photos along with associated sensor parameters are saved to the database for future reference in case visual evaluation by an expert is needed. A relational database allows recorded surveys to be indexed and displayed on an interactive map environment using an existing web-based information system, e.g. the Iowa Flood Information System (Demir and Krajewski Citation2013, Krajewski et al. Citation2017).
2.2.2 Web-based application
A stand-alone web-based application is developed for visualization, management, and analysis of crowdsourced stream level measurements. The system consists of a map that displays the geolocations of the measurements along with a panel to show pictures of each survey, associated river and community information, trends in the previous measurements, and conventional sensor readings if any are available (). Additionally, the measurements that are performed close to each other in terms of time are averaged to compensate for the error rate introduced by the calculations and user error.
Figure 4. A web-based system for visualization and management of crowdsourced survey locations serving as virtual sensors.
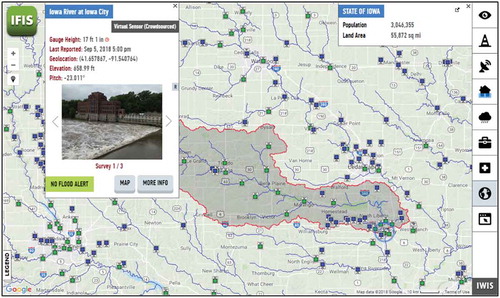
The web-based system allows members of the public and decision makers to access crowdsourced stream surveys with other map and data resources, thus providing an opportunity to see the data in the proper context. Where numerical survey results alone do not provide sufficient information, users can visually evaluate the survey photos and cross-check values. The system is capable of answering voice-enabled natural language questions for public and experts to easily access and analyze the presented data (Sermet and Demir Citation2018). Researchers can utilize the system to further develop and advance forecast models. The community can also benefit from the web interface to monitor their place of interest without being restricted to the limited sensor locations.
2.3 Case study
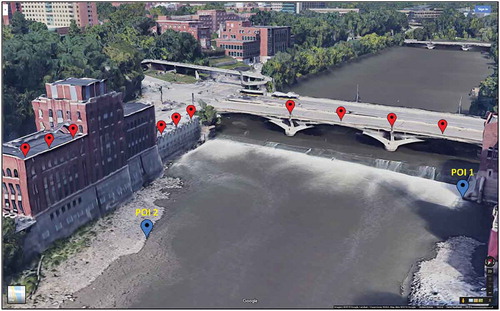
A case study is performed by surveying the same river location from different survey points in Iowa City, Iowa. Survey locations include a bridge, a patio, and a rooftop of a nearby building; these are listed in along with their corresponding geolocations, and are visualized in . The survey location already hosts a USGS stream stage sensor that provides stage values, thus allowing for cross-checking the flood forecasting model outputs (Sit and Demir Citation2019). Some survey locations have features (e.g. metal bridge fences) that are prone to interfere with the smartphone’s sensor readings at a minimal level, which will be neglected. Though the surveys are collected during the daytime, the accuracy of the employed method is not affected by night conditions, since the method does not use the actual picture, rather it uses the sensor readings. Each survey is recorded to the database, including the actual photo, current date and time, retrieved geolocation, and pitch angle. Photos are taken using an Android-based smartphone (Google Nexus 6P). The goal of this case study is to demonstrate the real-life application of the proposed approach. It does not comprehensively study the effects of using different mobile phones and tolerance to user error. The size and other parameters of the surveyed river are trivial to the measurement, because the presented approach calculates the geolocation of the POI which represents the water level due to the surveyor’s aim.
Table 2. Case study survey points and their geolocations. See also .
Figure 5. Visualization of each survey point introduced in by 3D map. The red pinpoints show the survey points and the blue pinpoints indicate the POIs.
3 Results and discussion
3.1 Surveys and measurements
An experiment is performed to evaluate performance while taking the different distances, altitudes, and angles into account. shows, for each test, the survey points, their distances from the POI, pitch angle of the smartphone with respect to the magnetic North Pole, the resulting estimation of the POI’s altitude (i.e. water surface), actual altitude of the POI, and observed error (i.e. the difference between the estimated and actual altitudes in meters). For each test, a total of three pictures are taken, each from a different survey point. Test 3 is performed for POI 2, while the rest of the tests were performed for POI 1. Pitch angle is crucial in the calculation of the stage. For accurate estimation, pitch angle should be unique, i.e. it should not be the same for any two surveys.
Table 3. Surveys and sensor measurement for different points of interest (POI).
According to the analysis, observed errors for surveys that have a distance of 60 m or less between the user and the POI are negligible in deeper water bodies; however, they can be deflective in shallow rivers and lakes. It can be observed from the results that the error rate increases as the distance between the measurement location and the target POI increases. Furthermore, once the distance from the POI crosses a certain threshold, the application fails to estimate the water level due to the amplified error rate. In terms of comprehending the effects of the altitude in measurements, Tests 2 and 3 prove to be useful, since the average distance of their survey points to their POIs are similar. The accuracy weakens as the altitude increases, although a definitive argument cannot be made about whether the reason for the decrease in accuracy is merely the change in altitude, since it may simply be because of the aiming difficulty.
3.2 Sensitivity analysis
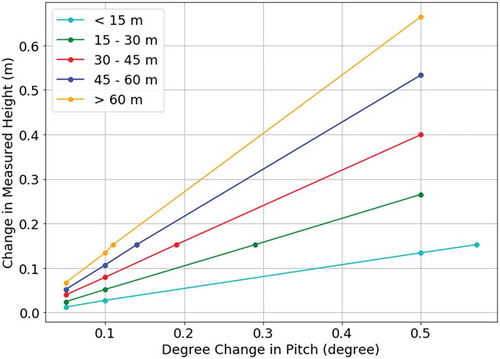
The accuracy of the calculations is affected by several parameters. Examining the surveys and measurements, it is discovered that the further away from the POI the user is, the more pronounced the changes in measured height as a function of the change in measured pitch become. summarizes the sensitivity of height calculation using the 3-cone intersection approach by showing how much error there can be in the water level measurement depending on the error in the pitch angle, considering the distance of user to the POI. Sensitivity is calculated for only one survey, while having the precise location of the POI and the point of measurement. Thus, the resulting values demonstrate the sensitivity of the method mathematically and do not take user error into account. shows the tolerance of the 3-cone intersection method by calculating the required degree change in pitch to create a 0.15 of offset in the result, assuming a 0.15 m of error in measured height (water stage) is acceptable for monitoring purposes. As the average error margin of the pitch angle measurement with smartphones can have a root mean square (RMS) value of less than 0.3° (Mourcou et al. Citation2015), the error rate introduced to the height measurement is negligible for shorter distances. However, as the surveyor gets further away from the POI, the error in pitch angle has a stronger effect on the error in the resulting water level measurement.
Figure 6. Combined analysis of accuracy and tolerance of the 3-cone intersection method.
4 Conclusions and future work
This paper provides an overview of a generalized water level measurement framework using smartphones, several crowdsourced data acquisition methods, its functionality and role in environmental research and decision-making processes, as well as mobile and web-based implementations of the system. Several geometry-based approaches are presented for the measurement of stream stage by employing the prevalent sensors in smartphones, and demonstrates how the general public can participate in citizen science efforts to collect spatially and temporally dense stream data. As opposed to conventional approaches, this system allows water level gauging without relying on the design, deployment, and maintenance of dedicated hardware. A mobile application is developed to allow citizens and scientists to perform surveys easily. The storage of crowdsourced measurements is structured to allow integration with web-based systems for visualization, management, and analysis. A case study is introduced in which the implementation and performance of the presented framework are demonstrated. The results have been benchmarked against USGS stream stage sensors and are confirmed to provide comparable measurements to actual water stage measurements.
The error margins reported in the case study can be considered higher than acceptable ranges to support rigorous hydrological modeling. However, the presented approach does provide a fair assessment of the water levels, which is especially valuable for areas that lack sensor coverage. Such areas can be better monitored and evaluated by decision-makers, authorities and scientists using the proposed approach. Furthermore, as the number of crowdsourced measurements increases for a location, the aggregated error margin is expected to decrease.
The accuracy of the application merely depends on the accuracy of the sensors. These sensors are developing at a rapid pace due to the enormous market demand for smartphones, virtual and augmented reality devices, and map-equipped vehicles. For instance, the Federal Communications Commission (FCC) in the USA recently approved the usage of the European Galileo global navigation satellite system (European GNSS Agency Citation2018). This agreement is estimated to bring the positioning accuracy from an average of 4.9 m to an average of 0.9 m in the USA (Horwitz Citation2018). Most smartphones are already equipped with the hardware to benefit from this substantial improvement without any action. This tangible example serves as proof of the speed of sensor technology advancements. The 3-cone intersection approach and the mobile application do not need any modifications to benefit from the sensor advancements. This means that the accuracy of the water level measurements will potentially get better over time with the proposed changes by FCC.
The effectiveness of any citizen science framework relies on the continuous participation of the public. As a future work, gamification techniques can be incorporated into the mobile application to drive user engagement. These techniques can include recognizing user achievements relative to others through points and badges, ranking users through leaderboards, and offering achievable challenges. The rewarding mechanism can provide the opportunity for promotion of the application by authorities and interested parties in case data collection is required. Augmented reality (AR) can be utilized to help users to perform surveys more accurately, as well as to increase its appeal. On-site AR beacons can be used to calculate the relative location and displacement between surveys. AR aiming markers that are mounted on site to be within the camera frame during the survey (e.g. on a window) can be used to increase the accuracy of sensor readings (e.g. pitch angle, geolocation). Automation of the proposed approach can be achieved using a camera-based embedded system via image recognition and machine learning. Pictures taken by each survey can further be analyzed to detect flooding and other useful features utilizing deep learning methods. The presented geometry-based approaches can be adapted to provide solutions to different problems where a software-based assessment of the position of a point of interest is required.
Disclaimer
Mention of any brand name in no way implies recommendation of a particular manufacturer or product.
Acknowledgements
This project is based upon work supported by the Iowa Flood Center and the University of Iowa.
Disclosure statement
No potential conflict of interest was reported by the authors.
References
- Android Developers, 2018. Location strategies [online]. Available from: http://developer.android.com/guide/topics/location/strategies [Accessed 17 October 2018].
- Bishop, G. and Welch, G., 2001. An introduction to the Kalman filter. Proc of SIGGRAPH, Course, 8 (27599–3175), 59.
- Bonney, R., et al., 2009. Citizen science: a developing tool for expanding science knowledge and scientific literacy. BioScience, 59 (11), 977–984. doi:10.1525/bio.2009.59.11.9
- Buchanan, T.J. and Somers, W.P., 1996. Discharge measurements at gaging stations [Online]. Reston, VA: U.S. Geological Survey Techniques of Water-Resources Investigations, ch. A8. Available from: http://pubs.usgs.gov/twri/twri3a8/
- Chandler, J.H., et al., 2008. Measuring a dynamic and flooding river surface by close range digital photogrammetry. Beijing, China: International Society for Photogrammetry and Remote Sensing.
- Demir, I., et al., 2009. Information systems and social legitimacy scientific visualization of water quality. In: Systems, man and cybernetics, 2009. SMC 2009. International conference on IEEE. San Antonio, TX: IEEE, 1067–1072.
- Demir, I., et al., 2015. Data-enabled field experiment planning, management, and research using cyberinfrastructure. Journal of Hydrometeorology, 16 (3), 1155–1170. doi:10.1175/JHM-D-14-0163.1
- Demir, I., et al., 2018. FLOODSS: Iowa flood information system as a generalized flood cyberinfrastructure. International Journal of River Basin Management, 16 (3), 393–400. doi:10.1080/15715124.2017.1411927
- Demir, I. and Beck, M.B., 2009. GWIS: A prototype information system for Georgia watersheds. In: Georgia water resources conference: regional water management opportunities. Athens, GA: UGA.
- Demir, I. and Krajewski, W., 2013. Towards an integrated flood information system: centralized data access, analysis, and visualization. Environmental Modeling and Software, 50, 77–84. doi:10.1016/j.envsoft.2013.08.009
- The European Global Navigation Satellite Systems Agency, 2018. FCC approves use of galileo in the U.S. Press Release [Online]. Available from: https://www.gsa.europa.eu/newsroom/news/fcc-approves-use-galileo-us
- Euston, M., et al., 2008. Complementary filter for attitude estimation of a fixed-wing UAV. In: Proceedings of the IEEE/RSJ International Conference on Intelligent Robots and Systems (IROS), 22–26 September 2008 Nice, France.
- Gleason, C.J., et al., 2015. Semi-automated effective width extraction from time-lapse RGB imagery of a remote, braided Greenlandic river. Hydrology and Earth System Sciences, 19 (6), 2963. doi:10.5194/hess-19-2963-2015
- Horwitz, J., 2018. FCC lets U.S. phones access EU satellites for 3-foot location accuracy. Venture Beat [Online]. Available from: https://venturebeat.com/2018/11/16/fcc-lets-u-s-phones-access-eu-satellites-for-3-foot-location-accuracy/
- Kim, J., Han, Y., and Hahn, H., 2011. Embedded implementation of image-based water-level measurement system. IET Computer Vision, 5 (2), 125–133. doi:10.1049/iet-cvi.2009.0144
- Krajewski, W.F., et al., 2017. Real-time flood forecasting and information system for the state of Iowa. Bulletin of the American Meteorological Society, 98 (3), 539–554. doi:10.1175/BAMS-D-15-00243.1
- Kruger, A., et al., 2016. Bridge-mounted river stage sensors (BMRSS). IEEE Access, 4, 8948–8966. doi:10.1109/ACCESS.2016.2631172
- Leduc, P., Ashmore, P., and Sjogren, D., 2018. Stage and water width measurement of a mountain stream using a simple time-lapse camera. Hydrology and Earth System Sciences, 22 (1), 1–11. doi:10.5194/hess-22-1-2018
- Lin, F., et al., 2013. Applications of image recognition for real-time water level and surface velocity. In: 2013 IEEE international symposium on multimedia (ISM). Anaheim, CA: IEEE, 259–262.
- Lowry, C.S. and Fienen, M.N., 2013. CrowdHydrology: crowdsourcing hydrologic data and engaging citizen scientists. GroundWater, 51 (1), 151–156. doi:10.1111/gwat.2013.51.issue-1
- Madgwick, S., 2010. An efficient orientation filter for inertial and inertial/magnetic sensor arrays. Report X-io and University of Bristol (UK), 25, 113–118.
- Mahony, S., Hamel, T., and Pflimlin, J.-M., 2008. Nonlinear complementary filters on the special orthogonal group. IEEE Transactions on Automatic Control, 53, 1203–1218. doi:10.1109/TAC.2008.923738
- Mason, D.C., Bates, P.D., and Dall’Amico, J.T., 2009. Calibration of uncertain flood inundation models using remotely sensed water levels. Journal of Hydrology, 368 (1–4), 224–236. doi:10.1016/j.jhydrol.2009.02.034
- Momeni-K, M., et al., 2012. Height estimation from a single camera view. VISAPP, 1, 358–364.
- Mordvintsev, A. and Abid, K., 2013. Depth map from stereo images [online]. Available from: https://opencv-python-tutroals.readthedocs.io/en/latest/py_tutorials/py_calib3d/py_depthmap/py_depthmap.html [Accessed 17 October 2018].
- Mourcou, Q., et al., 2015. Performance evaluation of smartphone inertial sensors measurement for range of motion. Sensors, 15 (9), 23168–23187. doi:10.3390/s150923168
- Mrovlje, J. and Vrancic, D., 2008. Distance measuring based on stereoscopic pictures. In: 9th international PhD workshop on systems and control: young generation viewpoint. Izola, Slovenia, Vol. 6.
- National Research Council, 2007. Improving disaster management: the role of IT in mitigation, preparedness, response, and recovery. Washington, DC: The National Academies Press. doi:10.17226/11824
- Sermet, Y. and Demir, I., 2018. An intelligent system on knowledge generation and communication about flooding. Environmental Modelling & Software, 108, 51–60. doi:10.1016/j.envsoft.2018.06.003
- Sit, M.A. and Demir, I., 2019. Decentralized flood forecasting using deep neural networks. Arxiv Preprint, 50, 77–84. doi:10.1016/j.envsoft.2013.08.009
- Tauro, F., et al., 2018. Measurements and observations in the XXI century (MOXXI): innovation and multi-disciplinarity to sense the hydrological cycle. Hydrological Sciences Journal, 63 (2), 169–196. doi:10.1080/02626667.2017.1420191
- van Diggelen, F. and Enge, P., 2015. The World’s first GPS MOOC and worldwide laboratory using smartphones. In: Proceedings of the 28th international technical meeting of the satellite division of the institute of navigation (ION GNSS+ 2015). Tampa, Florida, 361–369.
- Young, D.S., Hart, J.K., and Martinez, K., 2015. Image analysis techniques to estimate river discharge using time-lapse cameras in remote locations. Computers & Geosciences, 76, 1–10. doi:10.1016/j.cageo.2014.11.008