
ABSTRACT
Maintaining a positive cost–benefit ratio for hydrologic data collection is challenging for public water management and regulatory agencies given budgetary constraints. We examine and discuss the evolution of a government agency in the last 20 years to identify the best practices for collecting, managing, and disseminating hydrologic data. The best practices include (1) developing in-house field data collection systems and integrating them with commercial, off-the-shelf software for the enterprise database, (2) standardizing hardware and data acquisition software, (3) collaborating with other agencies and tracking their data collection efforts to avoid redundancy, (4) utilizing open-source programming languages for data quality assurance, (5) rationalizing data collection network, and (6) taking a proactive approach with data collection to better prepare for hydroclimatic variability. Transforming data into easily understandable information and its near-real-time dissemination can add value to the data (e.g. providing inundation instead of water level above mean sea level) in the future.
Editor A. Castellarin Guest editor H. Lins
Introduction
Assessing the health of our water resources and quantifying the risk to them in the present and foreseeable future forms the basis of hydroinformatics. The failure to accurately evaluate the condition of water resources stems from multiple reasons, the lack of hydrologic data being one of the most significant ones (Stewart Citation2015). Governmental agencies are increasingly becoming the leaders in managing water around the globe (Ivey et al. Citation2002). With most government water management organizations taking more and more responsibilities, such as making water-use regulations and water-supply planning in addition to flood management in a time when water wars are a reality, it is important that they are adequately equipped with necessary data to make and defend decisions that are scientifically sound and economically feasible. The Southwest Florida Water Management District (SWFWMD) is one of the major water management agencies in the United States (US), and one of five in the state of Florida, with the mandate to protect water resources under its jurisdiction (Ivey et al. Citation2002).
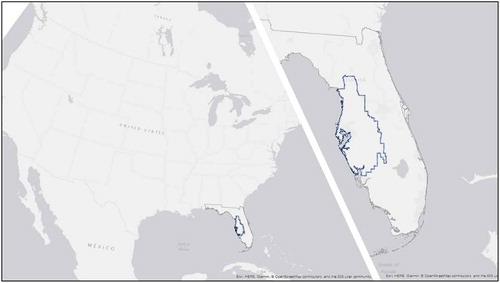
The SWFWMD (), referred to as “the District” herein, was founded in 1961 after the disastrous Hurricane Donna in 1960, which inundated more than 1 million acres (~404 685 ha) of land in west-central Florida causing damages of almost US$29 million (Munson et al. Citation2005). With jurisdiction over approximately 10 000 square miles (2 589 988 ha) in southwest Florida, the District is responsible for meeting the water needs of more than 5 million residents. Although flood control was the major purpose of its creation, the District has evolved in terms of its responsibilities in response to the State Water Resources Act of 1972, a landmark in the history of state water policy (Munson et al. Citation2005). Until the 1990s, preserving water quality was at the center of policy decisions as a result of the Florida Water Quality Assurance Act of 1983, and the Surface Water Improvement and Management Act of 1987. However, in the late 1980s and early 1990s, population growth in coastal areas, saltwater intrusion leading to high localized water demands, and low surface water levels throughout the state led to the importance of water quantity being recognized by the Florida Department of Environmental Protection (Munson et al. Citation2005). These reasons eventually resulted in the passage of the 1997 Water Law. The law clearly defined the need for securing ample water for the future while striking a balance between the needs of consumptive users and the protection of natural resources (Munson et al. Citation2005).
Figure 1. Location of the Southwest Florida Water Management District.
Hydrologic data collection is the key to understanding and characterizing the current condition of a water resource system and its response to the planned usage (Neuman et al. Citation2012, Stewart Citation2015). The importance of the District’s hydrologic data collection responsibilities became even more prominent post-1997. Furthermore, the District has the Tampa-St Petersburg region (TSP) under its jurisdiction. The TSP is ranked among the top 10 metropolitan areas worldwide with the highest value of assets at risk in an event of coastal hazards, such as sea-level rise, hurricanes, tropical storms, etc. Additionally, it is the second-largest metropolitan area in the state of Florida, with a population of approximately 2.9 million (Fu et al. Citation2016). With more than half of the consumptive users under the District’s jurisdiction being concentrated in one region, the District faces significant water-supply challenges, not only to ensure water supply but also maintain the ecological health of its water resources.
The aforementioned reasons make hydrologic data collection within the District boundaries a key to effective current and future management of water resources. The Hydrologic Monitoring Program at the District is authorized by Florida Statute 373.145 of the Water Resources Act:
“In order to aid in the development of a better understanding of the unique surface and groundwater resources of this state, the water management districts shall develop an information program designed to provide information concerning existing hydrologic conditions of major surface and groundwater sources in this state and suggestions for good conservation practices within those areas. The water management districts shall utilize the most efficient means to regularly distribute this information to members of the Legislature, the media, and the public. History. – s. 38, ch. 2002-296; s. 39, ch. 2005-2; s. 7, ch. 2005-36.”
The goal of the Hydrologic Data Section of the District is to provide District staff and the public with cost-effective, accurate, reliable, and timely data for local and regional analyses of the water resources. However, to meet this goal while managing a constrained or shrinking budget requires identification and implementation of cost-effective data collection, management, and dissemination solutions. The main objective of this paper is to illustrate the best practices for hydrologic data collection, management, and dissemination by analyzing the responsive action and subsequent evolution of a public water management organization.
The Hydrologic Monitoring Program
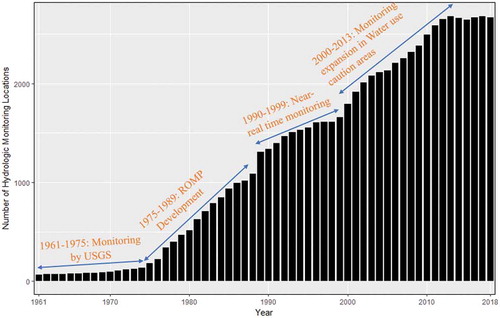
The Hydrologic Monitoring Program (HMP) at the District was initiated in 1974 after the passage of the Water Resources Act of 1972, the first coherent state policy to address the need for multipurpose water planning (Munson et al. Citation2005). The HMP has become increasingly efficient over time, growing in both scope and sophistication in response to regional water management challenges. Early in the program, monitoring was strictly manual, with volunteer observers often supplementing the District’s water-level and rainfall data collection networks. Today, multiple parameters, including discharge, gauge height, water level, and weather-related phenomena, are collected at high temporal frequency via automated technologies. The initial primary function of the HMP was to collect data to support and defend consumptive use permitting. Prior to 1975, the District relied on a joint-funding agreement for data collection with the US Geological Survey (USGS) for groundwater and surface water monitoring (). As the needs for additional data grew, the District began monitoring groundwater. To this end, the regional observation and monitor well program (ROMP) was established (). The ROMP involved creating a basic network of groundwater monitoring wells in a 10-mile gridded system to (a) provide information about the groundwater systems within the District, (b) monitor saltwater intrusion along the coast, (c) identify areas of poor groundwater quality, and (d) install wells for water level and water quality monitoring (SWFWMD Citation2019a).
Figure 2. Sites monitored by the hydrologic monitoring program since the formation of the District in 1961. USGS and ROMP refer to United States Geological Survey and Regional Observation and Monitor Well Program.
Until 1975, the HMP mostly relied on National Weather Service and Florida Division of Forestry for rainfall data. However, lack of rain gauges at desired locations and lack of near-real-time (NRT) data availability led the District to initiate the development of its own rainfall-monitoring network. Additionally, the HMP established a monitoring network for atmospheric parameters for estimating potential evapotranspiration, the highest outgoing flux in the global hydrologic cycle (Long et al. Citation2014).
To address water supply issues, 1978 saw the initiation of the lake-level monitoring program, largely using volunteer observers to provide weekly or monthly water level data, supplemented by a joint funding agreement with the USGS. To identify future monitoring needs, a Data Collection Committee was formed in 1987 and since then, based on the committee’s recommendations, the hydrologic data collection network has been substantially expanded (). Currently, the HMP supports multiple strategic initiatives of the District including hydrologic conditions assessment, flood control and water conservation operations, Florida Department of Transportation wetland mitigation efforts, water use permitting, groundwater modeling, and establishing and reevaluating minimum flows and levels for waterbodies in the District.
Evolution of the Hydrologic Data Monitoring Program
Design, management and implementation of data collection networks and data dissemination for broader enterprises like public agencies are often construed as “routine” (Dozier Citation1992). This assumption usually leads to the reluctant commitment of resources towards improving the data collection and management efforts (Dozier Citation1992). However, in the past three decades, the HMP at the District has expanded, in terms of monitoring locations ( and ) and parameters, technology adoption, and personnel. Three decades ago, the HMP staff was comprised mainly of data entry clerks and field technicians. In 1961, the USGS was responsible for data collection at 72 sites in the District (). The HMP now operates more than 2500 sites ( and ), with a completely automated data-flow system and a technical staff which is a combination of scientists and data analysts, with six out of seven employees holding a master’s degree or higher in a hydrology-related field.
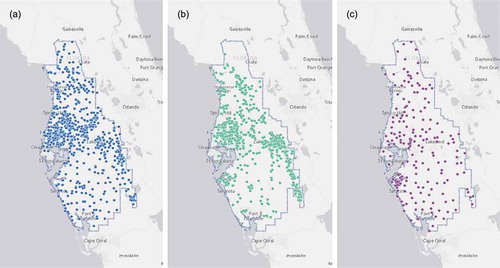
Figure 3. Location of (a) groundwater, (b) surface water, and (c) rainfall monitoring locations in the District.
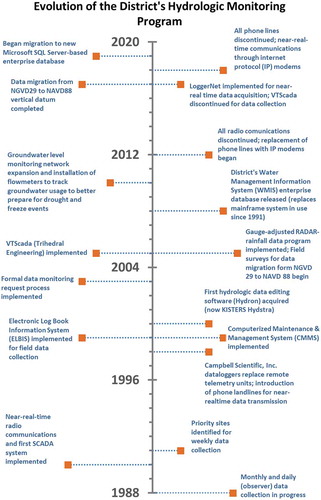
Budgetary restrictions are a reality for most public agencies but the importance of hydrologic data and continuous adaptability to cost-effective data collection and processing techniques has helped the HMP enhance its data collection network over the years (). For example, the HMP’s budget was continuously reduced between 2011 and 2013, yet the number of sites monitored increased from 2595 to 2688, while the cost of data collection decreased by 66% (US$0.06 per data point to US$0.02). The increase in efficiency of data collection can be attributed to the expanded technological capabilities of the HMP in response to the change in District responsibilities (). We categorize the major events characterizing the evolution of hydrologic data collection at the District as a response to change in data collection systems and policies stemming from (a) climatic events, (b) technical and scientific advancements, (c) change in data collection needs; and (d) change in data reliability needs.
Figure 4. Major events characterizing the evolution of the hydrologic monitoring program at the District. SCADA: supervisory control and data acquisition system; NGVD 29 is the National Geodetic Vertical Datum of 1929, and NAVD 88 is the North American Vertical Datum of 1988.
Response to climatic events
Extreme hydroclimatic conditions, such as droughts, often drive water resource management decisions and policy shifts (Abiy et al. Citation2019). Challenges in managing water resources differ throughout the world but the Tampa Bay region provides an ideal example of the complexity of the issues involved, as well as the District’s response to them (Rowland Citation2000). The southeastern United States experienced the second-most severe drought on the record in 2000 and the Tampa Bay-St Petersburg (TSP) area () was one of the most impacted metropolitan areas (NOAA Citation2019a).
Figure 5. The Tampa-St Petersburg metropolitan (TSP) area, Northern Tampa Bay water use caution area (WUCA), Dover-Plant City WUCA, and Southern WUCA.
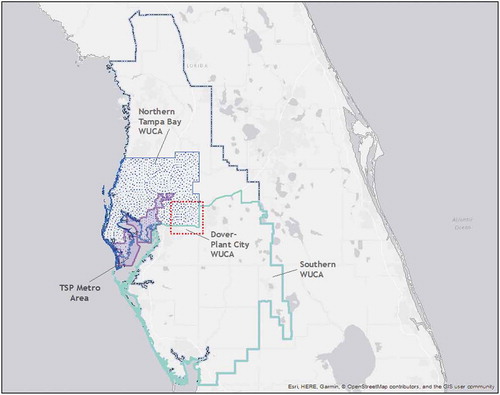
A hub for rapid growth and development, and part of the Northern Tampa Bay Water Use Caution Area (NTBWUCA), the TSP area needed a resources recovery strategy. A “Water Use Caution Area (WUCA)” is an area where regional action is necessary to address cumulative water withdrawals “which are causing or may cause adverse impacts to the water and related natural resources or the public interest” (SWFWMD Citation2019b). Expansion of hydrologic monitoring () through cooperation with Tampa Bay Water (TBW), a regional drinking water utility, was one of the most significant parts of the recovery strategy implemented in the NTBWUCA. The TBW’s hydrologic data collection efforts primarily involved water resource monitoring network around the public supply wellfields, the major withdrawal centers while the District focused on the areas between and beyond TBW’s wellfields. This distributed approach led to a more comprehensive assessment of hydrologic conditions in the NTBWUCA without over-burdening either agency. To put the District’s current hydrologic data collection efforts into perspective, 46% (879) of its groundwater monitoring stations are concentrated in the NTBWUCA.
Another example illustrating the importance of District’s hydrologic data collection efforts is the designation of Southern WUCA (SWUCA; ). Based on a considerable amount of data collected through ROMP (), excessive groundwater abstraction in the southern part of the District was recognized as the reason for saltwater intrusion and reduced surface flows. The District declared the areas of concern as the Southern WUCA (SWUCA; ) in 1992, developed a recovery strategy, and identified priority water bodies in the region.
Climate variability is one of the biggest risks to not only urban landscapes but also agricultural production (Jagtap et al. Citation2002). Given the sub-tropical weather leading to year-round production, Florida is the largest producer of citrus, sugarcane, and tomatoes, and second largest producer of strawberries and watermelons in the nation (FDACS Citation2019). With a value of approximately US$7.46 billion, agricultural losses in Florida due to extreme climatic events are potentially high. Florida is also the largest producer of winter strawberries in the US, contributing over US$1 billion to the State economy (Wu and Guan Citation2015). The main strawberry growing area (Dover/Plant City, ()) spanning 5800 acres in Florida is located just east of the City of Tampa, under the District’s jurisdiction (Aurit et al. Citation2013).
A large part of the water used for strawberry production is dedicated to freeze protection. Farmers apply water to the crop canopy and the heat released by the applied water during the process of freezing protects the strawberry crop (Santos et al. Citation2011). In January of 2010, the temperatures in the Dover/Plant City area dropped below 34° Fahrenheit (F) for 11 consecutive nights, resulting in the pumping of approximately one billion gallons/day compared to the allowable limit of 37 million gallons/day of groundwater for frost/freeze protection (SWFWMD Citation2019c). Excessive pumping of groundwater in a short span of time led to temporary drying of wells and the surface collapse of approximately 140 new sinkholes (SWFWMD Citation2019c). Sinkholes are geologic hazards caused by dissolution of underlying limestone substrate and subsequent ground collapse can lead to extensive damage to infrastructure and underground water supply (Aurit et al. Citation2013). The consequences of the January 2010 freeze events event led the District to realize the need for expansion of the NRT groundwater-level monitoring network, augmented with NRT air-temperature measurements at these wells. The District added 30 NRT groundwater monitoring wells at a cost of approximately US$1 062 000 (US$950 000 for well drilling and construction and US$112 000 for equipment required for NRT monitoring). Additionally, the District declared the Dover/Plant City area as a WUCA () and defined the minimum acceptable aquifer level at a sentinel well in the heart of the region (10 feet above NGVD 29Footnote1). One of the most important lessons learned from the 2010 freeze was the importance of citizen science. Involving the public in citizen science is often challenging because it is a voluntary engagement (Newman et al. Citation2010) and social responsibility is not a ubiquitous trait, especially with regard to natural resource conservation. Not everyone understands his or her “personal” stake in it. Integrating policy-making with citizen science, the District initiated a project to collect groundwater use-data to better assign water-use permit holders’ responsibility for dry wells in the proximity of their permit. To collect the groundwater use-data for individual permittees, the District collaborated with the water-use permit holders in the Dover/Plant City area and required installation of flow-meters and automatic meter reading (AMR) devices. The District funded the purchase and installation of the necessary equipment and also took the responsibility for all ongoing costs associated with the flowmeter maintenance (SWFWMD Citation2019d). Furthermore, funds were allocated to ensure the reliability and availability of the AMR data. Currently, the quality-assured AMR data are available to the District at a daily frequency and are being used by the District’s Regulatory Division to monitor groundwater withdrawals in the region, evaluate water-use permits, and develop long-term plans to further protect groundwater resources in the region.
Another takeaway from the 2010 freeze event was the need to disseminate the groundwater-level data in NRT to staff responsible for enforcing water-use permit regulations. To this end, the HMP developed an application using the “real-time monitor and control” software from Campbell Scientific, Inc. (Logan, UT, USA). The application displays the water levels and drawdowns for all monitoring wells in the region in NRT. The application is not only beneficial to the staff monitoring the drawdowns to alert them when water levels near the maximum drawdown threshold, but also to the District technicians responsible for maintaining the groundwater-level monitoring sensors. In essence, the 2010 freeze event led to the District taking a proactive approach rather than being reactive to future freeze events.
Response to technological and scientific advancements
Given the spatial and temporal variability in the factors impacting water resources (e.g. land use, weather, soil type), hydrology is undoubtedly a data-intensive science. The “big data” concept in the field of hydrology has been fueled by advancements in water resource monitoring, data management, and dissemination technologies. Hydrologic data collected by the District may not be categorized as “big data”; however, the District has embraced new technologies over time for more efficient data management and analyses. Next, we use specific examples to illustrate the adoption of new technologies by the HMP and how they have benefitted the District’s hydrologic data users.
Acquisition of gauge-adjusted RADAR-rainfall (GARR) estimates
Although weather RADAR has been used by meteorologists for short-term forecasts for a long time, its use to define initial conditions in hydrological forecast models has been limited given the high degree of non-reliability (Berg et al. Citation2016). The inaccuracies of RADAR rainfall measurements can stem from non-precipitation echoes and blocking/deflection of the RADAR beam, among other reasons (Berg et al. Citation2016). Rain gauges are considered the most dependable method of rainfall measurement, however, the cost involved in installing and maintaining the rain gauges at a spatial scale adequate to create a uniform dataset for forecasting models can be extremely expensive. The District maintains a rain gauge network of 185 gauges, 141 of which are monitored in NRT. Assuming a uniform spatial distribution, the District would ideally require one rain gauge approximately every 12 km. However, in the real world, the uniformity in the spatial distribution of rain gauges is difficult to achieve for public agencies because (a) the gauge locations are decided based on project needs and (b) it can be difficult to install rain gauges given the surrounding conditions (trees, buildings, site accessibility). To overcome the limitations of the rain gauge network, the District participated with the State’s four other Water Management Districts on a new program to acquire gauge-adjusted radar-rainfall (GARR) estimates (). The goal of this initiative was to create a temporally high-resolution (15-min), spatially uniform, and reliable dataset to support hydrologic modeling, permit compliance, and emergency management. The GARR estimates for the District are generated on a 2 km × 2 km gridded network by calibrating the National Weather Service NexRad RADAR imagery based on correlation with the 15-min gauge data provided by the District. The District receives 15-min GARR data for 17 450 2 km × 2 km cells, including those a few miles outside its jurisdiction. Chang et al. (Citation2018) suggested that a 4 km × 4 km grid size is adequate for the continental United States to capture the rainfall variability. It would cost the District more than US$2 million in additional funds just to install the rain gauges for the 4 km × 4 km recommended cell size. Put in perspective the economic impact of the program, the District allocated US$45 000 (97% less) to acquire the GARR data in the fiscal year 2019.
The District’s decision to invest funds in acquiring GARR data and not solely rely on its rainfall monitoring network has proven to be beneficial and cost-effective. Numerous computer models are utilizing the GARR data to simulate the impact of current and projected water use on water resources within the District’s jurisdictional boundaries. Long-term GARR estimates have also helped to calculate the return period of different storm durations and helped the emergency management personnel to better prepare for and assess local and regional impacts from tropical storms and other extreme rainfall events.
Implementation of electronic log book information system (ELBIS)
At its inception, the HMP monitored fewer than 100 sites and management of manual measurements collected by the field technicians on paper forms was entirely feasible. However, the number of monitoring sites has increased to more than 2500 in the last three decades (). This led to an exploration for a “fit-for-purpose” field data collection software solution. Various proprietary software exist that can aid with field data collection. However, proprietary software can also be expensive and difficult to customize for the specific needs of the data collection organization. These constraints led the HMP to work with a consultant to significantly modify an off-the-shelf software package, for which the rights were then transferred to the existing District technological facilities without any additional expenditure. A customized graphical user interface (GUI) interacts with a Microsoft Access application and the combination of MS Access along with the customized interface is known as the Electronic Log Book Information System (ELBIS). The Access database is created using the site information from the enterprise database and contains all relevant information that the field technicians might need to collect and verify field measurements (e.g. site information, location, or driving directions, etc.). The in-house development of the support applications provided an opportunity for the HMP to (a) easily integrate ELBIS with its data editing software; (b) easily define data validation rules; (c) integrate ELBIS with the enterprise database so it has the period-of-record high and low water levels, providing field technicians another way to eliminate any “outliers”; (d) record any specific comments, requests, or issues regarding monitoring sites; and (e) to get feedback from the “power users” (field technicians) of the application leading to its continued improvement over the years. Given that ELBIS uses a Microsoft product, it is compatible with all tablets, laptops, and desktops using Microsoft Windows as the operating system.
Implementation of LoggerNet for remote telemetry
Remote telemetry for near-real-time (NRT) data collection and the relay is a critical District need for operation of flood control structures. The HMP has used a supervisory control and data acquisition (SCADA) system since 1990. The SCADA system not only collects and relays data in NRT, it also allows authorized users to monitor and remotely control equipment (e.g. pumps, flood control structures, etc.) using a computer. The SCADA system worked for the District’s needs when the operation of the flood control structures was the primary objective of NRT data collection. In 2016, operational efficiencies were identified to leverage and expand the use of existing datalogger software (LoggerNet) into a separate data acquisition system limiting the use of SCADA specifically to the remote operation of water conservation and flood control structures. Campbell’s LoggerNet software is used to configure Campbell dataloggers and the associated networks and is used by technical staff for field operations and troubleshooting.
The HMP conducted a cost feasibility analysis to and decided to expand the use of LoggerNet for remote telemetry because of the following benefits:
No need for a dedicated system administrator. Because of its modular structure, the system was easily distributed for management responsibilities. This was made possible because of three main functional components, namely: (a) LoggerNet Admin datalogger support software for datalogger polling, scheduling, and troubleshooting; (b) LoggerNet database software for moving data from LoggerNet data cache into an industry standard database; and (c) a Microsoft SQL-server database as the industry standard database. A dedicated field technician is able to manage the first two components and the SQL-server was easy to set up and manage by the information-technology staff. The SQL-Server database was easily accessible to the HMP staff for querying and retrieving data. This distributed system allowed the HMP to control the data collection process without a dedicated administrator which saved considerable funds for the District.
Cost-effectiveness of the LoggerNet data acquisition system. The LoggerNet system can reside on different platforms, local hardware, cloud or hybrid cloud. A one-time purchase of the software at US$1720 and the recurring telemetry cost of US$0.099 per MB are the only additional costs incurred. There is no need for annual licensing or support because of no customization requirement. The licensing cost of the SQL-server is US$3800 and, for organizations with smaller data collection needs, SQL-server Express can be utilized cost-free for databases up to 10 GB. To put hydrologic data records and database storage into perspective, approximately 13 million records along with the transaction logs take approximately 5.5 GB of storage. Each record contains a timestamp, measurement value, and a record number.
Single-point source and support. Campbell Scientific, Inc. designs and manufactures the hardware (dataloggers), and authors the software (LoggerNet). This cohesion is extremely beneficial to organizations with standardized data collection networks.
Uncomplicated system redundancy. Elaborate back-up processes are almost always problematic, especially for large networked systems. The LoggerNet system does not need to be backedup. Redundancy can be achieved by simply running a second (or more) instance on any desired platform without creating a separate back-up process.
Vertical datum upgrade
A vertical datum is a surface of zero elevation to which heights of various points are referenced (NOAA Citation2019b). The National Geodetic Vertical Datum of 1929 (NGVD 29), also known as the Sea Level Datum of 1929, had been in use since 1929 for the contiguous United States and Alaska. All of the District’s water level records were expressed relative to NGVD 29. The process to upgrade the datum from NGVD 29 to the North American Vertical Datum of 1988 (NAVD 88) began in 1992 by minimum constraint adjustment of the Canadian-Mexican-United States leveling observations (NOAA Citation2019b). The HMP developed a workplan to upgrade the datum the District used (NGVD 29 to NAVD 88) to provide stakeholders with data of greater accuracy that are comparable with elevation data generated by other state and federal agencies. The workplan included: (a) installing new benchmarks with NAVD 88 elevation; (b) re-surveying all active water-level monitoring locations; and (c) migrating historic NGVD 29 water levels to NAVD 88. In addition, the HMP also worked with the District’s enterprise database managers to create processes which would not only convert the historic data to the NAVD 88 datum but also simultaneously calculate NGVD 29 water levels for current and future data to eliminate the datum inconsistency. This decision to maintain two time series of water levels (one each for NAVD 88 and NGVD 29) helped scientists, engineers, and other water-data users to continue with their analyses and provided an opportunity to compare their findings using the two datums. Apart from the necessary database-related changes, the District invested approximately US$8 million in installing more than 4700 new benchmarks and re-surveying of all active sites. Local governmental agencies within the District’s jurisdiction also coordinated their efforts to lower the overall costs of the process of upgrading to the new NAVD 88 standard. This vertical datum upgrade resulted in better decisions due to much improved data accuracy and consistency, new data tools and seamless data integration between the District and other agencies.
Change in near-real-time communications
The HMP started near-real-time (NRT) radio communications in 1990 with the implementation of the Sierra-Misco SCADA system to collect data for structural control and hydrologic monitoring purposes. Each NRT monitoring site was equipped with a remote telemetry unit (RTU) with a radio modem which would relay the signal from site to site until it reached a radio tower, which would then relay the signal to the SCADA system installed at the District headquarters. This configuration was slow and often unreliable due to multiple factors that impacted the ability of RTUs to transmit the signal (antenna direction, line of sight obstructions, and weather conditions, for example). In 1998, the HMP started replacing the RTUs with Campbell Scientific dataloggers connected to modems and using phone landlines instead of radio towers (). This set-up involved the SCADA system calling (polling) the modems at each site in a sequential order to obtain data from the datalogger. This system too had its drawbacks as phonelines were prone to damage from lightning strikes during storms and were often severed by fallen branches and trees. South Florida has the highest mean annual cloud-to-ground lightning flash densities in the United States (Shukla et al. Citation2006), and this set-up negated the very purpose of NRT communications during events like tropical storms and hurricanes when the data are of utmost need to operate flood management structures. In 2012, to address the shortcomings of telephone lines, the HMP started replacing them with IP (internet protocol) modems to transmit the data via cell towers (). The phone line replacement project successfully culminated in May 2018 with all required data being transmitted from the sites to the District headquarters almost instantaneously through 4G IP modems (). The changes in NRT communications over time not only improved the reliability of data transmission and its efficiency but also greatly reduced the cost (). The current NRT monitoring network of the District utilizes 309 dataloggers. Transitioning from RTUs to Campbell dataloggers led to almost 50% cost savings in hardware for the HMP (). The HMP’s expenditure on radio tower leasing, antenna maintenance and replacement, and Federal Communications Commission (FCC) licensing was approximately $140,000 annually, and if the HMP were still using the radio communications, the cost would be much higher given the increase in NRT monitoring sites and adjustment for inflation. The annual dial-up charges for phone lines were approximately US$100 000/year. The current communication cost for 309 4G IP modems is approximately US$8000/year or less than US$2.15 per month per modem i.e. 94% and 92% less than the cost of using radio and phone line communications, respectively ().
Figure 6. Cost of different telemetry set-ups used by the District. RTU refers to remote telemetry unit.
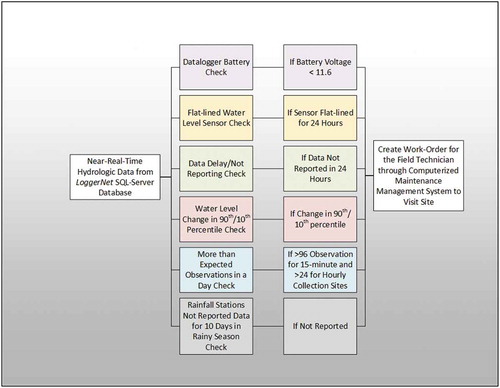
Figure 7. Quality assurance workflow for identifying and rectifying data issues with near-real-time data collected by the District.
Response to ever-increasing data needs
The cost–benefit ratio of hydrologic data collection depends heavily on optimization of the data collection network (Chacon-Hurtado et al. Citation2017). To reduce the collection costs without compromising the amount and quality of hydrologic data, the District has taken a collaborative approach by collecting data in cooperation with other organizations at mutually beneficial locations. Furthermore, the HMP has focused on collecting “fit-for-purpose” data, eliminating duplication of collection efforts by tracking the data collection activities of other organizations, and accordingly adjusting its own collection network by eliminating redundant monitoring locations. A description of the District’s collaborative approach follows.
Collaboration with the United States Geological Survey (USGS)
Since inception, the District has tried to improve its information infrastructure through inter-agency coordination. Data exchange and data collection in collaboration with other regional and federal agencies have always been an important constituent of the District’s strategic plan. The cost of maintaining hydrological networks is increasing (Stewart Citation2015). To absorb the cost without impacting the data collection network, the HMP maintains cooperative data collection agreements with the USGS, a federal agency that maintains the largest network of hydrologic data collection sites in the USA (Blodgett et al. Citation2016). Through cost-sharing with the District, the USGS currently monitors approximately 145 sites to measure for multiple parameters including water levels and surface water flows. The value of hydrologic time series increases with time, i.e. the longer the period of record, the greater the utility of the data (Stewart Citation2015). Some of the USGS records date back to early 1900s in the region and the District has maintained data collection at these sites through cooperation with the USGS, thereby lengthening the period of record and hence increasing the value of the data. The long-term datasets have proven extremely beneficial for evaluating trends in water levels for improved resource management, including flood control and compliance, and developing regulatory minimum flows and levels.
Data collection request system
Estimating the value of hydrologic data before it has been collected or utilized is difficult. It is expected that hydrologic data collection will lead to some service or product, however, that is not always the case. Stewart (Citation2015) identified that one way to make hydrologic data “count” is to collect “fit-for-purpose” data. As the District’s responsibilities expanded over time, so did the data collection needs. The HMP implemented a formal data collection request system (DCRS; ) to fulfill the needs of the end-users while ensuring that the collected data would satisfy the intended purposes. Among other specifications such as monitoring site location, data type, and collection frequency, the DCRS requires the user to enter detailed information (justification) on the expected utilization of the requested data. Using this information, the HMP can identify if another local, state or federal agency is also collecting data at the requested location or in the vicinity. If that is the case, the data already collected are accessed and evaluated for their continued value to the District’s project. All requests are reviewed and must be approved by management for consistency with the District’s project goals. This process eliminates data duplication and ensures that the additions to the ongoing data programs have a business purpose, thus saving the District’s time and money. Implementation of the DCRS has proven to be especially beneficial in eliminating redundancy and ensuring taxpayer-funded programs have adequate oversight.
Rationalizing the data collection network
The cost of installing and maintaining a hydrologic monitoring site is usually the driver for reductions in the monitoring network (Chacon-Hurtado et al. Citation2017). However, the HMP has always rationalized its approach when deciding to stop monitoring hydrologic data at a site. We illustrate the HMP approach via two examples.
Elimination of weather (ET) monitoring network. Keeping track of monitoring activities initiated and maintained by other organizations led the HMP to identify the opportunity to eliminate its evapotranspiration (ET) monitoring network. The Florida Automated Weather Network (FAWN; https://fawn.ifas.ufl.edu/) managed by the Institute of Food and Agricultural Sciences at the University of Florida through various private and public organizations, installs and maintains weather stations to monitor parameters such as relative humidity, air temperature, wind speed, and solar radiation. These parameters are used to estimate potential evapotranspiration (ET), a primary factor determining water availability (along with rainfall) for multiple uses including irrigation management to achieve water constraints while maintaining crop production (Long et al. Citation2014). Weather monitoring sites are expensive to maintain given the number of sensors required to estimate ET and the cost associated with calibration and maintenance of these sensors. With the expansion of the FAWN program, the HMP evaluated the locations of ET monitoring stations, the quality of, and consistency with, FAWN data, identifying the redundancy of its ET monitoring network, which was discontinued in 2014.
Optimization of groundwater level monitoring network. The District initiated a project to optimize its groundwater level monitoring network in 2016. The project stemmed from the need to reduce monitoring costs without impacting the District’s mandate of managing the water resources. Usually, network design methods utilize statistical tools to evaluate and modify an existing system. However, the monitoring sites identified as “redundant” should not be discontinued without investigating their history and purpose of data collection. Therefore, the HMP decided to review the site and data history at all groundwater level monitoring sites identified as redundant after the completion of the groundwater well network optimization project. A redundant well is defined as a groundwater monitoring location where data collection could be discontinued, and the water level data estimated using data from other wells. The HMP developed a “priority index”, which is defined as the degree of impact of discontinuing hydrologic data collection at a redundant site. The index is a function of (a) data usage for issuing water use permits; (b) period of record; (c) physical condition of the well; (d) data quality; (e) the potential use of the well for collecting water quality samples in addition to water levels; (f) ease of access; and (g) number and priority of projects using the data. The “priority index” is used to identify sites which might be statistically redundant but would not be discontinued given their links to ongoing projects.
Response to data reliability needs
Unavailability of data is not the only limitation in evaluating current and predicting the future of water resources. “Data reliability” is often an issue faced by water management professionals because the quantity is of limited use without quality (Campbell et al. Citation2013). The reliability of hydrologic data takes a higher precedence for water management agencies like the District because these data form the basis of policy formulations, water use restrictions, consumptive water use permits, groundwater recovery strategies in stressed areas, and operations of hydraulic structures for flood management. The HMP, over the years, has developed a robust data quality management system by automating report generation, using graphical data editing software, and defining data validation standards before uploading records to the enterprise database. We illustrate here a few examples of the data quality management system of the HMP.
Implementation of Hydstra
The HMP implemented Hydstra (KISTERS North America, Roseville, CA, USA) as the data editing software in 2000 (). Hydstra, formerly known as Hydron, is a proprietary file system optimized for compression and querying data (http://kisters.com.au/hydstra.html). Easily integrable with the District’s telemetry systems at the time (SCADA), Hydstra provided the staff with robust data visualization and editing tools along with numerous data analyses (e.g. baseflow separation, regression) and management applications. One of the most important reasons for implementing Hydstra was to provide the stakeholders and data users with the best possible data and empower the HMP staff to develop their own “business rules” utilizing their knowledge of hydrology without adding the enterprise database and its managers into the equation, thus, saving time and money. In addition, Hydstra acquisition was a result of the need for a data quality management system and better data visualization tools to assist with data validation and editing. An option to define more than 200 data-quality codes in Hydstra led the District to develop a highly customized and robust data quality management system, and the HMP developed a “data quality assurance” metric. The threshold for the conformance of the metric was defined as the measure of success in maintaining hydrologic data quality. The data quality assurance metric involved categorizing all collected hydrologic data in a given time period as “good quality”, “edited”, and “missing”. The threshold conformance was set at 90% for good quality data, and 5% each for edited and missing data. If the set conformance standards are not met, the HMP is required to set up a project plan to identify the issues and rectification measures.
Implementation of computerized maintenance management system (CMMS)
Quality control of data is the highest priority of the HMP. In 1999, the HMP implemented a Computerized Maintenance Management System (CMMS; ) to provide further data quality assurance by ensuring that expensive data monitoring equipment was tracked, maintained and repaired. Every 6 months a preventive work order is issued for every site to make sure that all equipment is kept in optimum working condition and is fully calibrated. Rain gauges are replaced annually with freshly calibrated units. When data fail a quality test through automated checks, this system is used to issue repair work orders to ensure that equipment is only down for the shortest amount of time possible. History is maintained on each piece of equipment to track potential problems and where it has been deployed. In addition, the system provides a method for controlling a large inventory of taxpayer-funded hardware and allows for annual inventory in accordance with the State of Florida audit procedures.
Implementation of quality control processes
Errors in hydrologic data can occur for a variety of reasons including sensor malfunction, transmission failure, manual errors (e.g. incorrect entry in ELBIS), or unforeseen environmental conditions leading to erroneous sensor readings (e.g. equipment failure after being submerged due to high water level after a storm) (Campbell et al. Citation2013, Horsburgh et al. Citation2015). The data quality assurance (QA) processes developed by the HMP consists of scripts which are executed daily to create reports identifying any issues with the data. Although many scientists are unfamiliar with scripting given the lack of their computer science background and expertise (Horsburgh et al. Citation2015), the HMP has encouraged the staff to learn scripting and subsequent automation of data QA processes, thereby increasing the data validation speed in the past decade. The QA workflow in the HMP is a combination of three different processes explained below.
Near-real-time data QA report. Utilizing the R platform, the HMP has developed a script to perform six major checks on the NRT data (). The data are retrieved from the LoggerNet SQL-Server database and the checks are performed daily. The HMP collects approximately 33 000 hydrologic data records every day through remote telemetry. With just 1 h per day dedicated to editing NRT measurements based on the QA report, almost 550 records are validated every minute. Before the automation, the HMP staff dedicated at least 8 h per day solely for the NRT data QA leading to a data validation rate of 69 data records/min, i.e. approximately eight times less than the current rate.
Reset value report. Sensor malfunction is the most common reasons for erroneous data (Campbell et al. Citation2013). Irrespective of the cost and intended accuracy, water level sensors (pressure transducers) deteriorate with age leading to calibration drift (Campbell et al. Citation2013). The calibration drift is the offset of the sensor reading from the original calibration. Given the certainty for the occurrence of the drift, the field technicians of the HMP manually measure the water levels once a month for all sites equipped with pressure transducers and dataloggers. If the drift is greater than the accuracy in the manufacturer specifications, the sensor measurement is reset in the datalogger. Given that the process of taking a measurement at the site, comparing it to the pressure transducer measurement, and calculating the difference between the two is manual, chances of making error greatly increase. Therefore, it is necessary that a check is performed on manual and reset measurements. Once the sensor measurement has been reset, the HMP field technicians enter the information in the Electronic Logbook Information System (ELBIS). An R script retrieves the manual measurements from ELBIS and sensor measurements from the LoggerNet SQL-server database (for sites with remote telemetry) and files downloaded from the dataloggers (for sites without remote telemetry). The difference between the manual and sensor measurements is calculated, and based on the drift threshold, sites where water level value needs to be reset are identified. The site metadata, manual and sensor measurements, and the calculated drift are compiled in a report for the office staff to review. If the sensor measurement was reset correctly, no action is necessary. If the sensor measurement was not reset, the field technician is immediately issued a work order to reset it to avoid the collection of erroneous data. Sensors with repeated drift problems are replaced.
Well pumping and sampling report. The Water Quality Monitoring Program (WQMP) at the District is responsible for collecting and analyzing samples to assess the quality of water. When a WQMP technician collects a water sample from a groundwater well, he or she removes the pressure transducer from the well to lower the intake pipe of the groundwater pump. Removing the sensor from the well leads to a period of erroneous water level data. The HMP has developed an R script to retrieve the sampling logs from the WQMP, identify the wells at which water was pumped, and create a comprehensive report listing the start time, end time, and the duration of the sampling event. This information is then used by the HMP staff to identify erroneous data and qualify the site as being “out of service” for the sampling duration.
Hydrologic data collection and management: the future
Since the inception of the HMP, the District has made multiple strides towards increased accuracy and efficient hydrologic data collection and management. At the same time, the need to keep abreast of technological advancements in water resources monitoring and data management has also been realized. In an effort to keep the HMP up-to-date with technology, identify cost-effective data collection and management solutions, and make the best use of taxpayer funds, the District has planned several projects as described below.
Enterprise database modernization
The Water Management Information System (WMIS) has been the District’s core business application for hydrologic data since 2008. WMIS is a custom-developed, browser-based system for query and retrieval of hydrologic data, built using the Microsoft .Net framework and C# and Oracle© as its database. A customized, web-based user interface was also developed by the District for data query and download. The data management system has worked well for the needs of the District and the data users. However, being a custom application, the upkeep of the system requires significant ongoing investments in technical, personnel and system-related resources to meet rapidly changing technologies, particularly the requirements of mobile platforms. Over time, the need for cost-effective integration with other national and regional databases, and water-data networks such as the Hydrologic Information System (HIS) developed by the Consortium of Universities for the Advancement of Hydrologic Sciences, Inc. (CUAHSIFootnote2; (Blodgett et al. Citation2016)), has also led to the realization that WMIS is nearing the end of its useful life. Furthermore, the need for a commercial off-the-shelf (COTS) software solution has been highlighted by the District’s succession planning efforts. In 2018, after reviewing multiple COTSs water data management systems, the District decided to acquire a Microsoft SQL Server-based system, WISKI (Water Information Systems by KISTERSFootnote3), developed by KISTERS global group of companies. Advantages of WISKI over highly customized WMIS are many, with significant ones are presented in .
Table 1. Comparison between the customized enterprise database used by the District and the commercial off-the-shelf (COTS) database which will be released in Fall of 2019.
Furthermore, a National Water Model (NWM) viewer has been integrated with WISKI. The NWM forecasts are fed to KISTERS’ “big data” technology stack where the forecast data are compared to the federal, state, and local stream gage results (Kopp et al. Citation2018). With the technology of geoprocessing of the Environmental Systems Research Institute (Esri, Redlands, CA, USA), inundation maps are developed, and the enhanced flood forecasts can lead to the reduction in risk of flood-related losses across the USA (Kopp et al. Citation2018). Given the high risk of hurricane storm surge in southwest Florida (Fu et al. Citation2016), an enhanced forecast can prove especially useful for making wise emergency management decisions within the District. A dedicated technical support team at KISTERS, continuous improvement of the software, an already existing web-based user interface, and cost-savings compared to developing an in-house enterprise database make WISKI a desirable option for any organization.
Transformation of data into information
Transforming data into information and making sense of information is key to maximizing the use of data (Price and Vojinovic Citation2008, Cantor et al. Citation2018). With jurisdiction over a significant portion of the Gulf Coast of Florida, tourism revenue is one of the most important drivers of economic growth in the District as well as Florida in general. However, the hydrologic data collected by the District are currently not available in an “easy-to-understand” format for users with no hydrology background. For example, “100-foot water level above mean sea level” in a waterbody within a state park is difficult to comprehend for someone whose only interest is knowing whether it is safe to camp or launch a boat or kayak. However, if “100-foot water level above mean sea level” is translated to inundation information, users could easily decide. Mobile applications disseminating real-time inundation estimated using water levels and land surface elevation derived from LiDAR (Light Detection and Ranging) data can add tremendous value to the data for end users. The inundation information would be beneficial to campers, boaters, homeowners, and commuters, especially during the rainy season (June–September) when Florida often experiences tropical storms and hurricanes. Furthermore, the District also attracts tourists because of the biodiversity in its jurisdictional boundaries. An ecotourism hub, the District is a home to more than 514 000 ha of wetlands, the largest concentration of springs in the world (more than 200), numerous lakes, Florida’s largest open water estuary (the Tampa Bay), endangered Florida manatees, and more than 100 species of birds. Utilizing long-term inundation time-series data could help classify the hydroperiod for wetlands, lakes, and estuaries, and coupled with the change in ecological indicators with time, robust ecosystem conservation and restoration plans can be designed.
Utilization of open-source software
From an economic standpoint, open-source, open-contribution software is a great innovation (Bonaccorsi and Rossi Citation2003). Furthermore, continuous improvement through open and unlimited contribution has made such software gain in popularity within the data management community. To reduce data analysis cost, the HMP has now started to utilize R for data analyses. Apart from the cost-savings, use of R stemmed from succession planning efforts at the District, a requirement for a smooth staff transition for any organization. Previously, all data were analyzed using the Statistical Analysis Software (SAS; SAS Institute, Cary, NC, USA). However, with more and more of the future workforce, i.e. the new college graduates, having had exposure to R as part of their academic studies, growth of the R user community, and the available online support, the HMP decided to transition from SAS to R as its preferred programming/scripting tool. Furthermore, it is relatively easy to integrate R with other languages and, given that it is an open-contribution software, code developed elsewhere can be utilized by the HMP staff to save considerable time. Given that statistical analyses techniques in hydrology are mostly standardized, most analyses can be easily conducted using the code already developed by other contributors. With the transition from SAS to R, the HMP plans to save the District approximately $32,000 annually in SAS (basic) licensing fees.
Summary
Budgetary restrictions are a reality for most public agencies. Therefore, maintaining a balance between quantity and quality of hydrologic data, and the associated cost of collection and validation is important. We identify the following lessons learned from the response of a public water management agency in Florida, USA, to extreme climatic events, increased need for data quantity and quality, and technical advancements.
A proactive approach can reduce the detrimental impacts of hydroclimatic events such as freezes and droughts on water resources. Providing infrastructure and holding the stakeholders accountable for collecting their water-use data for making informed decisions can lead to increased transparency and efficiency in the management of water resources.
Gauge-adjusted RADAR-rainfall (GARR) estimates can prove cost-effective for organizations managing water resources with regions of high rainfall variability or limited accessibility to install and maintain rain gauges. Organizations involved with hydrologic model development spanning large areas can also benefit from GARR estimates given their uniform spatial and temporal resolution.
Developing an in-house system for field data collection and using COTS software for an enterprise database is cost-effective.
Organizational support for hydrologists towards learning open-source scripting languages such as R can lead to cost-savings, and considerably reduce the data validation time through automation of quality assurance processes.
Collaborating with and tracking the data collection of other federal, regional, and local agencies can help maintain an optimized hydrologic data collection network by eliminating redundancy.
An efficient data collection, management, and dissemination system will need to consider inter-agency coordination, and continued modernization of monitoring infrastructure and workforce. This does not end with one-time change but rather a continued goal. Water agencies will need to continually adapt and evolve given the projected changes in climate, sea level, land-use, and population and their potential effects. This need is especially important for coastal regions such as Florida.
Acknowledgements
The authors would like to thank Mike Katherina (formerly with the District) and Everett Eldridge, for their assistance with LoggerNet and near-real-time communications’ documentation.
Disclosure statement
No potential conflict of interest was reported by the authors.
Notes
1 NGVD 29 is the National Geodetic Vertical Datum of 1929.
References
- Abiy, A.Z., et al., 2019. Rainfall trend and variability in southeast Florida: Implications for freshwater availability in the Everglades. PloS One, 14 (2), e0212008. doi:10.1371/journal.pone.0212008
- Aurit, M.D., Peterson, R.O., and Blanford, J.I., 2013. A GIS analysis of the relationship between sinkholes, dry-well complaints and groundwater pumping for frost-freeze protection of winter strawberry production in Florida. PloS One, 8 (1), e53832. doi:10.1371/journal.pone.0053832
- Berg, P., Norin, L., and Olsson, J., 2016. Creation of high resolution precipitation data set by merging gridded gauge data and radar observations for Sweden. Journal of Hydrology, 541, 6–13. doi:10.1016/j.jhydrol.2015.11.031
- Blodgett, D., Lucido, J., and Kreft, J., 2016. Progress on water data integration and distribution: a summary of select US geological survey data systems. Journal of Hydroinformatics, 18 (2), 226–237. doi:10.2166/hydro.2015.067
- Bonaccorsi, A. and Rossi, C., 2003. Why open source software can succeed. Research Policy, 32, 1243–1258. doi:10.1016/S0048-7333(03)00051-9
- Campbell, J.L., et al., 2013. Quantity is nothing without quality: automated QA/QC for streaming environmental sensor data. Bioscience, 63, 574–585. doi:10.1525/bio.2013.63.7.10
- Cantor, A., et al. 2018. Data for water decision making informing and implementation of California’s open and transparent water data act through research and engagement [online]. Center for Law, Energy, and the Environment, UC Berkeley School of Law, Berkeley, CA. Available from: https://www.law.berkeley.edu/research/clee/research/wheeler/data/ [Accessed 30 March 2019].
- Chacon-Hurtado, J.C., Alfonso, L., and Solomatine, D.P., 2017. Rainfall and streamflow sensor network design: a review of applications, classification, and a proposed framework. Hydrology and Earth System Sciences, 21, 3071–3091. doi:10.5194/hess-21-3071-2017
- Chang, W., et al., 2018. Diagnosing added value of convection-permitting regional models using precipitation event identification and tracking. Climate Dynamics. doi:10.1007/s00382-018-4294-0
- Dozier, J., 1992. Opportunities to improve hydrologic data. Review of Geophysics, 30 (4), 315–331. doi:10.1029/92RG01440
- FDACS, 2019. Florida agriculture overview and statistics [online]. Florida Department of Agriculture and Consumer Services. Available from: https://www.freshfromflorida.com/Agriculture-Industry/Florida-Agriculture-Overview-and-Statistics [Accessed 29 March 2019].
- Fu, X., et al., 2016. “Living on the edge”: estimating the economic cost of sea level rise on coastal real estate in the Tampa Bay region, Florida. Ocean and Coastal Management, 133, 11–17. doi:10.1016/j.ocecoaman.2016.09.009
- Horsburgh, J.S., et al., 2015. Open source software for visualization and quality control of continuous hydrologic and water quality sensor data. Environmental Modelling and Software, 70, 32–44. doi:10.1016/j.envsoft.2015.04.002
- Ivey, J.L., Loë, R.C., and Kreutzwiser, R.D., 2002. Groundwater management by watershed agencies: an evaluation of the capacity of Ontario’s conservation authorities. Journal of Environmental Management, 64, 311–331.
- Jagtap, S.S., et al., 2002. Responding to stakeholder’s demands for climate information: from research to applications in Florida. Agricultural Systems, 74, 415–430. doi:10.1016/S0308-521X(02)00048-3
- Kopp, S., et al., 2018. Perspective on the national water model. Water Resources Impact, 20 (1), 10–11.
- Long, D., Longuevergne, L., and Scanlon, B.R., 2014. Uncertainty in evapotranspiration from land surface modeling, remote sensing, and GRACE satellites. Water Resources Research, 50 (2), 1131–1151. doi:10.1002/2013WR014581
- Munson, A.B., Delfino, J.J., and Leeper, D.A., 2005. Determining minimum flows and levels: the Florida experience. Journal of the American Water Resources Association, 41 (1), 1–10. doi:10.1111/jawr.2005.41.issue-1
- Neuman, S.P., et al., 2012. Bayesian analysis of data-worth considering model and parameter uncertainties. Advances in Water Resources, 36, 75–85. doi:10.1016/j.advwatres.2011.02.007
- Newman, G., et al., 2010. User-friendly web mapping: lessons from a citizen science website. International Journal of Geographical Information Science, 24 (12), 1851–1869. doi:10.1080/13658816.2010.490532
- NOAA, 2019a. Drought-May 2000 [online]. National Oceanic and Atmospheric Administration. Available from: https://www.ncdc.noaa.gov/sotc/drought/200005 [Accessed 29 March 2019].
- NOAA, 2019b. North American Vertical Datum of 1988 (NAVD 88) [online]. National Oceanic and Atmospheric Administration. Available from: https://www.ngs.noaa.gov/datums/vertical/north-american-vertical-datum-1988.shtml [Accessed 30 March 2019].
- Price, R.K. and Vojinovic, Z., 2008. Urban flood disaster management. Urban Water Journal, 5 (3), 259–276. doi:10.1080/15730620802099721
- Rowland, M.A., 2000. The evolution of two water resource management systems: case studies of Tampa Bay and the Middle East. Journal of Environmental Law and Policy, 11, 411–469.
- Santos, B.M., et al., 2011. Evaluation of freeze protection methods for strawberry production in Florida. Proceedings of Florida State Horticultural Society, 124, 188–190.
- Shukla, S., et al., 2006. Wireless data acquisition and control systems for agricultural water management projects. HortTechnology, 16 (4), 595–604. doi:10.21273/HORTTECH.16.4.0595
- Stewart, B., 2015. Measuring what we manage – the importance of hydrological data to water resources management. IAHS Publ. 366, Proceedings of the 11th Kovacs Colloquium, Paris, France. doi:10.5194/piahs-366-80-2015
- SWFWMD, 2019a. Regional observation and monitor-well program (ROMP) [online]. Southwest Florida Water Management District. Available from: https://www.swfwmd.state.fl.us/projects/regional-observation-and-monitor-well-program-romp [Accessed 29 March 2019]
- SWFWMD, 2019b. Southern water use caution area [online]. Southwest Florida Water Management District. Available from: https://www.swfwmd.state.fl.us/projects/southern-water-use-caution-area [Accessed 29 March 2019].
- SWFWMD, 2019c. District responds to the freeze of 2010 [online]. Southwest Florida Water Management District. Available from: https://www.swfwmd.state.fl.us/blog/watermatters/distric-responds-the-freeze-2010 [Accessed 29 March 2019]
- SWFWMD, 2019d. District presents freeze management plan [online]. Southwest Florida Water Management District. Available from: https://www.swfwmd.state.fl.us/blog/watermatters/district-presents-freeze-management-plan [Accessed 30 March 2019].
- Wu, F. and Guan, Z., 2015. Modeling the interactions of strawberry commodity and labor markets in the US and Mexico. In: Agricultural and applied economics association and Western agricultural economics association annual meeting. 26–28 July 2015 San Francisco, CA, USA, 1–26.