
 ?Mathematical formulae have been encoded as MathML and are displayed in this HTML version using MathJax in order to improve their display. Uncheck the box to turn MathJax off. This feature requires Javascript. Click on a formula to zoom.
ABSTRACT
The impact of climate variables on monthly reference evapotranspiration (ETo) is a critical issue in water resources management and irrigation planning. The spatio-temporal contribution of climate variables to ETo in the Pearl River Basin (PRB), China, from 1960 to 2016 were calculated based on sensitivity and relative change of each climatic variable. The results show that annual ETo total decreased by 1.64% and diminished in magnitude from the southeast to the northwest. Sunshine duration, wind speed and relative humidity decreased by 15.5%, 7.4%, and 4.0%, respectively, while average temperature increased by 4.25%. The ETo showed a positive sensitivity to all variables except relative humidity, which showed a negative sensitivity. Sunshine duration had the highest contribution of −4.26%, and the overall decrease in ETo was mainly caused by the declines in sunshine duration and wind speed, which offset the positive impact of rises in average temperature and reduction in relative humidity.
Editor A. Castellarin Guest editor M. Borga
1 Introduction
Global climate change is projected to result in major impacts on the water cycle and energy balance at regional scales (Prudhomme et al. Citation2013, Guo et al. Citation2017). Evapotranspiration (ET) is a major component of both the hydrological cycle and the land surface energy balance, and is a critical link between the two.
Evapotranspiration from a hypothetical grass reference crop, with an assumed crop height of 0.12 m that closely resembles an extensive surface of green, well-watered grass of uniform height, actively growing and completely shading the ground, is called the reference evapotranspiration and is denoted as ETo (Allen et al. Citation1998). The ETo in China as been reported to show a decreasing trend as a result of global change between 1954 and 1993 (Thomas Citation2000). Hobbins et al. (Citation2004) reported pan ET data for the USA showed a decrease from 1950 to 2002 in 64% of the stations examined. Although it is conjectured that ETo should have an increasing trend with the rising global temperatures (Tabari et al. Citation2011), some researchers, as cited earlier, report that ETo has shown a decreasing trend. Some have called this apparent contradiction the “evaporation paradox” (Brutsaert and Parlange Citation1998). However, as ETo is controlled by several other atmospheric variables besides temperature, climatically linked changes in other variables have been cited as possible drivers for observed regional ETo trends. The reduction in ETo in some regions (e.g. Canada and the Tibetan Plateau) may be linked to decreases in wind speed (Burn and Hesch Citation2007, Zhang et al. Citation2009b), or affected by the reduction of radiation, as reported for the Yangtze River (Xu et al. Citation2006, Cong et al. Citation2009) and the Northern Hemisphere (Roderick and Farquhar Citation2002), or an increase in relative humidity (Bandyopadhyay et al. Citation2009). Most of these studies are based on conventional trend and correlation analysis methods (Herath et al. Citation2017).
Recently, Yin et al. (Citation2010) combined sensitivity analysis with a relative change methodology to quantify the impact of different climate variables on ETo. Sensitivity analysis attributed relative humidity as the main variable controlling ETo in the Songnen Plain (Ma et al. Citation2017), while it was sunshine duration for the Jialing River (Herath et al. Citation2017), radiation for Jiangsu (Chu et al. Citation2017), and average temperature for Australia (Guo et al. Citation2017). A similar analysis found different variables controlled ETo in different regions: net radiation in the Yangtze River (Xu et al. Citation2006), average temperature in southwest China (Liu et al. Citation2016), relative humidity in the Loess Plateau (Ning et al. Citation2016), and wind speed in the Yellow River region (She et al. Citation2017).
Because many studies use multi-monthly seasonal or annual datasets for their analysis, they may miss significant relationships shown with finer time scales such as seen in monthly climatic data (Sun et al. Citation2017). In addition, monthly time scales may be more important to water resource managers and irrigation planners than coarser temporal scales. Additional factors include spatial heterogeneity of climatic variables and ETo that may necessitate interpolation methods; different studies have used different methods (Xu et al. Citation2006).
The Pearl River has the second largest annual average flow in China, with the Pearl River Basin (PRB) spanning tropical and sub-tropical geoclimatic regimes (Zhang et al. Citation2018). The PRB is critical to the water security and agriculture in the basin (Li et al. Citation2013). For example, the Pearl River Delta (PRD) is the centre of Guangdong-Hong Kong-Macao Greater Bay Area region and accounts for more than 10% of the Chinese Gross Domestic Product (GDP) (Zhang and Chen Citation2017). The Pearl River’s tributary, the Dongjiang River, is the main drinking water source for Shenzhen City and Hong Kong (Zhang et al. Citation2009a). Previously, there have been no studies on the impact of climate change on ETo in the PRB.
Our study uses the daily averages of relative humidity, sunshine duration average temperature and wind speed gathered at 54 stations from 1960 to 2016, using these values to calculate monthly ETo based on the Penman-Monteith formula. Spatial interpolation is implemented to create a regional dataset of ETo. These data are compared with pan evaporation data from 38 stations. The main objectives of this study are: (1) to quantify the spatio-temporal change of ETo and climatic variables in the PRB, (2) to establish ETo sensitivity to climate variables, and (3) to quantify the contribution of climate variables to monthly ETo.
2 Materials and methods
2.1 Study area
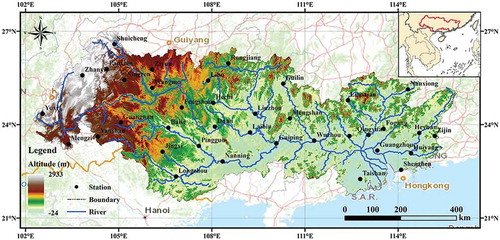
The Pearl River Basin (PRB) is drained from the three tributaries, the Xijiang, Beijiang and Dongjiang rivers, and the Pearl River Delta (PRD) around Guangzhou-Taishan-Shenzhen (). The PRB is located in tropical and subtropical monsoon climate zones of southern China between 102°14′–115°53′E and 21°31′–27°0′N, with an area of 47.27 × 10⁴ km2. The elevation gradually increases from east to west, where the Yunan-Guizhou Plateau lies. Within this transect, the highest altitude is approximately 2933 m a.s.l. To the southeast is the coastal area, and to the north, mountains (Zhang and Chen Citation2017). The annual average temperature is approximately 19.4°C, and the annual average precipitation is 1496 mm, mainly concentrated between April and September (Sun et al. Citation2016).
Figure 1. Location of the Pearl River Basin study area.
2.2 Data
There are more than 100 meteorological stations in and around the basin, with data available from the China National Meteorological Information Centre archive (http://data.cma.cn/). Stations were excluded if they had missing data for more than 1% of time, or if they lacked data on 60 or more continuous days. Finally, we chose 54 stations that had high quality daily relative humidity (RH), sunshine duration (SD), average temperature (TAV) and wind speed (WS) for the period from 1960 to 2016. Spikes in data were corrected by replacing them with the mean value of their adjacent days; this process did not influence the long-term trend of meteorological data.
2.3 Analysis method
2.3.1 Penman-Monteith equation
The ETo was calculated with the Penman-Monteith equation using coefficients appropriate for well-watered grass (Goyal Citation2004):
where ETo is the reference evapotranspiration (mm/d); Rn is the net radiation (MJ m−2 d−1); G is the soil heat flux density (MJ m−2 d−1); T is the mean daily air temperature at 2 m height (ºC); u2 is the wind speed at 2 m height (m s−1); es is the saturation vapour pressure (kPa); ea is the actual vapour pressure (kPa); Δ is the slope of the vapour pressure curve (kPa ºC−1); and γ is the psychrometric constant (kPa ºC−1). Variables needed for Equation (1) that were not directly measured were calculated using the FAO protocols (Allen et al. Citation1998), such as obtaining net radiation Rn from sunshine duration data.
2.3.2 Data comparison with pan evaporation
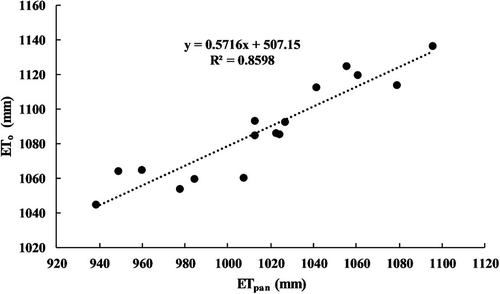
Pan evaporation (ETpan) is a simplicity and efficient method to measure daily ET, widely used over the word. The long-term measured ETpan data over different regions can be used to verify the spatio-temporal characteristics of ETo. The ETpan data from 38 stations with E601 between 2000 and 2014 were compared with ETo calculated using Equation (1). The correlation coefficient between the annual ETo of the 38 stations and annual ETpan was 0.86, with a slope of 0.5716 (), and is consistent with the relationship of ETpan to ETo under humid conditions (Grismer et al. Citation2002). This agreement suggests that the quality of the temporal and spatial ETo data is reliable.
Figure 2. Relationship between the observed annual pan evaporation, ETpan, and calculated annual reference evapotranspiration, ETo.
2.3.3 Interpolation
The ETo for each of the 54 stations (Section 2.2) was used to create a spatial dataset for the PRB region using spatial interpolation of the meteorological variables and ETo. The interpolation was assessed by using 40 stations for developing the spatial interpolation, and 14 stations used to compare with the interpolation. Ordinary kriging with spherical variogram (Ks), ordinary kriging with exponential variograms (Ke), universal kriging with linear drift variograms (Kl) and inverse distance weighting (IDW) were used with ArcGIS software for the interpolation (Zhang and Chen Citation2017).
To test the interpolation, SPSS software (IBM; ibm.com) was applied to by calculate correlation coefficients. We calculated the correlation between interpolated and observed values of ETo, and the meteorological variables at the 14 test stations for each year in the period 1960–2016. There have many papers that compared ordinary kriging and IDW interpolation (e.g. Tegos et al. Citation2015). For this study, the results () indicate that kriging and IDW have similar results, but Ks (0.857) is much better than IDW (0.318) for TAV interpolation, so we chose Ks to interpolate ETo, and meteorological variables into 1 km × 1 km spatial resolution gridded data.
Table 1. Correlation coefficients between interpolation result and observation data. IDW: inverse distance weighting; Ke: ordinary kriging with exponential variograms; Kl: universal kriging with linear drift variograms; Ks: ordinary kriging with spherical variogram. ETo: reference ET; RH: relative humidity; SD: sunshine duration; TAV: average temperature; WS: wind speed.
2.3.4 Trend
Sen’s slope was used to get a less biased slope estimate (Sen Citation1968), while the nonparametric Mann-Kendall (MK) trend test (Mann Citation1945, Kendall Citation1948) was employed to detect the significance of temporal ETo changes of each grid (Tabari et al. Citation2011).
2.3.5 Sensitivity
The relative sensitivity of ETo to the changes in each particular meteorological variable was quantified with a partial derivative method (McCuen Citation1974, Saxton Citation1975). Practically, the partial derivatives were estimated by changing each variable by 10%, while the other variables were held constant (Chu et al. Citation2017):
where Svi is a dimensionless sensitivity coefficient, ∆ is the difference operator for each variable (not to be confused with the vapoir pressure slope symbol used in Equation (1)), and vi is each climate variable indexed by i. If Svi > 0, this indicates that ETo increases with increases in the particular climate variable, while Svi < 0 indicates that ETo decreases with increases in a particular climate variable.
2.3.6 Contribution
Although Equation (2) reveals the ETo sensitivity to relative changes, it does not account for the relevance of any particular variable for a given region or season where its relative change may be negligible or substantial, compared to the other variables. For any particular set of conditions, the contributions of a target variable to ETo can be defined by (Yin et al. Citation2010, Li et al. Citation2017a):
where Convi is the time-trend based contribution of climate variable vi to ETo; Svi is the climate variable sensitivity coefficient defined in Equation (2); RCvi is the relative change over time frame n – defined in Equation (4b); n is the length of the study period (57 years in this study); Tvi,j is the yearly or monthly change (designated by subscript j) of each climate variable vi; and avi is the mean variable averaged over multiple years or months, depending on the desired time frame. In this study j was set to a monthly time interval. If Convi > 0, the climate variable has a positive contribution to the variation of ETo over the 57 months, while if Convi < 0, this indicates a negative contribution to ETo.
3 Results
3.1 Spatio-temporal change of ETo
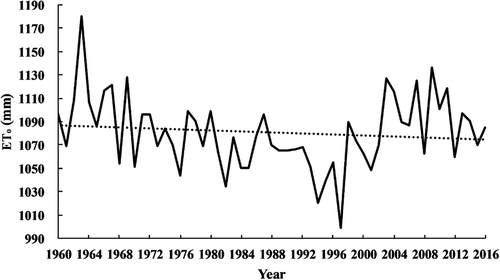
The annual ETo in the PRB showed a slightly decreasing trend from 1960 to 2016 (), varying from a minimum of 998.9 mm to a maximum of 1180.0 mm (annual average: 1080.6 mm). A greater decreasing trend is seen from 1960 to 1997, but then there is an increasing trend from until 2016. Monthly ETo showed significant seasonal change, with a high of 131.7 mm and a low of 51.1 mm in January.
Figure 3. Variation of the annual ETo in the Pearl River Basin in the period 1960–2016.
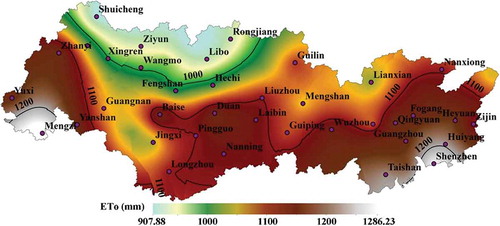
Spatially, annual ETo showed an increasing trend from the northwest to the southeast (). The highest ETo (1286.3 mm) was in the Pearl River Delta region, near Shenzhen. The lowest annual ETo (907.9 mm) was within an arc running from Shuicheng in the west to Rongjiang in an easterly direction. Areally, 13.1%, 44.7% and 39.7% region of the basin had annual ETo between 900 and 1000 mm, 1000 and 1100 mm, and 1100 and 1200 mm, respectively. Only 2.5% of the basin area had ETo greater than 1200 mm.
Figure 4. Spatial distribution of the annual ETo in the Pearl River Basin.
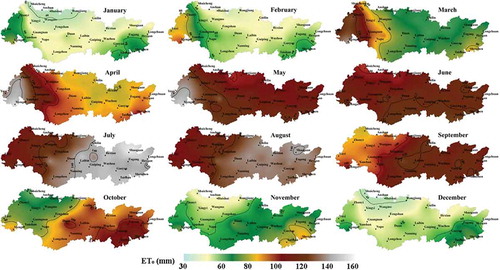
The highest monthly ETo, near the Pearl River Delta and Mengzi-Yuxi, occurred during January to April and east of Guilin-Nanning in July (), on a spatial (not seasonal) basis. After August, the western region first showed a decreasing monthly ETo trend, with the entire basin showing a decreasing trend reaching its lowest values in November–December.
Figure 5. Monthly ETo in the Pearl River Basin.
The annual ETo change expressed per year, calculated by the Sen slope method, shows that annual ETo varied from – 1.98 to 2.29 mm year−1 (). Most of the basin (72.9%) showed a decreasing ETo trend ( and ). In the central basin around Nanning-Laibin-Guiping, ETo had the highest decreasing trend of 10.2%. Overall, ETo averaged over the entire the Pearl River Basin showed a decrease of about 1.6% from 1960 to 2016.
Table 2. Percentage of positive (PS) and negative (NE) trend region of basin and the change trend of ETo and climate variables in the PRB in the period 1960–2016. See for climate variable abbreviations./dec: per decade.
Figure 6. Spatial change trend of the ETo in the Pearl River Basin.
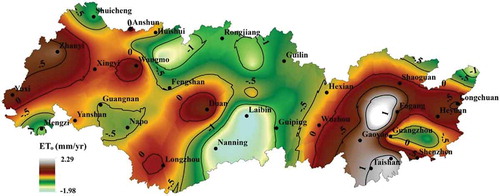
In the seven months of January, March and May–September, ETo showed a decreasing trend (), with more than 70% of the basin showing this decrease. Within this time range, July had the most substantial decreasing trend of approx. – 10.0 mm year−1, with more than 92.1% region of the basin showing a decrease. On the other hand, October showed the most rapidly increasing trend of 58 mm year−1, with 85.9% of the basin showing an increasing trend.
3.2 Spatio-temporal change of climate variables
The sunshine duration, wind speed and relative humidity showed decreasing trends, as indicated by the Sen slope analysis, with decreases of 0.12 h decade−1, 0.03 m s−1 decade−1, and 0.55% decade−1, respectively (; see also Section 4.1), and relative change (RC) decreases of 15.5%, 7.4% and 4.0%, respectively (). Mean temperature had an increasing trend, of 0.14ºC decade−1, which is consistent with the global climatic temperature change, representing an increase in RC of 4.25%. The Mann-Kendall significance tests showed all variables passed the significance test at p = 0.001, except for wind speed that passed at p = 0.01.
Figure 7. Relative change, RC, of climate variables in the Pearl River Basin. RH: relative humidity; SD: sunshine duration; TAV: average air temperature; WS: wind speed.
Spatially, RH, WS and SH showed a downward trend in 100%, 98.9% and 64.8% of the basin area, respectively (). Average temperature (TAV) trends increased everywhere in the basin, with the highest changes around the Pearl River Delta and the western high-altitude region ().
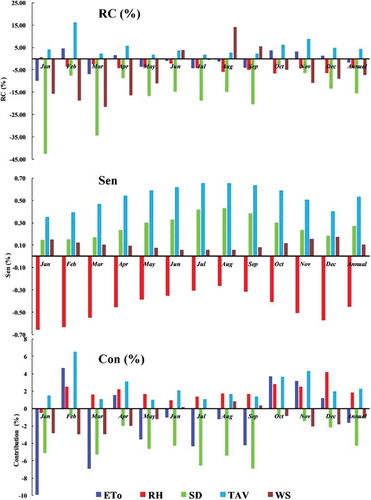
Monthly RH showed a decreasing trend in 80% of the basin for all months except January, with the greatest decreases of around 0.87% decade−1 in October, and the RC decreasing at 6.6% (, ). Sunshine duration showed decreases during all months for more than 70% of the basin area. Average temperature showed an increasing trend in more than 95% of the basin for all months, except for 20% of the region, which showed an increasing trend in January. February had the most rapid increase of about 0.33ºC decade−1, with RC of 16.2%. Wind speed showed an increasing trend in June, August and September, but a decreasing trend in all other months. Wind speed in March had the most rapid decreasing trend of 0.08 m s−1 decade−1, and the largest RC decreases of 21.6%.
Figure 8. Monthly relative change, RC, sensitivity coefficient, Sen, and contribution, Con, of the climate variables in the Pearl River Basin.
3.3 Spatio-temporal change in the sensitivity Sv
The sensitivity coefficients, Sv, averaged – 0.45, 0.53, 0.27 and 0.11 for RH, TAV, SD and WS, respectively (). Relative humidity had a negative sensitivity throughout the entire basin, with the lowest magnitudes in the central basin and the highest magnitudes in the western basin and the Pearl River Delta, and a maximum magnitude of – 0.71. The Sv for air temperature decreased from east to west and from south to north, with the highest sensitivity in the Pearl River Delta region reaching 0.65. The spatial distribution of SD sensitivity was similar to that of TAV, but the highest value was mainly in the southern basin, with values reaching 0.32. The sensitivity of ETo to wind speed was generally low, with the highest value of 0.17 in the northern and western basin.
Figure 9. Sensitivity coefficient (absolute) between ETo and climate variables in the Pearl River Basin. RH: relative humidity; SD: sunshine duration; TAV: average air temperature; WS: wind speed.
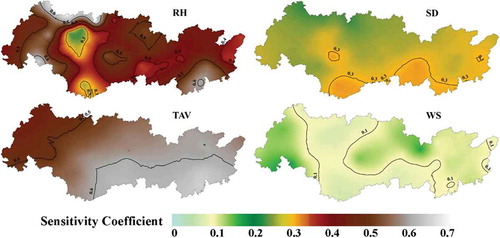
Sensitivity varied greatly in different months (). From April to October, TAV had the highest sensitivity coefficient, while RH exhibited the highest magnitude sensitivity in the other months. Relative humidity had negative sensitivities throughout the year, with January having the highest magnitude sensitivity coefficient of about – 0.66, and August having the lowest magnitude of – 0.26 in August. Sensitivity of TAV and SD increased from 0.35 and 0.15, respectively, in January to 0.66 and 0.43, respectively, in August. Wind speed had a lower sensitivity coefficient compared to the other variables, ranging from 0.17 in December to 0.06 in July.
3.4 Spatio-temporal change in the contribution of Convi
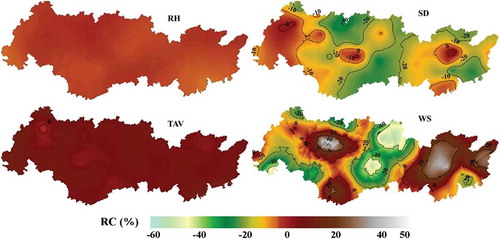
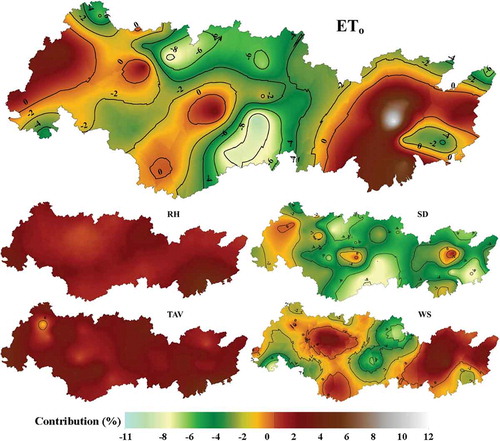
The contribution of different variables (Convi) to the change in ETo was examined with the sensitivity (Svi) and relative change (RCvi) of each climate variable (Equations (3) and (4)). Sunshine duration and wind speed showed a negative Con of −4.3% and −1.0%, respectively (). Air temperature showed a Con of 2.3% and that for relative humidity was 1.8%. All four of the climate variables combined had a Con of −1.1%. The relative change (RC) of ETo had a spatio-temporal average about – 1.6%, varying between −10.2% and 11.4%. The correlation coefficient between the sum contribution of all four climate variables and the RC of ETo was 0.91 over the basin. Sunshine duration had the largest contribution, with a spatial value varying from −8.1% to 1.8%, with 98.9% of the basin exhibiting a negative contribution. The contribution from wind speed varied from −8.1% to 4.7%, with 64.8% of the basin showing a negative contribution. Both air temperature and relative humidity exhibited positive contributions throughout essentially the entire basin, varying from – 1.3% to 4.9% and 0.4% to 4.9%, respectively.
Figure 10. Contribution between ETo and climate variables in the Pearl River Basin. RH: relative humidity; SD: sunshine duration; TAV: average air temperature; WS: wind speed.
The average Con over the entire basin varied by month (). Monthly sunshine duration had an obvious impact on ETo in January, March and May–September, with the largest contribution in September reaching −6.9%, and the lowest contribution in February. Wind speed had a negative contribution to ETo from October to May, with the largest magnitude contribution of −3.0% in March. The contribution of relative humidity was low in the middle of the year, with the lowest value of 0.9% in June, while the largest contribution reached 4.2% in December. The air temperature exhibited a positive contribution over the entire year, reaching Con of 6.5% in February, decreasing to a low of 1.0% in May.
From a spatial perspective, sunshine duration had the greatest annual contribution of all variables, affecting 72.7% of the basin (). On an annual basis, ETo was most affected (based on Con) by WS, TAV and RH in 16.1%, 6.6% and 4.6% of the basin, respectively. In the area surrounding Guilin-Duan-Yanshan (), the greatest contribution to ETo came from WS; TAV was the dominant contributor around the west of Mengzi; and RH only controls a small region around Zhanyi in the western basin. On monthly time scales, SD made the greatest contributions to ETo in January, March and May–September, with essentially approximately 70% region of the basin being so affected. Air temperature exhibited the widest areal distribution of the greatest contributions in February, April, October and November. Relative humidity accounted for the largest space in December, making ETo show an increasing trend.
Table 3. Percentage of area influenced by each dominant variable to ETo (%).
4 Discussion
4.1 Change in climate variables
Sunshine duration decreased appreciably, by 15.1% from 1960 to 2016 (). In more detail, sunshine radiation had a decreasing trend from the 1950s to the 1980s, but with a slightly increasing trend between the 1990s and 2000s, and then levelling off subsequently. In areas where there has been a decreasing trend and then an increasing trend, this has been called “from dimming to brightening” (Wild et al. Citation2005, Wild Citation2009, Liu and Zhang Citation2013). We speculate that the reduction of sunshine duration in the Pearl River Basin between the 1950s and the 1980s stemmed from two major factors. Firstly, sunshine duration decreased because of increases in aerosol concentrations caused by rapid urbanization and the associated combustion-related aerosol production, as postulated by Zongxing et al. (Citation2012) for southwestern China. It is instructive to remember that sunshine duration is defined as the “the sum of the time, during a given period, for which the direct solar irradiance exceeds 120 W/m2 (WMO Citation2003), so increased turbidity from aerosols would decrease irradiance, thereby decreasing the sunshine duration. A secondary effect of increased aerosols on reduced sunshine duration could involve increased cloudiness associated with increased cloud condensation nuclei and ice nuclei, although the relationship is complex (Seinfeld et al. Citation2016). Secondly, our results show that wind speeds generally decreased from 1960 and the 1990s. These reduced wind speeds will have exacerbated the air quality problem, as it is well known that low wind speeds are linked to higher planetary boundary layer pollutant concentrations (Satheesh and Krishna Moorthy Citation2005, Fu et al. Citation2008). The reduced wind speeds could have been caused by an increase in land surface vegetation, the weakening of atmospheric cycle activities, and the weakening of the East Asian monsoon (Xu et al. Citation2006, Zhang et al. Citation2009b, Vautard et al. Citation2010, Li et al. Citation2017b). Wind speed in the Pearl River Basin did show an increase after the 2000s (), at the time when the sunshine duration tended to increase and level off, consistent with a potential link to aerosol concentrations. Some researchers have attributed global wind speed decreases as a major factor in decreasing ETo, but this is attributed to the direct effect of wind speed on the aerodynamic resistance rather than through controls over aerosol concentration (McVicar et al. Citation2012).
Figure 11. Variation of ETo and climate variables in the Pearl River Basin. RH: relative humidity; SD: sunshine duration; TAV: average air temperature; WS: wind speed.
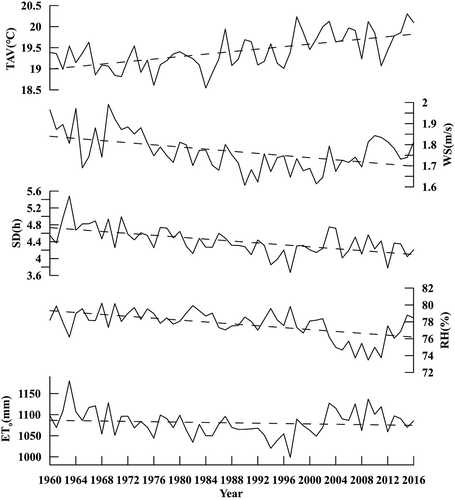
The air temperature pattern over the 57-year study period is consistent with the global increase of approximately 0.14°C decade−1 in the report of the Intergovernmental Panel on Climate Change (IPCC Citation2013). The time course of the air temperature pattern is also similar, except in the Pearl River Basin, the slight decrease or constant temperature pattern in the 1960s does not become an increase until well into the 1980s (), while the global averaged increase becomes more apparent beginning in the late 1970s. The relative humidity shows a gentle overall reduction over time, with a higher frequency pattern of a dip starting in the 2000s, then rising around 2010. Both the general trend of increasing air temperature and reduced relative humidity are expected to be linked the definition of relative humidity; and from Equation (1), RH is a key driver of the evapotranspiration process (Tegos et al. Citation2017), linked to increasing ETo (Li et al. Citation2017a).
4.2 Analysis of ETo change
The annual ETo pattern from 1960 to 2016 shows consistency with the effects predicted from Equation (1) and the sensitivity analysis (). In particular, the general decrease in ETo is consistent with the general decrease in annual average wind speed and sunshine duration. However, the decrease in ETo is not generally consistent with the annual average air temperature increase and relative humidity decrease, both of which are associated with an increase in annual ETo from Equation (1) and the sensitivity analysis. This apparent inconsistency can be resolved by thinking of the combination of ETo sensitivity to and contribution from the key weather variables used in this study.
Increased wind speed decreases the aerodynamic surface resistance and increases ETo; this is consistent with the pattern in ETo, which is similar to that of wind speed – an apparent decrease over time until the 1990s, then an increase (). The general trend of a decrease in ETo and wind speed is also consistent with Equation (1). Similarly, the overall trend in a decrease in sunshine duration would be associated with a decrease in the net radiation term of £quation (1), leading to an expected decrease in ETo.
Sensitivity analysis and Equation (1) show that an increase in air temperature and the expected related decrease in RH will tend to increase ETo, The fact that ETo slightly decreases over time implies that the overall contributions from wind speed and sunshine duration outweigh the air temperature and relative humidity contributions in the Pearl River Basin, as discussed below. Linked to this is the expectation that, had temperature and relative humidity showed no trend over time, but sunshine duration and wind speed changed as observed, then the ETo would have decreased even more dramatically. A finer scale analysis shows that the minimum ETo (associated with a negative spike) observed in 1997 can be linked to an increased relative humidity (a positive spike), a minimum in sunshine duration of 3.67 h (a negative spike) and a negative spike in wind speed (). In contrast, the positive spike in ETo in 1963, resulting in the highest ETo value in the record, is linked to a positive spike in wind speed, a positive spike in sunshine duration, a negative spike in relative humidity and a positive anomaly in air temperature.
The general decrease in ETo in the Pearl River Basin matches the same trend reported for Guangdong (He et al. Citation2015) and some other parts of the globe (Roderick et al. Citation2009). However, other reports that global and some regional ETo began to increase in the 1980s, reaching a maximum in 1998 (Jung et al. Citation2010, Zhang et al. Citation2016, Dong and Dai Citation2017), do not match our annual ETo record, which shows a general decrease from 1960 through to 1997, and then a general increase for around a decade before levelling off (). Some of this apparent discrepancy could arise because the global data of Jung et al. (Citation2010), including the Southern Hemisphere, was based on data commencing in the 1980s, so both the global nature of the data and the limited time span could come into play. Other regional ETo studies, in Canada (Burn and Hesch Citation2007) and southwest USA (Senay et al. Citation2017), also show different trends than the Jung et al. (Citation2010) study. Our results coupled with previous studies reinforce the idea that the ETo equation is associated with sensitivities that, when examined in terms of contributions of climatic variables and their spatio-temporal distribution, explain different spatio-temporal ETo patterns for specific regions and the globe in general. These results also show that generalizations at the global scale must be carefully evaluated when considering regional or local scale ETo changes.
4.3 Analysis of the sensitivity and contribution
As noted in Section 4.2, consideration of the differential spatio-temporal sensitivity of ETo to climatic variables is a critical endeavour. Our analysis agrees with previous reports that sensitivity varies with region and time scale (Irmak et al. Citation2012); so while ETo exhibits the highest sensitivity to relative humidity in some regions (Xu et al. Citation2006), in other regions such as southwest China, more sensitivity is found with wind speed (Liu et al. Citation2016). This is not a surprise because sensitivity analysis using partial differentials of Equation (1), as presented in Equation (2), will yield differing values depending on where in the multidimensional curved surface any particular region lies in space and time (that is, what the typical climatic variable values are). Furthermore, because spatio-temporal variation of these climatic variables may differ appreciably between variables, the relative change and contributions to ETo as assessed using Equations (3) and (4) show different ETo patterns can be expected in different geoclimatic regions and different time scales (daily, monthly, annual).
For example, sunshine duration had the highest magnitude negative contribution to ETo variation in the Pearl River Basin ( and ), although ETo exhibited a low sensitivity to it. This was because the relative sunshine duration change was greater than the other variables over the study period. ETo in northeast India also decreased with decreasing sunshine duration and wind speed (Jhajharia et al. Citation2012). Average temperature and wind speed had lower overall negative contributions to the ETo variation numerically, although the patterns shown in show the pattern for annual averaged wind speed matched that of annual ETo better than other variables. Relative humidity exhibited a moderate positive contribution.
Monthly timescale analysis showed a finer detail of sub-seasonal effects in the Pearl River Basin. Significant reduction of sunshine duration in January, March and May–September led to a decreasing trend of ETo, while during the other months, ETo showed an increasing trend responding to the linked air temperature rise and relative humidity reduction. The monthly ETo contribution analysis could help improve agricultural water resource management.
Just as the Pearl River Basin ETo showed differing responses to climatic variables than for other regions or the globe, differential ETo responses within the basin were seen linked to the spatial heterogeneity of the climatic variables (). Relative humidity and average temperature exhibited a positive contribution to ETo throughout the entire basin. On the other hand, the contribution of wind speed showed a significant increasing trend in the eastern basin and the west of Duan, and a lower decreasing trend of sunshine duration in the western region. These caused the significant positive contribution of wind speed to ETo, and offset the smaller negative contribution of sunshine duration (), so ETo showed an increasing trend in these regions.
Local and regional characteristics may dictate the direction of ETo changes (Irmak et al. Citation2012), consistent with our results for the Pearl River Basin. Therefore, it is necessary to study the change in climate variables and ETo on a global scale and refine the trend at different regional scales. Our analysis indicates that the climatic record of ETo cannot be reliably used as a proxy for the change in other atmospheric variables; hence, although a decrease in ETo could be indicative of “global dimming” associated with increased aerosol concentrations in some regions, other variables could be the main cause for decreases in ETo in other regions.
5 Conclusion
This paper quantitatively analyses the spatio-temporal sensitivity and contribution of climate change to the spatio-temporal change of ETo in the Pearl River Basin between 1960 and 2016 at the monthly scale, which can provide a high reference for the regional water cycle, water resources management and agricultural irrigation period. In later studies, more and more remote sensing satellite images can be combined to provide support for more accurate ETo spatial distribution. These may give a comprehensive analysis of climate, carbon dioxide density and vegetation change influence on ETo with the different intensity of human activities or urbanization in different regions.
The ETo in the Pearl River Basin shows a decreasing trend at the beginning of the study period (1960–2016), but then this trend reversed towards the end of the study period. Annual average ETo ranged from 998.9 to 1180.0 mm, and July exhibited the highest monthly ETo of 131.7 mm. The spatio-temporal analysis shows different regions of the basin respond with different sensitivities to relative humidity, sunshine duration, average air temperature and wind speed.
Spatially, monthly ETo showed a decreasing trend along a southeast to northwest transect. The spatio-temporal pattern of ETo was linked to a decreasing trend in sunshine duration, wind speed and relative humidity.
The ETo was sensitive to different climatic variables, with substantially different magnitudes and directions. ETo was sensitive to relative humidity in a negative fashion, with a value of up to – 0.45, while it had positive sensitivities to air temperature, sunshine duration and wind speed of 0.53, 0.27 and 0.11, respectively. Monthly sensitivities to air temperature and sunshine duration were greatest in mid-year, while sensitivity to relative humidity and wind speed were lowest during that time.
These results show that any downscaling of global climate change ETo scenarios requires a high spatio-temporal resolution because of the large variability found in the sensitivity of ETo to climate variables and the spatial and temporal differences in the climate change variables themselves.
Acknowledgements
We appreciate the assistance of the editors, Dr Tegos and another anonymous reviewer for their critical comments and constructive suggestions on the paper.
Disclosure statement
No potential conflict of interest was reported by the authors.
Additional information
Funding
References
- Allen, R.G., et al., 1998. Crop evapotranspiration: guidelines for computing crop water requirements. Rome: FAO, Irrigation and Drainage Paper 56. FAO, 56.
- Bandyopadhyay, A., et al., 2009. Temporal trends in estimates of reference evapotranspiration over India. Journal of Hydrologic Engineering, 14 (5), 508–515. doi:10.1061/(ASCE)HE.1943-5584.0000006
- Brutsaert, W. and Parlange, M.B., 1998. Hydrologic cycle explains the evaporation paradox. Nature, 396 (6706), 30. doi:10.1038/23845
- Burn, D.H. and Hesch, N.M., 2007. Trends in evaporation for the Canadian Prairies. Journal of Hydrology, 336 (1–2), 61–73. doi:10.1016/j.jhydrol.2006.12.011
- Chu, R., et al., 2017. Changes in reference evapotranspiration and its contributing factors in Jiangsu, a major economic and agricultural province of Eastern China. Water, 9 (7), 486. doi:10.3390/w9070486
- Cong, Z.T., Yang, D.W., and Ni, G.H., 2009. Does evaporation paradox exist in China? Hydrology and Earth System Sciences, 13 (3), 357–366. doi:10.5194/hess-13-357-2009
- Dong, B. and Dai, A., 2017. The uncertainties and causes of the recent changes in global evapotranspiration from 1982 to 2010. Climate Dynamics, 49 (1–2), 279–296. doi:10.1007/s00382-016-3342-x
- Fu, Q., et al., 2008. Mechanism of formation of the heaviest pollution episode ever recorded in the Yangtze River Delta, China. Atmospheric Environment, 42 (9), 2023–2036. doi:10.1016/j.atmosenv.2007.12.002
- Goyal, R.K., 2004. Sensitivity of evapotranspiration to global warming: a case study of arid zone of Rajasthan (India). Agricultural Water Management, 69 (1), 1–11. doi:10.1016/j.agwat.2004.03.014
- Grismer, M.E., et al., 2002. Pan evaporation to reference evapotranspiration conversion methods. Journal of Irrigation and Drainage Engineering, 128 (3), 180–184. doi:10.1061/(ASCE)0733-9437(2002)128:3(180)
- Guo, D., Westra, S., and Maier, H.R., 2017. Sensitivity of potential evapotranspiration to changes in climate variables for different Australian climatic zones. Hydrology and Earth System Sciences, 21 (4), 2107–2126. doi:10.5194/hess-21-2107-2017
- He, Y., et al., 2015. Classification-based spatiotemporal variations of pan evaporation across the Guangdong Province. South China, 29 (3), 901–912.
- Herath, I.K., et al., 2017. Spatial and temporal variability of reference evapotranspiration and influenced meteorological factors in the Jialing River Basin, China. Theoretical and Applied Climatology, 131 (3–4), 1417–1428. doi:10.1007/s00704-017-2062-4
- Hobbins, M.T., Ramírez, J.A., and Brown, T.C., 2004. Trends in pan evaporation and actual evapotranspiration across the conterminous U.S.: paradoxical or complementary? Geophysical Research Letters, 31 (13), L13503 13501–13505. doi:10.1029/2004GL019846
- IPCC (Intergovernmental Panel on Climate Change), 2013. Climate change 2013: the physical science basis. Geneva, Switzerland: IPCC, Contribution of Working Group I to the Fifth Assessment Report of the Intergovernmental Panel On Climate Change (T. F. Stocker et al., eds.).
- Irmak, S., et al., 2012. Trend and magnitude of changes in climate variables and reference evapotranspiration over 116-yr period in the Platte River Basin, central Nebraska-USA. Journal of Hydrology, 420–421, 228–244. doi:10.1016/j.jhydrol.2011.12.006
- Jhajharia, D., et al., 2012. Trends in reference evapotranspiration in the humid region of northeast India. Hydrological Processes, 26 (3), 421–435. doi:10.1002/hyp.8140
- Jung, M., et al., 2010. Recent decline in the global land evapotranspiration trend due to limited moisture supply. Nature, 467 (7318), 951–954. doi:10.1038/nature09396
- Kendall, M.G., 1948. Rank correlation methods. Griffin: Ocford.
- Li, C., et al., 2017a. Spatial and temporal evolution of climatic factors and its impacts on potential evapotranspiration in Loess Plateau of Northern Shaanxi, China. Science of the Total Environment, 589, 165–172. doi:10.1016/j.scitotenv.2017.02.122
- Li, G., et al., 2017b. Response of evapotranspiration to changes in land use and land cover and climate in China during 2001–2013. Science of the Total Environment, 596–597, 256–265. doi:10.1016/j.scitotenv.2017.04.080
- Li, X.C., et al., 2013. Spatio-temporal variation of actual evapotranspiration in the Haihe River Basin of the past 50 years. Quaternary International, 304, 133–141. doi:10.1016/j.quaint.2013.02.027
- Liu, T., et al., 2016. Reference evapotranspiration change and its sensitivity to climate variables in southwest China. Theoretical and Applied Climatology, 125 (3–4), 499–508. doi:10.1007/s00704-015-1526-7
- Liu, X. and Zhang, D., 2013. Trend analysis of reference evapotranspiration in northwest China: the roles of changing wind speed and surface air temperature. Hydrological Processes, 27 (26), 3941–3948. doi:10.1002/hyp.v27.26
- Ma, Q., et al., 2017. Changes of reference evapotranspiration and its relationship to dry/wet conditions based on the aridity index in the Songnen Grassland, northeast China. Water, 9 (5), 316. doi:10.3390/w9050316
- Mann, H.B., 1945. Nonparametric tests against trend. Econometrica: Journal of the Econometric Society, 13, 245–259. doi:10.2307/1907187
- McCuen, R.H., 1974. A sensitivity and error analysis CF procedures used for estimating evaporation. JAWRA Journal of the American Water Resoures Association, 10 (3), 486–497. doi:10.1111/j.1752-1688.1974.tb00590.x
- McVicar, T.R., et al., 2012. Global review and synthesis of trends in observed terrestrial near-surface wind speeds: implications for evaporation. Journal of Hydrology, 416–417, 182–205. doi:10.1016/j.jhydrol.2011.10.024
- Ning, T., et al., 2016. Evolution of potential evapotranspiration in the northern Loess Plateau of China: recent trends and climatic drivers. International Journal of Climatology, 36 (12), 4019–4028. doi:10.1002/joc.4611
- Prudhomme, C., et al., 2013. Climate change and river flooding: part 2 sensitivity characterisation for british catchments and example vulnerability assessments. Climatic Change, 119 (3), 949–964. doi:10.1007/s10584-013-0726-3
- Roderick, M.L. and Farquhar, G.D., 2002. The cause of decreased pan evaporation over the past 50 years. Science, 298 (5597), 1410–1411. doi:10.1126/science.1075390
- Roderick, M.L., Hobbins, M.T., and Farquhar, G.D., 2009. Pan evaporation trends and the terrestrial water balance. I. Principles and observations. Geography Compass, 3 (2), 746–760. doi:10.1111/geco.2009.3.issue-2
- Satheesh, S.K. and Krishna Moorthy, K., 2005. Radiative effects of natural aerosols: a review. Atmospheric Environment, 39 (11), 2089–2110. doi:10.1016/j.atmosenv.2004.12.029
- Saxton, K.E.J.A.M., 1975. Sensitivity analyses of the combination evapotranspiration equation. Agricultural Meteorology, 15 (3), 343–353. doi:10.1016/0002-1571(75)90031-X
- Seinfeld, J.H., et al., 2016. Improving our fundamental understanding of the role of aerosol− cloud interactions in the climate system. Proceedings of the National Academy of Sciences, 113 (21), 5781–5790. doi:10.1073/pnas.1514043113
- Sen, P.K., 1968. Estimates of the regression coefficient based on Kendall’s Tau. Journal of the American Statistical Association, 63 (324), 1379–1389. doi:10.1080/01621459.1968.10480934
- Senay, G.B., et al., 2017. Satellite-based water use dynamics using historical Landsat data (1984–2014) in the southwestern United States. Remote Sensing of Environment, 202, 98–112.
- She, D., Xia, J., and Zhang, Y., 2017. Changes in reference evapotranspiration and its driving factors in the middle reaches of Yellow River Basin, China. Science of the Total Environment, 607–608, 1151–1162. doi:10.1016/j.scitotenv.2017.07.007
- Sun, S., et al., 2016. Shift in potential evapotranspiration and its implications for dryness/wetness over Southwest China. Journal of Geophysical Research: Atmospheres, 121 (16), 9342–9355.
- Sun, S., et al., 2017. Attributing the changes in reference evapotranspiration in Southwestern China using a new separation method. Journal of Hydrometeorology, 18 (3), 777–798. doi:10.1175/JHM-D-16-0118.1
- Tabari, H., et al., 2011. Trend analysis of reference evapotranspiration in the western half of Iran. Agricultural and Forest Meteorology, 151 (2), 128–136. doi:10.1016/j.agrformet.2010.09.009
- Tegos, A., et al., 2017. Parametric modelling of potential evapotranspiration: a global survey. Water, 9 (10), 795. doi:10.3390/w9100795
- Tegos, A., Malamos, N., and Koutsoyiannis, D., 2015. A parsimonious regional parametric evapotranspiration model based on a simplification of the Penman–Monteith formula. Journal of Hydrology, 524, 708–717. doi:10.1016/j.jhydrol.2015.03.024
- Thomas, A.J.I.J.O.C., 2000. Spatial and temporal characteristics of potential evapotranspiration trends over China. International Journal of Climatology: A Journal of the Royal Meteorological Society, 20 (4), 381–396. doi:10.1002/(ISSN)1097-0088
- Vautard, R., et al., 2010. Northern Hemisphere atmospheric stilling partly attributed to an increase in surface roughness. Nature Geoscience, 3 (11), 756–761. doi:10.1038/ngeo979
- Wild, M., et al., 2005. From dimming to brightening: decadal changes in solar radiation at earth’s surface. Science, 308 (5723), 847–850. doi:10.1126/science.1103215
- Wild, M., 2009. Global dimming and brightening: a review. Journal of Geophysical Research Atmospheres, 114 (12). doi:10.1029/2008JD011470
- WMO (World Meteorological Organization), 2003. Manual on the global observing system. Geneva, Switzerland: World Meteorological Organization, WMO no 544.
- Xu, C.Y., et al., 2006. Analysis of spatial distribution and temporal trend of reference evapotranspiration and pan evaporation in Changjiang (Yangtze River) catchment. Journal of Hydrology, 327 (1–2), 81–93. doi:10.1016/j.jhydrol.2005.11.029
- Yin, Y., et al., 2010. Attribution analyses of potential evapotranspiration changes in China since the 1960s. Theoretical and Applied Climatology, 101 (1), 19–28. doi:10.1007/s00704-009-0197-7
- Zhang, Q., et al., 2009a. Changing properties of precipitation concentration in the Pearl River basin, China. Stochastic Environmental Research and Risk Assessment, 23 (3), 377–385. doi:10.1007/s00477-008-0225-7
- Zhang, Q., et al., 2018. Is the Pearl River basin, China, drying or wetting? Seasonal variations, causes and implications. Global and Planetary Change, 166, 48–61. doi:10.1016/j.gloplacha.2018.04.005
- Zhang, T. and Chen, Y., 2017. Analysis of dynamic spatiotemporal changes in actual evapotranspiration and its associated factors in the Pearl River Basin based on MOD16. Water, 9 (11), 832. doi:10.3390/w9110832
- Zhang, X., et al., 2009b. Spatial and temporal variation patterns of reference evapotranspiration across the Qinghai-Tibetan Plateau during 1971–2004. Journal of Geophysical Research Atmospheres, 114 (15). doi:10.1029/2009JD011753
- Zhang, Y., et al., 2016. Multi-decadal trends in global terrestrial evapotranspiration and its components. Scientific Reports, 6, 19124.
- Zongxing, L., et al., 2012. Decreasing trend of sunshine hours and related driving forces in Southwestern China. Theoretical and Applied Climatology, 109 (1), 305–321. doi:10.1007/s00704-012-0583-4