
 ?Mathematical formulae have been encoded as MathML and are displayed in this HTML version using MathJax in order to improve their display. Uncheck the box to turn MathJax off. This feature requires Javascript. Click on a formula to zoom.
ABSTRACT
An innovative methodology that combines an indirect physiography-based method for determining the runoff coefficient at a sub-basin scale and a water balance model applied on a daily time scale was developed to calculate the natural groundwater recharge in three watersheds within the Oum Zessar arid area, Tunisia. The effective infiltration was calculated as part of the water surplus by considering the average available water content (AWC) of soil and an average runoff coefficient for each sub-basin. The model indicates that the sub-basins covered mainly by the “artificial” soils of tabias and jessour, characterized by average AWC values greater than 150 mm, did not contribute to natural groundwater recharge over the 10-year period (2003–2012) considered. The estimated volume for the Triassic aquifer amounted to about 4.5 hm3 year−1, which is consistent with previous studies. For the Jurassic and Cretaceous aquifers, the estimated volumes amounted to about 200 dm3 year−1.
Editor S. Archfield; Associate Editor F. Tauro
1 Introduction
The areas most vulnerable to environmental changes, particularly hydrological changes, are arid regions (approximately 20% of the world’s land area) that experience severe land and water degradation. These vulnerable ecosystems are subject to great pressure due to rapid population growth, which leads to the uncontrolled use of surface water and groundwater for irrigation (Shen and Chen Citation2010). The Mediterranean areas of Southern Europe, North-Africa, and the Middle East are affected by dramatic changes in the sustainability, quantity, quality, and management of water resources. An increase in temperature and a decrease in precipitation at the end of the 21st century are forecast by most climate models (García-Ruiz et al. Citation2011).
Groundwater is essential for meeting fresh water demand worldwide to satisfy urban, agricultural, industrial, and environmental needs, particularly in arid and semiarid regions. Currently, groundwater is the main source of drinking water for at least half the world’s population, which includes a significant part of urban population as well as rural communities (Puri et al. Citation2008, Gleeson et al. Citation2012). In developing countries, dependence on groundwater is high owing either to water scarcity or a lack of safe drinking water from surface water supplies (Ghiglieri and Carletti Citation2010, Owen et al. Citation2010). In particular, during extended drought events, groundwater also acts as a key strategic resource. Furthermore, groundwater is often inadequately managed in terms of ensuring its long-term sustainability, especially in arid and semi-arid regions. Most of the major aquifers in these regions, particularly dry areas that rely most heavily on groundwater, are experiencing rapid depletion rates due to overexploitation (Famiglietti Citation2014).
Interactions between climate, geology, morphology, soil condition, and vegetation affect the groundwater recharge process. As potential evapotranspiration generally exceeds rainfall in (semi-)arid areas, the groundwater recharge process depends particularly on the following aspects: highly concentrated rainfall events; accumulation of runoff water in depressions and streams; and rapid percolation through cracks, fissures, or solution channels. The presence of thick alluvial soils normally hinders groundwater recharge, as they allow for high water retention during the wet season. Vegetation subsequently extracts soil water in the next dry season. Conversely, favourable recharge conditions are created by a poor vegetation cover on permeable soil or a fractured porous bedrock near the surface combined with high-intensity rainfall events (De Vries and Simmers Citation2002). Water budget calculations are important because they provide an accurate estimate of the water resources in an area, which are related to the natural recharge of aquifers.
Groundwater recharge can be estimated by several methods which have been intensively discussed in the literature (Lerner et al. Citation1990, De Vries and Simmers Citation2002, Scanlon et al. Citation2002). Recently, the importance of the groundwater recharge calculation was stated by Smerdon and Drewes (Citation2017), who provide an overview of recent studies exploring the recharge process through different estimation methods and modelling approaches. The different approaches depend on the availability of data and the required level of accuracy. Of these, numerical models are an effective tool that have been developed to compute groundwater recharge using daily balances (Bellot et al. Citation2001, Samper et al. Citation2007, Touhami et al. Citation2013). Spatially distributed modelling is an important instrument for studying the hydrological cycle, and the results of such simulations are particularly relevant to water resources assessment. The following are examples of effective distributed models: Water balance Simulation Model-ETH (WaSiM-ETH) (Klok et al. Citation2001, Wagner et al. Citation2009); TOPographic Kinematic APproximation and Integration (TOPKAPI) (Liu and Todini Citation2002); Gridded Surface/Subsurface Hydrologic Analysis (GSSHA) (Downer and Ogden Citation2004); and the WetSpass model (Tilahun and Merkel Citation2009), the latter of which integrates GIS and the water balance method. Spatially semi-distributed models, such as PREecipitation-Runoff-EVApotranspiration Hydrological Response Unit (PREVAH) (Viviroli et al. Citation2009) and the Soil and Water Assessment Tool (SWAT) (Arnold et al. Citation1998, Neitsch et al. Citation2005), use a conceptual process-oriented approach by implementing HRUs as a cost-efficient way of achieving spatially distributed results. In SWAT, HRUs are the smallest spatial units of calculation and are homogeneous in terms of soils, land use, and slope (Gassman et al. Citation2007, Xu et al. Citation2009), which allows the simulation of a high level of spatial detail.
The objective of this study was to develop a combined methodology to estimate natural aquifer recharge in three watersheds of the Oum Zessar area, an arid region in south-eastern Tunisia. This study proposes an innovative method that combines an indirect physiography-based method for determining the runoff coefficient first developed by Kennessey (Citation1930) and subsequently modified and tested by several authors in different semi-arid regions in the Mediterranean area (Tardi and Vittorini Citation1977, Barazzuoli et al. Citation1986, Spadoni et al. Citation2010, Ghiglieri et al. Citation2014, Grillone et al. Citation2014), and a water balance model applied on a daily time scale as a modification of the model proposed by Allen et al. (Citation1998). This model allows the calculation of effective infiltration Ie through the water balance of the root zone, when a water surplus occurs, by considering crop evapotranspiration under stress conditions. Ultimately, estimates of the regulatory reserves/stock volumes for each aquifer were obtained by overlaying the results of effective infiltration (Ie) over the spatial distribution of the aquifers.
2 Study area
The Oum Zessar study area is located in the province (governorate) of Médenine. It extends from the limit of the Great Erg Oriental in the west to the Mediterranean Sea (Gulf of Gabès) in the east, crossing the Dahar plateau, Beni Khedache Mountains and Jeffara plain ()). From ecological, hydrological and socio-economic points of view, this area can be considered representative of arid southeastern Tunisia.
Figure 1. (a) Oum Zessar study area and (b) hydrogeological map.
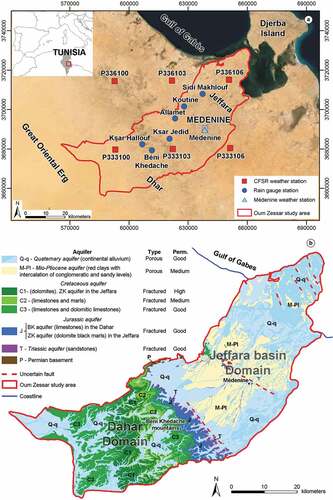
The Dahar is a calcareous plateau with an elevation ranging from 400 to 600 m a.s.l. stretching in a NW–SE direction. It is dissected by small wadis (ephemeral rivers) and ends in the east in a cuesta characterized by a relatively steep escarpment descending abruptly from its crest (Ouessar Citation2007). The Jeffara is a large plain consisting of crusted Quaternary deposits stretching between the Matmata mountains, the Dahar, the littoral and the Tunisian border with Libya. At its highest point, it has an elevation of 100 m a.s.l.; the plain is crossed by several wadis that drain the mountain zone and, after traversing a long distance on a rather flat slope, flow into the sea or sebkhats (Ouessar Citation2007). The study area, which is typically agro-pastoral, has experienced a rapid expansion of crop cultivation in flatter areas and marginal rangelands. This phenomenon has had negative effects on native rangelands, reducing the grazing areas at disposal to animals. Desertification is on-going and aggravated by anthropogenic pressures due to changes in socio-economic policies and population growth (Sghaier et al. Citation2011).
The study area is characterized by an arid Mediterranean climate that is influenced by both the Dahar and the Matmata Mountains (continental arid) and the Mediterranean Sea (Gulf of Gabès) (maritime arid). The average annual rainfall is between 150 and 240 mm per year, and around 20 rain days are recorded each year during the “wet” season, which stretches from November to January (Ouessar Citation2007, Ouessar et al. Citation2008). Rainfall is characterized by a high variability, both in time and space. Owing to the high temperatures and low rainfall levels, potential evapotranspiration (ET0) is very high, reaching a value of 1450 mm in Médenine (Hargreaves method) (Ouessar Citation2007). Thus, the climatic water balance is almost negative throughout the year (Ouessar Citation2007, Adham et al. Citation2016).
The study area mainly consists of Permian to Holocene sedimentary successions that host several aquifers (Ouessar and Yahyaoui Citation2006, Ouessar Citation2007) ()).
2.1 Jeffara of Médenine aquifer
The shallow aquifer of Jeffara of Médenine covers the entire coastal plain and the valleys in the Dahar domain. It is hosted in Quaternary deposits consisting of continental alluvium. The thickness of this aquifer increases progressively towards the sea, and the total depth of wells exploiting the shallow aquifer varies from 3 to 20 m. The transmissivity varies from 5–9 × 10⁻⁴ to 8–9 × 10⁻³ m2 s−1 (Ouessar and Yahyaoui Citation2006). The recharge of this aquifer is mainly represented by direct infiltration of rainfall, and the infiltration rate from the wadis during floods varies between 30% and 50% of the river flow (Ould Baba Sy Citation2005, Yahyaoui Citation2007).
2.2 Mio-Pliocene aquifer
The Mio-Pliocene aquifer is hosted in the Miocene continental deposits, which consist of red clays with intercalations of conglomeratic and sandy levels (Benton et al. Citation2000). The thickness of these sand deposits increases from 25 to 80 m towards the sea. They are characterized by fine granulometry, and transmissivity ranges from 1 × 10⁻³ to 2 × 10⁻² m2 s−1 (Kamel et al. Citation2013).
2.3 Zeuss–Koutine aquifer
The Zeuss–Koutine aquifer (ZK) in the Jeffara plain includes two main entities separated by the Médenine Fault: the ZK Jurassic aquifer and ZK Senonian aquifer. The ZK Jurassic aquifer consists of a series of dolomite black marls of basal Jurassic. In the ZK Lower Senonian aquifer, the unconfined layer of the lower Senonian and Turonian can be replenished by runoff but also by lateral flow from the ZK Jurassic through the fault (Ouessar Citation2007). The Zeuss–Koutine aquifer is mainly exploited for drinking water and irrigation. The withdrawals have increased from 206 L s−1 in 1977 to 641 L s−1 in 2014, and this exploitation has produced a continuous piezometric decline of 0.5 to 1 m year−1 on average (Jarray et al. Citation2017).
2.4 Béni Khédache aquifer
The Béni Khédache aquifer (BK), in the Dahar, includes two carbonate sequences: the condensed series of the upper Triassic to the lower Bathonian and limestones of the upper Jurassic. They are separated by clay and sandstone of the Techout formation. This aquifer can be reached at 200–300 mbgl. It is directly replenished by the infiltration of runoff water from the Dahar plateau or percolation from the eastern cliff (Ouessar Citation2007).
2.5 Triassic sandstone aquifer
The Triassic sandstone aquifer (Grès de Trias) stretches over a large area between the upper Permian outcrops (Jebel Tébaga) to the north, outcroppings of Dahar to the west, the Jurassic aquifer to the east and, along the Jeffara plain to the south-east up to Tripoli, Libya (Besbes et al. Citation2005, Ouessar Citation2007). In the continental Jeffara plain, lower to middle Triassic formations outcrop along the wadis because of the erosional processes affecting the Cenozoic deposits (Arras et al. Citation2015). Therefore, the piedmont area and the wadis are considered the preferential recharge areas. The transmissivity varies from 0.33 × 10⁻³ to 8.4 × 10⁻³ m2 s−1 (Yahyaoui Citation2007). This aquifer is used mainly for drinking water and irrigation. Since the end of the 1990s, the rate of exploitation has exceeded the rate of replenishment. In 2010, the rate of overuse reached 160%, which resulted in a declining trend in the piezometric level (WADIS-MAR Citation2016).
In southeast Tunisia, because of water scarcity, various water harvesting techniques have been introduced over many centuries to make the land productive despite its geographical location. Jessour (singular jessr) are hydraulic units consisting of an impluvium, terrace and dyke, generally occupy inter-mountain areas and hill watercourses to intercept runoff and sediment; they are typically arranged in the form of a gradoni, a series of contour ditches used mainly for growing trees. The impluvium or catchment is the area in which runoff water is collected and conveyed, and it is bounded by a natural water divide line. The terrace or cropping zone is the area in which farming is practiced. It is formed progressively by the deposition of sediment, which creates artificial soil (up to 5 m deep) close to the dyke. The dyke is a barrier made of earth and equipped with a central and/or lateral spillway. It is used to block sediment and runoff water (Fleskens et al. Citation2005, Schiettecatte et al. Citation2005, Ouessar Citation2007). The tabia technique is a replica of the jessour system constructed in foothill and piedmont areas, where the slope does not exceed 3% and the soils are relatively deep.
3 Materials and methods
The proposed methodology is represented in the conceptual workflow in , and is described as follows.
Figure 2. Conceptual workflow for the new methodology proposed to estimate the natural aquifer recharge.
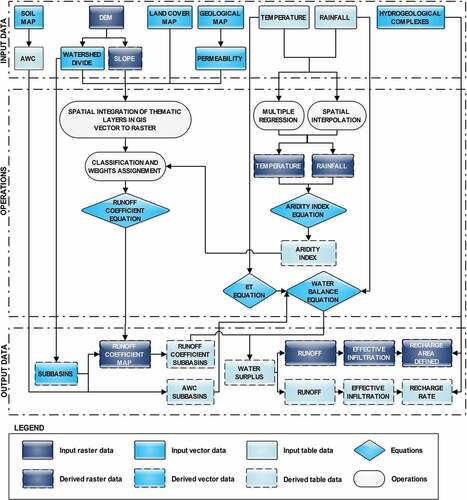
This new approach allows researchers to overcome the challenges presented by the critical condition that typically occurs in arid regions, where the magnitude of the recharge rate is small in comparison with other variables, especially evapotranspiration (De Vries and Simmers Citation2002, Scanlon et al. Citation2002). In these environments, the water budget should be calculated on a daily time step, as precipitation sometimes greatly exceeds evapotranspiration on a single day, whereas the effects of extreme precipitation events, which are the most responsible for the recharge of aquifers, can be attenuated by averaging over longer time periods. This approach is not a substitute for traditional methodologies relying on expensive field datasets, but it is useful in providing a reasonable, but conservative, natural aquifer recharge appraisal, particularly in ungauged watersheds.
The methodology presented here was applied at the watershed scale. The results suggest that it is necessary to enhance the accuracy of the natural aquifer recharge estimates considering the hydrogeological, hydrogeochemical and, isotopic evidence recently obtained as part of the currently unpublished results of the WADIS-MAR project (www.wadismar.eu).
3.1 Watershed delineation
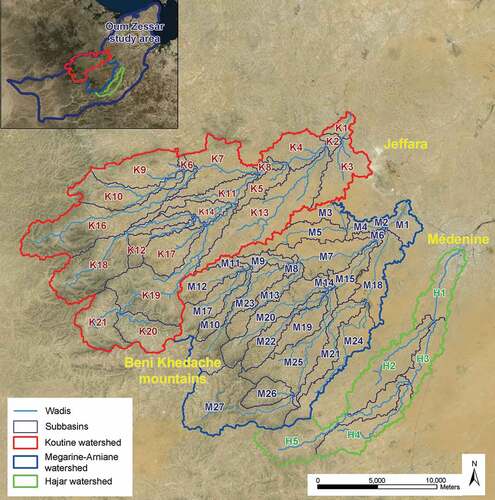
To estimate the water budget, three watersheds were delineated in the study area: Koutine (271.6 km2), Megarine-Arniane (247.4 km2) and Hajar (80.3 km2) (). The Shuttle Radar Topography Mission 1 Arc-Second Global Digital Elevation Model (SRTMGL1 DEM; http://earthexplorer.usgs.gov) released in 2014 was used to define the watersheds, sub-watersheds, stream networks and outlets for each sub-basin. It covers the African continent in 1° × 1° tiles at a 1 arc-second (about 30 m) resolution.
Figure 3. Koutine, Megarine-Arniane and Hajar watersheds.
3.2 Climate data
Monthly rainfall data (1970–2012) recorded by six rain gauge stations (Koutine, Allamet, Ksar Hallouf, Ksar Jedid, Sidi Makhlouf and Béni Khedache) operated by the hydrological service of the Water Resources Directorate of the Ministry of Agriculture (DGRE) were considered ()). The only available rainfall and temperature data measured on a daily time step were those from the weather station of Médenine (1977–2012); the data can also be downloaded from the website www.TuTiempo.net. Climatic data from six more weather stations of the National Centers for Environmental Prediction’s Climate Forecast System Reanalysis (CFSR) (1979–2014) (http://globalweather.tamu.edu), located in and around the watersheds, were also considered ()). The CFSR climate data are produced using cutting-edge data assimilation techniques (both conventional meteorological gauge observations and satellite irradiances) and highly advanced (coupled) atmospheric, oceanic, and surface-modelling components at a resolution of approx. 38 km. Consequently, the output of CFSR data processing involves various spatial and temporal interpolations (Dile and Srinivasan Citation2014). The assessment of the reliability of CFSR data compared to measured data was carried out through a statistical analysis to evaluate correlations, trends, and accuracy. For this purpose, the average daily rainfall and temperature data were considered. The average daily data of the CFSR stations were compared to those of the Médenine weather station (the only one with available daily measured data).
3.3 Runoff coefficient, Ck
The mean annual runoff coefficient (Ck) was determined through the procedure described by Ghiglieri et al. (Citation2014) and is given in . For each of the partial runoff components (Ca, Cv and Cp), three series of coefficients are defined according to an interval of values in the annual average aridity index Ia to take the climatic conditions into account. The aridity index Ia is determined according to the De Martonne equation modified by Tardi and Vittorini (Citation1977) (Ghiglieri et al. Citation2014). Once the Ia is calculated, a series of coefficients are selected to calculate the partial runoff coefficients (Ca, Cv and Cp) (); then, the Ck is evaluated by their sum.
Table 1. Table of partial runoff coefficients classified by aridity index Ia (modified from Ghiglieri et al. Citation2014).
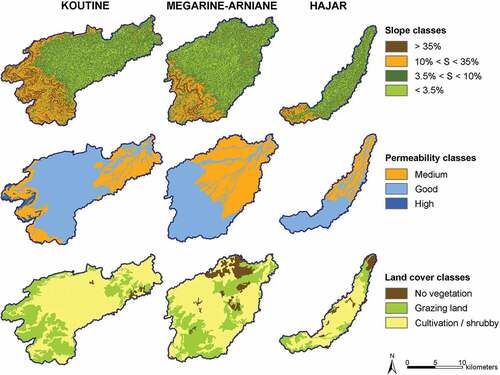
The slope layer obtained from the SRTMGL1 DEM, where the slope was expressed as a percentage, was classified into four classes (Spadoni et al. Citation2010, Ghiglieri et al. Citation2014). The land cover layer was obtained from the land use/land cover map developed by Afrasinei et al. (Citation2017) via a visual interpretation of Landsat 8 satellite images and validated by detailed ground truth data. The original land cover classes were grouped according to the four classes described in .
Table 2. Classes of land cover, Cv (from Ghiglieri et al. Citation2014).
The permeability layer was derived from the official geological map (1:100 000) (Office National des Mines Citation1996). Each hydrogeological complex was defined by the aggregation of geological formations with permeability conditions similar to those listed in the literature (Swezey Citation1999, Ould Baba Sy Citation2005, Ouessar and Yahyaoui Citation2006, Yahyaoui Citation2007, Kamel et al. Citation2013, Chihi et al. Citation2015) and then classified into three classes according to the runoff coefficient Ck method (). The spatial distribution of each class for each layer is shown in .
Table 3. Classes of permeability, Cp (modified from Ghiglieri et al. Citation2014).
Figure 4. Spatial distribution of the classes of each thematic layer (slope, permeability and land cover) for the three watersheds.
The runoff coefficient was calculated using a procedure within the GIS environment (ESRI ArcGIS 10) in which each vector information layer related to the three watersheds (Koutine, Megarine-Arniane and Hajar) is converted to raster format using the same cell size of the SRTMGL1 DEM and then processed by overlay mapping ().
3.4 Multiple regression for aridity index calculation
In this study, we used monthly rainfall data from the six rain gauge stations (Koutine, Allamet, Ksar Hallouf, Ksar Jedid, Sidi Makhlouf and Beni Khedache) and the Médenine weather station, and monthly minimum, maximum, and mean temperature data from the six CFSR weather stations with Médenine data over a 30-year period (1981–2010). To obtain monthly temperature and precipitation maps, a procedure based on the statistical relationship between climate data and the geographic parameters of the study area was adopted and implemented in GIS. Spatial interpolations of monthly climatic variables (average precipitation and average mean temperature) were performed using single and multiple regressions, considering the elevation and distance from the sea obtained from the SRTMGL1 DEM as independent geographic variables (Boi et al. Citation2011, Canu et al. Citation2014). The calculation was carried out over an area of 1 600 km2 including all the rain gauge and weather stations. The regression equations obtained for precipitation and mean temperature are given in .
Table 4. Regression equations and statistics. Alt: altitude (m a.s.l.); Dist: distance from the sea (m); Std err.: standard error; Signif. F: significance F.
These equations were applied to SRTM DEM and the distance from the sea by means of map algebra procedures in ArcGIS to obtain the average monthly precipitation and temperature maps. Other spatial interpolation methods, such as kriging (spherical method) and spline and inverse distance weighting (IDW), were compared using the Geostatistical Analyst extension in ArcGIS; this was done on average monthly data for which the single or multiple regression method was not appropriate (R2 < 0.5). Because of the few available stations, their spatial distribution in the study area, and the low autocorrelations of data, the IDW method turned out to be the most suitable for these spatial interpolations. The average monthly and annual precipitation and temperature maps were obtained using map algebra calculations. In addition, monthly precipitation and the monthly mean temperature of the hottest month (August) were used to calculate the aridity index Ia (Tardi and Vittorini Citation1977) ().
Table 5. Average annual rainfall and mean temperature and average rainfall and mean temperature in the hottest month (August) for the reference period (1981–2010). P: annual rainfall (mm); p: rainfall in the hottest month (mm); T: annual mean temperature (°C); t: mean temperature in the hottest month (°C).
3.5 Ck calculation and annual water budget
The annual average aridity index Ia was calculated for the 30-year period (1981–2010) (Equation 1) by a map algebra procedure considering the same cell size of the SRTMGL1 DEM. As the Ia was less than 25 () for each watershed, the analysis considered the series of coefficients related to the class Ia < 25 for each thematic layer defined by the method. The overlay mapping of the three layers by summing the Ca, Cp and Cv values of each cell allowed us to determine the spatial distribution of Ck. The 36 possible combinations of classes and the Ck values were divided into five classes (Ghiglieri et al. Citation2014). The spatial distribution of the runoff coefficient within each watershed is shown in .
Figure 5. Distribution of runoff coefficient classes for the three watersheds.
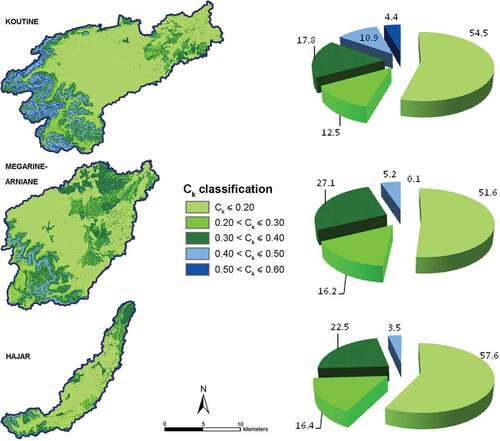
Figure 6. Comparison between average monthly rainfall data of the Médenine weather station and average data of the other stations (six rain gauges and Médenine station): (a) histograms (dark blue: all stations data; light blue: Médenine data), and (b) correlation.
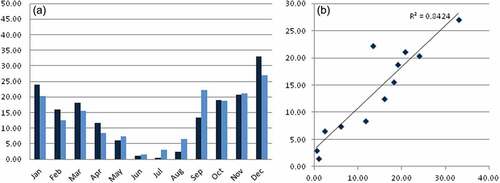
Figure 7. (a) Water balance of the root zone and (b) water stress coefficient Ks (modified from Allen et al. Citation1998).
To calculate the average annual effective infiltration Ie (natural aquifer recharge) over the 30-year period (1981–2010), the standard water balance equation was used:
where P is the average annual precipitation, ETa is the annual actual evapotranspiration, and R is the average annual runoff. The annual actual evapotranspiration was calculated using the empirical equation proposed by Turc (Citation1954) and modified by Santoro (Citation1970), which is considered appropriate for arid and semiarid regions in the Mediterranean area (Barroccu and Soddu Citation2006, Ghiglieri et al. Citation2006, Giannecchini and Doveri Citation2016):
where P is the average annual precipitation (mm) and T is the average annual temperature (°C). By applying Equation (3) (Spadoni et al. Citation2010, Ghiglieri et al. Citation2014), it was possible to calculate the average annual runoff R using the runoff coefficient Ck:
Compared to the above mentioned studies, where the annual precipitation was greater than the annual actual evapotranspiration, in this study, the annual effective rainfall (P – ET), calculated on an annual basis, was < 0 for most areas, except for a small region in the Dahar in the Koutine and Megarine-Arniane watersheds, thereby preventing an estimate of runoff and effective infiltration from being determined. This is due to the erratic behaviour of rainfall in arid environments, such as southern Tunisia, where high intensity rainfall events are concentrated in a few days. Only after short but intense events does rainfall exceed evapotranspiration, leading to runoff and recharging the aquifers. Such a condition led to the use of daily precipitation and temperature data to estimate the natural recharge of aquifers.
3.6 Water budget on daily basis
Daily precipitation and mean temperature data from the Médenine weather station were considered for the entire area covered by the three watersheds in the daily calculations of the water budget. In fact, because climate data from the Médenine station are the only data available that are measured daily, this station can be considered as representative of the climate of the study area, especially for the Jeffara plain, as shown by the graphs in . The water budget was estimated for each sub-basin of each watershed over a 10-year period (2003–2012) that presented the most complete climate data series.
In this work, a modified water balance model based on the one proposed by Allen et al. (Citation1998) (FAO Paper 56) was applied on a daily time scale. The model considers the effective infiltration Ie (or deep percolation DP) as part of the water surplus in the soil. As in Allen et al. (Citation1998), crop evapotranspiration under stress conditions is considered and depleted water is computed as the result of the water balance of the root zone, as explained in ). This estimation considered a reference crop with standard characteristics.
Saturation of the soil active layer is reached when the total available water (TAW) content is a maximum. Any additional water gives rise to runoff and deep percolation. If the soil water content decreases below a threshold value, crops begin to experience stress as soil water can no longer be transported quickly enough towards the roots to respond to transpiration demand. Readily available soil water is the fraction of TAW which a crop can extract from the root zone without experiencing water stress:
where RAW is the readily available soil water in the root zone (mm) and p is the average fraction of total available soil water (TAW; usually ranging between 0–1) that can be depleted from the root zone before moisture stress (reduction in ET) occurs. For a standard crop, a value of 0.50 for p is common (Allen et al. Citation1998). The effects of soil water stress on crop ET is considered by multiplying the reference evapotranspiration ET0 by the water stress coefficient Ks. In this study, the ET0 used to calculate ETc was estimated using the Hargreaves equation (Hargreaves and Samani Citation1985). The water content in the root zone can also be expressed by root zone depletion Dr, i.e. the water shortage relative to field capacity (θFC). At θFC, the root zone depletion is zero (Dr = 0). When soil water is extracted by evapotranspiration, depletion will increase and induce stress if Dr is equal to RAW. After the root zone depletion exceeds RAW (i.e. the water content drops below the threshold θt), the root zone depletion is high enough to limit evapotranspiration to less than potential values, and crop evapotranspiration begins to decrease in proportion to the amount of water remaining in the root zone ()). For Dr > RAW, Ks is given by
where Ks is a dimensionless transpiration reduction factor dependent on available soil water (0–1), and the other terms are those described above. In this simplified model, daily soil water balance can be described as follows (Allen et al. Citation1998):
where Dr,i is the root zone depletion at the end of day i (mm), Dr,i−1 is the water content in the root zone at the end of the previous day, i – 1 (mm), Pi is the precipitation during day i (mm), Ri is the runoff from the soil surface during day i (mm), ETc,i is crop evapotranspiration during day i (mm) and DPi is deep percolation during day i (mm). Thus, it is also true that
A water surplus (Ri + DPi) occurs only when ΔDr,i (Dr,i _Dr,i−1) < Pi – ETc,i,. The DPi is the fraction of the water surplus that can effectively infiltrate and recharge the aquifers.
In this study, TAW was considered equal to the Available Water Content (AWC) of soils in the study area, according to Ouessar et al. (Citation2009) (). For the Koutine watershed, the soil map of the Jeffara region (1:200 000) (Taamallah Citation2003), modified by Ouessar et al. (Citation2009), was used to account for the “artificial” soils built up behind the water harvesting structures (jessour and tabias) as deposited sediments. For the other two watersheds, the soil map of the Governorate of Médenine (Carte Agricole 1:200 000) (Ministère de l’Agriculture, Environnement et Ressources Hydrauliques Citation2003), modified to consider soils of jessour and tabias, was used.
Table 6. Available Water Content (AWC) and depth of soils in the study area (modified from Ouessar et al. Citation2009).
For each sub-basin, an average AWC value was calculated as the weighted average of the AWC values of the soil classes. This considered the weights the area of the surfaces covered by each soil type within the sub-basin.
The daily runoff was estimated by multiplying the water surplus by the runoff coefficient Ck. For this purpose, an average Ck value for each sub-basin was considered. Finally, the daily effective infiltration Ie was obtained from the difference between water surplus and runoff.
3.7 Calculation of the average yearly natural recharge of the aquifers
The average annual natural groundwater recharge for the Triassic, Jurassic, and Cretaceous aquifers were estimated over the 10-year reference period (2003–2012). These water volumes represent the yearly renewable water resources as a result of the rainwater infiltration process. They were calculated by multiplying the Ie of each sub-basin by the surface of each aquifer in each sub-basin. For this purpose, the spatial distribution of each aquifer within the three watersheds was defined () using an official geological map (1:100 000) (Office National des Mines Citation1996) and 3D hydrogeological model reconstruction data (Carletti Citation2017). The Triassic aquifer in the plain, in particular, was considered in the natural recharge calculation as the outcropping Mio-Plio-Quaternary deposits have low thickness, lie directly on Triassic sandstones, host local and perched aquifers, and are in hydraulic communication with the underlying Trias aquifer (Yahyaoui Citation2007).
4 Results
4.1 Climate data assessment
A comparison between CFSR station 336103 and the Médenine station is shown in . This comparison exemplifies the general results related to the assessment of the reliability of CFSR data and that measured by the Médenine weather station. Among the CFSR stations located in the plain, 336103 has the closest elevation (83 m a.s.l.) to the Médenine station (117 m a.s.l.), and both stations have a similar distance from the sea. The results are summarized as follows: (i) the average daily rainfall data from both stations present no correlation and (ii) the mean maximum and minimum daily temperature data present a very high correlation (R2 = 0.98–0.99), even though the minimum temperature values of the CFSR station recorded during summer months are underestimated.
4.2 Distribution of ck in the watersheds
The most represented classes of the runoff coefficient Ck for all the watersheds (Koutine, Megarine-Arniane, and Hajar), are Ck < 0.2 (frequency from 51.6% to 57.6%), 0.2 < Ck < 0.3 (12.5–16.4%), and 0.3 < Ck < 0.4 (17.8–27.1%) (). The coefficients in the first class are mainly concentrated in the Jeffara plain but are also recorded in the Beni Khedache mountain region, which is characterized by cultivated/shrubby areas and mainly associated with jessour where the slope is quite low (< 10%). Those in the second class are primarily located in parts of the plain corresponding to grazing areas (mixed in the Beni Khedache Mountains with cultivated/shrubby areas) with a slope between 10% and 35%. Areas classified in the third runoff class are ubiquitous and characterized mostly by bare soil conditions in the plain and by grazing/pasture lands, with slopes between 10% and 35% in the Beni Khedache mountain area. In addition, this runoff class also matches outcrops of highly permeable rocks only in the mountainous area of the Koutine watershed.
4.3 Statistical analysis of single runoff factors (Ca, Cv and Cp)
A statistical analysis of the results was performed to assess the influence of the individual factors (Ca, Cv and Cp) on the classification of runoff coefficient Ck (). ) shows a graphical representation of the distribution of the slope classes for each class of Ck. For all three watersheds, only slope values less than 10% affect the class with the lowest Ck values (Ck < 0.2), and they decrease to 50% for the Ck values between 0.2 and 0.3. The influence of the slope values between 10% and 35% exceeds 70% for the third Ck class (between 0.3 and 0.4) in the Koutine watershed. Slope values greater than 35% account for 50 – 80% of the Ck values which range from 0.4 to 0.5, whereas they influence 100% the values in the fifth Ck class (between 0.5 and 0.6). ) shows that the cultivated/shrubby land-cover class has a decreasing influence with increasing values of Ck. The grazing land class increases from 45% for Ck values between 0.2 and 0.3 to 100% for Ck values between 0.5 and 0.6 in the Koutine watershed. The no vegetation/bare soil class affects mainly the Ck values between 0.3 and 0.5 in the Hajar and Megarine-Arniane watersheds. In the latter watershed, this class reaches 100% for Ck values between 0.5 and 0.6, although this Ck class represents only 0.01% in the Ck spatial distribution. ) shows the influence of the permeability classes. The good permeability class oscillates between 35% and 85% for Ck values up to 0.5 and, only in the case of the Megarine-Arniane watershed, it reaches 100% for Ck values between 0.5 and 0.6. The medium permeability class ranges from 15% to 55% for Ck values lower than 0.5. In the Koutine watershed, it represents 100% of the Ck values between 0.5 and 0.6. The high permeability class, recorded only on the Beni Khedache mountains in the Koutine watershed, generally has a low influence.
4.4 Runoff and effective infiltration
Water budget estimations carried out on a daily basis, over the 10-year period (2003–2012), allowed for the identification of those rainfall events that generated a water surplus, therefore causing runoff and recharge of the aquifers, for each sub-basin of each watershed. A statistical analysis based on these rainfall events and related to the estimation of runoff and effective infiltration for each sub-basin of the three watersheds was carried out. The results included the following: average runoff (R) (mm), average effective infiltration (Ie) (mm), average precipitation (P) (mm), total number of such rainfall events, average number of days for each event, and number of events of 1 day (Supplementary material, Tables S1, S2 and S3). Furthermore, the average AWC of the soils related to each sub-basin was classified into four classes (mm): Class 1: AWC < 50; Class 2: 50 < AWC < 100; Class 3: 100 < AWC < 150 and Class 4: AWC > 150.
The results related to the Koutine watershed are shown in (and in the Supplementary material, Table S1). Considering the AWC classes of the soils, they are summarized as follows:
Class 1 (AWC > 150 mm): the sub-basins included in this class are characterized mainly by deep soils (1 or 2 m) corresponding to the “artificial” soils of tabias and jessour. They are located in the plain (K1 and K2) and in the northern part of the watershed (K6, K7, K9 and K10). These sub-basins did not contribute to R and Ie during the reference period;
Class 2 (100 < AWC < 150 mm): these sub-basins are distributed across the entire watershed. The average R varies from 0.55 to 5.50 mm; the latter value corresponds to sub-basin K21 which is characterized by the highest value of Ck (0.34). The average Ie varies from 1.86 to 17.30 mm. This highest value is related to sub-basin K17, which has almost the same characteristics (AWC, average rainfall, number of rainfall events, etc.) as K21, except for the value of Ck, which is around the half (0.164). Within this category, for those sub-basins having an average AWC between 100 and 120 mm, the rainfall events that produced a water surplus vary between 90 and 100 mm, with an average duration of about 3–4 d; however, only 3 events occurred in 10 years, of which only one event lasted a day. For the other sub-basins included in this AWC class, the average rainfall is as high as 138 mm, with an average duration of 6 d and only 1 event occurred in the reference period;
Class 3 (50 < AWC < 100 mm): the two sub-basins (K18 and K19) included in this class are mainly concentrated on the Dahar. In this case, the average rainfall that generated R and Ie decreases to 66–68 mm and the number of 1-day events increases to 4–5; and
Class 4 (AWC < 50 mm): this class includes the sub-basins that contributed the most to R and Ie (K5, K8, K11, K13 and K14). They are concentrated in the central-eastern part of the watershed and are covered by shallow soils (depth between 0.20 and 0.40 m). The average R varies from 2.32 to 5.79 mm, whereas the average Ie varies between 16.00 and 18.58 mm. The total number of rain events that produced a water surplus was between 24 and 42, with average rainfall between 32.96 and 46.68 mm and an average duration of about 2 d. The 1-day rainfall events increased to 18.
(and the Supplementary material, Table S2) shows the results for the sub-basins of the Megarine-Arniane watershed, which are described below:
Class 1 (AWC > 150 mm): the sub-basins belonging to this class are located in the central-eastern part of the plain and did not contribute to R and Ie during the period 2003–2012;
Class 2 (100 < AWC < 150 mm): these sub-basins are distributed across the entire area. The average R varies from 0.13 to 4.87 mm and the average Ie varies between 0.45 and 17.70 mm. In general, as AWC values increase, the average rainfall that produced a water surplus increases and the number of events decreases: for AWC values over 120 mm, the average rainfall exceeds 110 mm and only 1 event occurred;
Class 3 (50 < AWC < 100 mm): these sub-basins are located in the central and northern part of the watershed. The average rainfall that generated R and Ie decreases to 64.23 mm and the 1-day event number increases to 6–7; and
Class 4 (AWC < 50 mm): only sub-basin M4, which is located in the northern part of the watershed, is included in this class. The average R is 4.79 mm, and the average Ie is 10.34 mm. The average rainfall amount is 31.26 mm, and the total number of rain events that generated a water surplus is 45, with an average duration of about 2 days/event, whereas the 1-day rainfall events are 19.
The results for the Hajar watershed are reported in (and in the Supplementary material, Table S3), and are summarized as follows:
Class 1 (AWC > 150 mm): only sub-basin H3 belongs to this class and the same results described above for similar sub-basins of the other watersheds are reported;
Class 2 (100 < AWC < 150 mm): these sub-basins are located in the central-western part of the watershed. H2 and H4 have almost the same value as Ck, but the latter contributed with a higher value of average Ie (17.23 mm) owing to an unique rainfall event that lasted seven days and was characterized by a cumulative precipitation of about 138 mm;
Class 3 (50 < AWC < 100 mm): this class includes only sub-basin H1, located in the northern part of the watershed. It contributed with an average R of 5.98 mm and an average Ie of 14.64 mm; 13 rainfall events were recorded, 7 of them being concentrated in 1 day; and
Class 4 (AWC < 50 mm): No sub-basin belongs to this class.
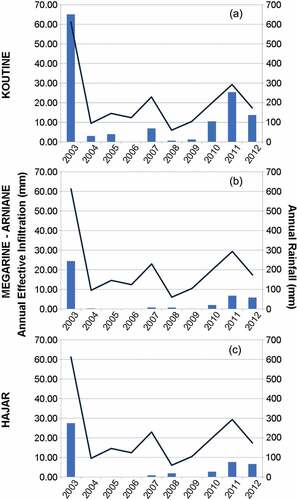
The annual R (mm) and the annual Ie (mm) were estimated over a 10-year period (2003–2012) for each sub-basin of the three watersheds. In particular, the average R and Ie for each year for each watershed were calculated as a weighted average of the values of each sub-basin considering the areas of each sub-basin as weights. The charts in show the trends of the average annual Ie for each watershed.
) shows the trend of the average annual Ie of the Koutine watershed, with values ranging from 65.10 mm in 2003, which was a particularly rainy year (610 mm), to 0.08 mm in 2006 (120 mm). The charts in ) and show the annual trend of average annual Ie for the Megarine-Arniane and the Hajar watersheds, respectively. The trends are very similar, with the highest value in 2003 (24.35 mm for the Megarine-Arniane watershed and 19.03 mm for the Hajar watershed). For the years 2004–2009, the average annual Ie was practically zero. The higher values for the Koutine watershed, compared to those of the other two watersheds, are due to the watershed having the highest number of sub-basins characterized by AWC < 50 mm, which are those that gave the highest contribution in terms of annual average Ie.
4.5 Average yearly natural recharge of the aquifers
The average annual natural recharge volumes (m3 year−1) for the aquifers are given in .
Table 7. Average annual natural groundwater recharge (m3 year−1) for each aquifer. AANR: average annual natural recharge (m3 year−1); Area: extent of the aquifer in the watershed (km2).
Although the areal extensions of the Triassic aquifer in the Koutine (170.2 km2) and the Megarine-Arniane (186.4 km2) watersheds are comparable (), the average annual groundwater recharge differs consistently (3.2 and 0.9 hm3 year−1, respectively). This is because the five sub-basins (K5, K8, K11, K13 and K14), characterized by AWC < 50 mm and the highest values of Ie in the Koutine watershed, contributed only to the groundwater recharge of this aquifer, whereas the Megarine-Arniane watershed presents only one small sub-basin (M4) with the same characteristics. The contribution to the annual recharge of the other aquifers is 1–2 orders of magnitude lower than that to the Triassic aquifer, and up to 4 orders of magnitude lower in the case of the Cretaceous aquifer in the Hajar watershed. Thus, the total estimate of the average annual groundwater recharge for the Triassic aquifer amounts to about 4.5 hm3 year−1. This value can be considered consistent with the unique reference values of about 4.7 hm3 year−1 (150 L s−1) and 4.9 hm3 year−1 (155 L s−1) for the same aquifer in the study area, as respectively reported by Ouessar (Citation2007) and Yahyaoui (Citation2007).
Figure 8. Spatial distribution of the Triassic, Jurassic and Cretaceous aquifers within the three watersheds.
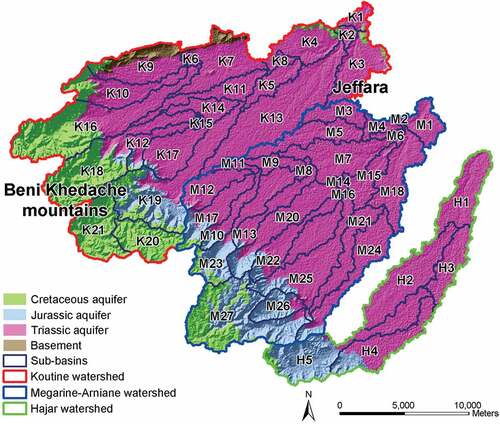
Figure 9. Comparison between rainfall and temperature data of the CFSR station 336103 and the Médenine station: (a), (b), (c) correlation between average daily rainfall, max temperature and min temperature, respectively; (d), (e) trends of average daily max temperature and min temperature, respectively.
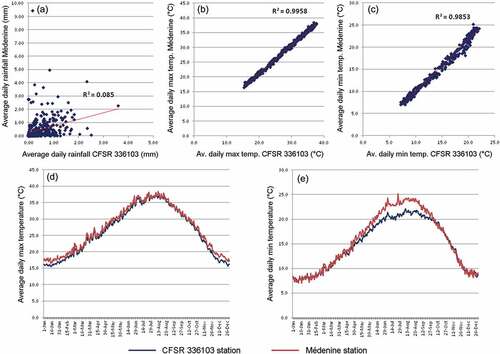
Figure 10. Distribution of (a) Ca, (b) Cv and (c) Cp versus Ck for the three watersheds.
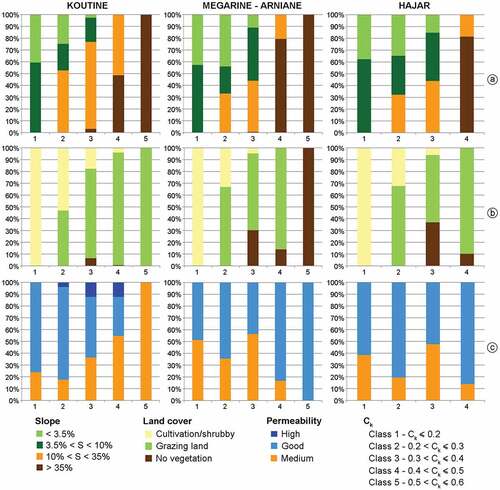
Figure 11. Estimation of average runoff and average effective infiltration, calculated on the basis of the rainfall events generating a water surplus (2003–2012), for each sub-basin of the Koutine watershed.
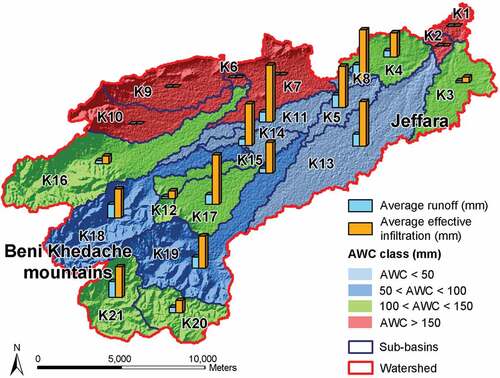
Figure 12. Estimation of average runoff and average effective infiltration, calculated on the basis of the rainfall events generating a water surplus (2003–2012), for each sub-basin of the Megarine-Arniane watershed.
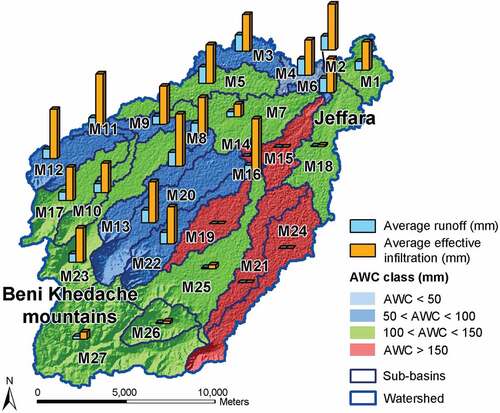
Figure 13. Estimation of average runoff and average effective infiltration, calculated on the basis of the rainfall events generating a water surplus (2003–2012), for each sub-basin of the Hajar watershed.
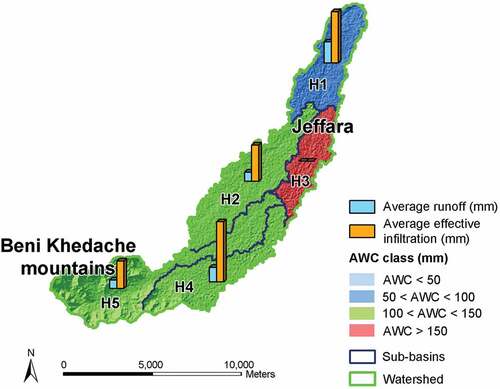
Figure 14. Trends of average annual effective infiltration (2003–2012) related to the (a) Koutine, (b) Megarine-Arniane and (c) Hajar (black line: annual rainfall).
5 Discussion
The runoff coefficient method was tested and validated in previous studies (Spadoni et al. Citation2010, Ghiglieri et al. Citation2014, Grillone et al. Citation2014) on semiarid regions in the Mediterranean area, which are typically characterized by a lack of sufficient historical climatic and streamflow datasets that can be used for the implementation, calibration, and validation of hydrological models. By multiplying the runoff coefficient Ck with the effective rainfall (P-ET) in the standard water balance equation on an annual basis, the annual runoff R and, therefore, the annual effective infiltration Ie (natural aquifer recharge) were calculated. This kind of approach is not suitable for ungauged watersheds in arid environments, such as those of the Oum Zessar study area in southern Tunisia, where the water balance is almost negative throughout the year. Indeed, in such climatic conditions, only after very intense rainfall events concentrated in a few days, does the rainfall exceed the evapotranspiration, generating runoff and effective infiltration. To overcome this critical condition, we developed an innovative approach, that combines the runoff coefficient method with a water balance model, which allowed us to calculate the effective infiltration Ie on a daily time scale basis as part of the water surplus in the soil. This calculation was carried out at the sub-basin scale for three watersheds (Koutine, Megarine-Arniane, and Hajar) by considering a mean AWC value and a mean value of the runoff coefficient Ck for each sub-basin. The result, which emerged very clearly, is that sub-basins characterized by average AWC values greater than 150 mm did not contribute to runoff and effective infiltration during the reference period. They are covered mainly by the “artificial” soils of tabias and jessour, the traditional water harvesting structures that are widespread in SE Tunisia. These soils are deep (1 or 2 m) and characterized by high AWC values (122 and 301 mm, respectively); thus, only very intense rainfall events can saturate them and generate a water surplus, especially after dry periods. Conversely, the sub-basins covered by shallow soils (depth between 0.20 and 0.40 m) and characterized by average AWC values less than 50 mm are those that produced the greatest contributions to the effective infiltration. This result emphasizes the delicate issue of the balance between the diffusion of the traditional water harvesting systems that have the primary function of promoting water storage in the soil for agricultural purposes and the need to ensure an adequate natural recharge for aquifers.
Starting from the calculated values of annual effective infiltration Ie and through the reconstruction of the spatial distribution of the Triassic, Jurassic, and Cretaceous aquifers within the three watersheds, the calculation of the average annual natural groundwater recharge for each aquifer was carried out. The results revealed that the Triassic aquifer is characterized by a much larger volume of average annual groundwater recharge than the other two aquifers. This difference does not only depend on its greater areal extension, but also on the fact that all the sub-basins with an average AWC < 50 mm contribute the highest value of average annual Ie to the recharge of this aquifer. This value is consistent with the volumes reported by Ouessar (Citation2007) and Yahyaoui (Citation2007), which represent the only available reference values for this aquifer in the study area. A comparison with the methodology proposed herein was not possible because these authors did not describe the methods they used for the natural recharge estimation in their works. Furthermore, the unavailability of a historical series of piezometric maps of the aquifers for the reference period (2003–2012) prevented us from evaluating the effects of the annual groundwater recharge on the aquifers to assess their overexploitation, as stated in WADIS-MAR (Citation2016).
A shortcoming of the application of the methodology in the Oum Zessar study area was the use of the climate data (daily precipitation and mean temperature data) of the Médenine weather station for the entire area, as they are the only available measured data on daily time steps. In addition, the unavailability of streamflow data measured at the watershed outflow point prevented us from making a comparison between the calculated runoff coefficient Ck values and those based on measured data in order to validate the method. To improve this study and overcome these constraints, it would be appropriate to increase the number of weather stations (at least 5–6) distributed over the entire area. For this purpose, on the basis of our results, it was possible to identify the most suitable locations for new weather stations that should integrate the existing network managed by local institutions, which at the moment, provide, at a maximum, 10-year series of climate data. Concerning the streamflow measured data, it should be necessary to realize at least three stream gauge stations, one for each basin. As a suggestion, the station in the Koutine wadi could be restored and other two could be realized at the edges of the Megarine–Arniane and Hajar watersheds: the former on the wadi on the bridge on the Koutine–Médenine road, and the second one on the bridge in the city of Médenine.
This study assumed that the methodology could be applied to a delimited area corresponding to the three watersheds, even if they cover only a part of the extension of an entire aquifer. In particular, as reported by Besbes et al. (Citation2005), the Triassic aquifer extends to the south-east, beyond the Libyan boundary. The choice was made to refer to a well-known physiographic unit, represented by the watershed, because it has not yet been possible to identify the groundwater divides of each aquifer in the study area. However, among the results achieved by WADIS-MAR, there is some geological, hydrogeochemical and, isotopic evidence which suggests that it is very likely that watersheds and hydrogeological basins do not coincide (Carletti Citation2017). Three-dimensional hydrogeological model reconstruction highlighted that the tectonic structures in the area significantly affect groundwater flows. A further confirmation comes from the results of the isotopic characterization of groundwater: both the Triassic and Jurassic aquifers are characterized by Tritium concentrations that indicate a mixing between recent and old waters. It could mean a mixing of recently infiltrated water with groundwater characterized by a greater residence time owing to the distance of the recharge areas.
6 Conclusions
The proposed methodology provides a reasonable, but conservative, natural aquifer recharge appraisal in ungauged watersheds, particularly in arid climatic conditions, where the lack of appropriate field datasets prevents the use of hydrological modelling. On the one hand this can be considered its greatest strength, but on the other hand, this methodology shows some weaknesses. The main one is being able to calculate the daily water balance with a resolution that is at most the sub-basin scale, considering average AWC and Ck values for each sub-basin. Indeed, while the Ck is calculated through GIS techniques with the same resolution as the DEM, the runoff and the effective infiltration on a daily time scale are calculated by the water balance model implemented in Excel, and average values per sub-basin are obtained. The implementation of the water balance model in a GIS environment would allow the effective infiltration to be calculated with greater resolution, and therefore, more detailed information on its spatial distribution within the watershed could be obtained. Despite these limits, the application of this methodology in the Oum Zessar study area showed that the land and water management, in particular the wide use of the traditional water harvesting techniques, has had some impacts on the natural aquifer recharge. As a future development of this research, this kind of assessment could be deepened through the implementation of models that are not only hydrological or agronomic but rather Decision Support Systems (e.g. SWAT model). Considering that they include different components (i.e. hydrology, weather, soil erosion, plant growth, land management, and groundwater), they represent a useful tool to simulate several processes at watershed scale on daily time steps. Their implementation needs robust datasets of climatic data and streamflow data, which are essential for the input, calibration, and validation of the models, and are not available at the moment in the study area. Furthermore, the natural aquifer recharge estimation in the study area can be improved considering the hydrogeological basins instead of the watersheds. To achieve this aim, a more detailed geological and hydrogeological study of the area is needed to delineate the hydrogeological basins. In addition, this in-depth analysis will allow us to better understand the groundwater circulation and assess the possible hydraulic connections between aquifers, which imply the presence of a lateral recharge that could significantly integrate the natural aquifer recharge with the effective infiltration.
However, the methodology presented provided natural aquifer recharge estimation which can be used in the future for several hydrogeological applications:
validating the conceptual model of groundwater flow and the groundwater recharge area delineation;
supporting the assessment of groundwater vulnerability to the pollution mainly due to human activities and the design of pollution mitigation and aquifer protection measures; and
implementing managed aquifer recharge (MAR), which is a process of induced groundwater replenishment (Bouwer Citation2002, Dillon et al. Citation2009, Fernández Escalante and San Sebastián Sauto Citation2012, Cosgrove and Rijsberman Citation2014). Indeed, the estimate of the natural groundwater recharge is very important, in combination with hydrogeological and hydrogeochemical evaluations, to the design of MAR systems and to defining their most suitable location. Furthermore, it allows researchers to evaluate the impact of the implemented MAR systems on the aquifer and thus to assess their efficiency.
Supplemental Material
Download MS Word (39 KB)Disclosure statement
No potential conflict of interest was reported by the authors.
Supplementary Material
Supplemental data for this article can be accessed here.
Additional information
Funding
Related Research Data
References
- Adham, A., et al., 2016. A water harvesting model for optimizing rainwater harvesting in the wadi Oum Zessar watershed, Tunisia. Agricultural Water Management, 176, 191–202. doi:10.1016/j.agwat.2016.06.003
- Afrasinei, G.M., et al., 2017. Classification methods for detecting and evaluating changes in desertification-related features in arid and semi-arid environments. In: M. Ouessar, et al., eds. Water and land security in drylands. Cham, Switzerland: Springer International Publishing, 269–289.
- Allen, R.G., et al., 1998. Crop evapotranspiration– guidelines for computing crop water requirements. Rome: Food and Agriculture Organization, FAO Irrigation and drainage paper 56.
- Arnold, J.G., et al., 1998. Large area hydrologic modeling and assessment part I: model development. Journal of the American Water Resources Association, 34, 73–89. doi:10.1111/jawr.1998.34.issue-1
- Arras, C., et al., 2015. Electrical resistivity tomography for the identification of the alluvium-triassic boundary in Medenine region (SE Tunisia). Rendiconti Online Societa Geologica Italiana, 35, 10–12.
- Barazzuoli, P., et al., 1986. Valutazione delle risorse idriche nella Toscana meridionale (Applicazione del metodo Kennessey al bacino del Torrente Farma (Province di Siena e Grosseto) e sua verifica con i calcoli di bilancio) [Evaluation of water resources in southern Tuscany (Application of the Kennessey method in the basin of Farma (provinces of Siena and Grosseto) and its verification through the calculations of the water budget]. Bollettino- Societa Geologica Italiana, 105, 333–350.
- Barroccu, G. and Soddu, S., 2006. Saltwater intrusion in the Arborea area (central-western Sardinia). In: 1st SWIM-SWICA Joint Saltwater Intrusion Conference, 24–29 September 2006, Cagliari-Chia Laguna, Italy.
- Bellot, J., et al., 2001. Likely effects of land use changes on the runoff and aquifer recharge in a semiarid landscape using a hydrological model. Landscape and Urban Planning, 55, 41–53. doi:10.1016/S0169-2046(01)00118-9
- Benton, M., et al., 2000. Dinosaurs and other fossil vertebrates from fluvial deposits in the Lower Creta- ceous of southern Tunisia. Palaeogeography, Palaeoclimatology, Palaeoecology, 157, 227–246. doi:10.1016/S0031-0182(99)00167-4
- Besbes, M., et al., 2005. Étude sur modèles mathématiques de la Djeffara Tuniso-Libyenne. Tunis: Observatoire du Sahara et du Sahel.
- Boi, P., Fiori, M., and Canu, S., 2011. High spatial resolution interpolation of monthly temperatures of Sardinia. Meteorological Applications, 18, 475–482. doi:10.1002/met.243
- Bouwer, H., 2002. Artificial recharge of groundwater: hydrogeology and engineering. Hydrogeology Journal, 10, 121–142. doi:10.1007/s10040-001-0182-4
- Canu, S., et al., 2014. Bioclimate map of Sardinia (Italy). Journal of Maps, 11 (5), 711–718. doi:10.1080/17445647.2014.988187
- Carletti, A., 2017. Trial of protocols and techniques for integrated groundwater management in arid and semi-arid regions to combat drought and desertification. Thesis (PhD). Cagliari University.
- Chihi, H., et al., 2015. Relationship between tectonic structures and hydrogeochemical compartmentalization in aquifers: example of the “Jeffara de Medenine“ system, south-east Tunisia. Journal of Hydrology: Regional Studies, 4, 410–430.
- Cosgrove, W.J. and Rijsberman, F.R., 2014. World water vision: making water everybody’s business. London: Routledge, EarthScan Publications Ltd.
- De Vries, J.J. and Simmers, I., 2002. Groundwater recharge: an overview of processes and challenges. Hydrogeology Journal, 10 (1), 5–17. doi:10.1007/s10040-001-0171-7
- Dile, Y.T. and Srinivasan, R., 2014. Evaluation of CFSR climate data for hydrologic prediction in data-scarce watersheds: an application in the Blue Nile river basin. Journal of the American Water Resources Association, 1–16. doi:10.1111/jawr.12182
- Dillon, P., et al., 2009. Managed aquifer recharge: an introduction. National Water Commission, Australian Government, Waterlines Report Series No. 13, February 2009.
- Downer, C.W. and Ogden, F.L., 2004. GSSHA: model to simulate diverse stream flow producing processes. Journal of Hydrologic Engineering, 9, 161–174. doi:10.1061/(ASCE)1084-0699(2004)9:3(161)
- Famiglietti, J.S., 2014. The global groundwater crisis. Nature Climate Change, 4, 945–948. doi:10.1038/nclimate2425
- Fernández Escalante, E. and San Sebastián Sauto, J., 2012. Rechargeable sustainability: the key is the storage. Madrid: Tragsa Ed. ISBN 10: 84-615-8704-9/13: 978-84-615-8704-9.
- Fleskens, L., et al., 2005. Evaluation of the onsite impact of water harvesting in Southern Tunisia. Journal of Arid Environments, 62, 613–630. doi:10.1016/j.jaridenv.2005.01.013
- García-Ruiz, J.M., et al., 2011. Mediterranean water resources in a global change scenario. Earth-Science Reviews, 105, 121–139. doi:10.1016/j.earscirev.2011.01.006
- Gassman, P.W., et al., 2007. The soil and water assessment tool: historical development, applications, and future directions. Transactions of the American Society of Agricultural and Biochemical Engineering, 50 (4), 1211–1250.
- Ghiglieri, G., Barbieri, G., and Vernier, A., 2006. Studio sulla gestione sostenibile delle risorse idriche: dall’analisi conoscitiva alle strategie di salvaguardia e tutela [Sustainable water resources management: knowledge and protection criteria]. Italy: ENEA. ISBN 88-8286-147-3.
- Ghiglieri, G. and Carletti, A., 2010. Integrated approach to choosing suitable areas for the realization of productive wells in rural areas of sub-Saharan Africa. Hydrological Sciences Journal, 55 (8), 1357–1370. doi:10.1080/02626667.2010.527845
- Ghiglieri, G., Carletti, A., and Pittalis, D., 2014. Runoff coefficient and average yearly natural aquifer recharge assessment by physiography-based indirect methods for the island of Sardinia (Italy) and its NW area (Nurra). Journal of Hydrology, 519, 1779–1791. doi:10.1016/j.jhydrol.2014.09.054
- Giannecchini, R. and Doveri, M., 2016. Caratterizzazione idrogeologica. Master di II Livello in Bonifiche dei Siti Inquinati. Università di Pisa.
- Gleeson, T., et al., 2012. Towards sustainable groundwater use: setting long-term goals, backcasting, and managing adaptively. Ground Water, 50 (1), 19–26. doi:10.1111/j.1745-6584.2011.00825.x
- Grillone, G., Baiamonte, G., and D’Asaro, F., 2014. Empirical determination of the average annual runoff coefficient in the mediterranean area. American Journal of Applied Sciences, 11 (1), 89–95. doi:10.3844/ajassp.2014.89.95
- Hargreaves, G.H. and Samani, Z.A., 1985. Reference crop evapotranspiration from temperature. Transaction of ASAE, 1 (2), 96–99.
- Jarray, H., et al., 2017. Groundwater vulnerability based on GIS approach: case study of Zeuss-Koutine aquifer, South-Eastern Tunisia. Geofísica Internacional, 56 (1), 7–12. doi:10.19155/geofint.2017.056.2.1
- Kamel, S., Chelbi, M.B., and Jedoui, Y., 2013. Investigation of sulphate origins in the Jeffara aquifer, southeastern Tunisia: a geochemical approach. Journal of Earth System Science, 122 (1), 15–28. doi:10.1007/s12040-012-0252-0
- Kennessey, B., 1930. Lefolyasi tényezok és retenciok Vizugy, Koziemények. Hungary.
- Klok, E.J., et al., 2001. Distributed hydrological modelling of a glaciated Alpine river basin. Hydrological Sciences Journal, 46, 553–570. doi:10.1080/02626660109492850
- Lerner, D.N., Issar, A.S., and Simmers, I., 1990. Groundwater recharge a guide to understanding and estimating natural recharge. International Contributions to Hydrogeology, vol. 8. International Association of Hydrogeologists. Hannover: Verlag Heinz Heise.
- Liu, Z. and Todini, E., 2002. Towards a comprehensive physically-based rainfall-runoff model. Hydrology and Earth System Sciences, 6, 859–881. doi:10.5194/hess-6-859-2002
- Ministère de l’Agriculture, Environnement et Ressources Hydrauliques, 2003. Carte Agricole Régionale du Gouvernorat de Médenine (1:200 000). Tunis.
- Neitsch, S.L., et al., 2005. Soil and water assessment tool theoretical documentation (version 2005). Temple, TX: Grassland, Soil and Water Research Laboratory, Agricultural Research Service, and Blackland Research Center, Texas Agricultural Experiment Station.
- Office National des Mines, 1996. Notice explicative de la Carte Géologique de la Tunisie à 1:100 000. Tunis.
- Ouessar, M., 2007. Hydrological impacts of rainwater harvesting in wadi Oum Zessar watershed (Southern Tunisia). Thesis (PhD). Ghent University. ISBN 978-90-5989-192-0.
- Ouessar, M., et al., 2009. Modelling water-harvesting systems in the arid south of Tunisia using SWAT. Hydrology and Earth System Sciences, 13, 2003–2021. doi:10.5194/hess-13-2003-2009
- Ouessar, M., Sghaier, M., and Fetoui, M., 2008. Traditional and contemporary water harvesting techniques in the arid regions of Tunisia. In: Z. Adeel, B. Schuster, and H. Bigas, eds. What makes traditional technologies tick? A review of traditional approaches for water management in drylands. Hamilton Ontario: UNU Desertification Series No. 8, 44–56.
- Ouessar, M. and Yahyaoui, H., 2006. Les ressources en eau. In: D. Genin, et al., eds. Entre la désertification et le développement: la Jeffara tunisienne. Tunis: CERES, 47–56.
- Ould Baba Sy, M., 2005. Recharge et paleorecharge du système aquifère du Sahara Septentrional. Thesis (PhD). University of Tunis El Manar.
- Owen, R., et al., 2010. Groundwater management in IWRM. Training manual. Pretoria, South Africa: Cap-Net UNDP.
- Puri, S., Aureli, A., and Stephan, R.M., 2008. Shared groundwater resources: global significance for social and environmental sustainability. In: C.J.G. Darnault, ed. Overexploitation and contamination of shared groundwater resources. Management, (bio)technological, and political approaches to avoid conflicts. Chicago, IL: NATO Science for Peace and Security Series – C: Environmental Security, 3–24.
- Samper, J., et al., 2007. Evaluation of climate change impacts on water resources of Ebre River Basin with GIS-BALAN. In: XXXV AIH Congress, Lisboa. Groundwater and Ecosystems, 11.
- Santoro, M., 1970. Sulla applicabilità della formula di Turc per il calcolo dell’evapotraspirazione effettiva in Sicilia. I Convegno Internazionale Acque Sotterranee IAH, Palermo, Italy.
- Scanlon, B., Healy, R., and Cook, P., 2002. Choosing appropriate techniques for quantifying ground-water recharge. Hydrogeology Journal, 10 (1), 18–39. doi:10.1007/s10040-001-0176-2
- Schiettecatte, W., et al., 2005. Impact of water harvesting techniques on soil and water conservation: a case study on a micro catchment in southeastern Tunisia. Journal of Arid Environments, 61, 297–313. doi:10.1016/j.jaridenv.2004.09.022
- Sghaier, M., et al., 2011. Context of Oum Zessar watershed, Tunisia. Report of AFROMAISON Project. Chapter 2, 1–60.
- Shen, Y. and Chen, Y., 2010. Global perspective on hydrology, water balance, and water resources management in arid basins. Hydrological Processes, 24, 129–135. doi:10.1002/hyp.7428
- Smerdon, B.D. and Drewes, J.E., 2017. Groundwater recharge: the intersection between humanity and hydrogeology. Journal of Hydrology, 555, 909–911. doi:10.1016/j.jhydrol.2017.10.075
- Spadoni, M., et al., 2010. Using GIS for modelling the impact of current climate trend on the recharge area of the S. Susanna spring (Central Apennines, Italy). Hydrological Processes, 24, 50–64. doi:10.1002/hyp.7452
- Swezey, C.S., 1999. The lifespan of the Complexe Terminal Aquifer, Algerian-Tunisian Sahara (La durée de vie de I’aquifère du Complexe terminal, Sahara algéro-tunisien). Technical note. Journal of African Earth Sciences, 28 (3), 751–756. doi:10.1016/S0899-5362(99)00043-3
- Taamallah, H., 2003. Carte pédologique de la Jeffara. Rapport interne, projet Jeffara. Tunis: IRA/IRD.
- Tardi, A. and Vittorini, S., 1977. Il calcolo del coefficiente di deflusso su basi fisiografiche [The calculation of the runoff coefficient using physiographic characteristics]. Ordine Degli Ingegneri Della Provincia Di Firenze, 4, 5–14.
- Tilahun, K. and Merkel, B.J., 2009. Estimation of groundwater recharge using a GISbased distributed water balance model in Dire Dawa, Ethiopia. Hydrogeology Journal, 17, 1443–1457. doi:10.1007/s10040-009-0455-x
- Touhami, I., et al., 2013. Recharge estimation of a small karstic aquifer in a semiarid Mediterranean region (southeastern Spain) using a hydrological model. Hydrological Processes, 27, 165–174. doi:10.1002/hyp.9200
- Turc, L., 1954. The water balance of soils. Relation between precipitation, evaporation and flow. Annales Agronomiques, 5, 491–569.
- Viviroli, D., et al., 2009. An introduction to the hydrological modelling system PREVAH and its pre-and post-processing-tools. Environmental Modelling & Software, 24, 1209–1222. doi:10.1016/j.envsoft.2009.04.001
- WADIS-MAR, 2016. WADIS-MAR water harvesting and agricultural techniques in dry lands: an integrated and sustainable model in Maghreb Regions. Médenine, Tunisia: Project Documents.
- Wagner, S., et al., 2009. Water balance estimation of a poorly gauged catchment in West Africa using dynamically downscaled meteorological fields and remote sensing information. Physics and Chemistry of the Earth, 34, 225–235. doi:10.1016/j.pce.2008.04.002
- Xu, Z.X., et al., 2009. Assessment of runoff and sediment yield in the Miyun Reservoir catchment by using SWAT model. Hydrological Processes, 23, 3619–3630. doi:10.1002/hyp.7475
- Yahyaoui, H., 2007. Nappe des Grès du Trias de Sahel El Ababsa de Médenine. Aspects hydrogéologiques et proposition d’une gestion durable. Tunis: DGRE.