?Mathematical formulae have been encoded as MathML and are displayed in this HTML version using MathJax in order to improve their display. Uncheck the box to turn MathJax off. This feature requires Javascript. Click on a formula to zoom.
ABSTRACT
To face the difficulties involved in supplying freshwater to Abidjan (Côte d’Ivoire), the Aghien Lagoon connected by a channel to the Potou-Ébrié lagoon is a potential resource for production of drinking water. A hydro-meteorological network was installed with the objective of assessing the sustainability of the lagoon in terms of both quantity and quality, and 10 sampling campaigns were conducted between June 2015 and December 2016 to evaluate the water quality. Even if the annual flow of the two peri-urban tributaries is just equivalent to the volume of the lagoon, the large daily inflow by the channel can secure the future quantitative demand. Unfortunately, the main tributaries in the peri-urban zones have lacked sanitation services and present numerous markers of pollution. Even if the water quality status of the lagoon remains quite good with respect to total nitrogen and total phosphorus, it nevertheless presents a high potential risk of eutrophication.
Editor A. Castellarin Associate editor M. Hutchins
Introduction
In the 21st century, Africa will lead the global population growth. By 2050, the population of Africa will have doubled compared to its current 1.2 billion inhabitants (UN-DESA Citation2015). This growth will be absorbed by the expansion of existing mega-cities – particularly in the high-density corridor along the Gulf of Guinea, from Abidjan (Côte d’Ivoire) to Douala (Cameroon) – and by the development of secondary inland agglomerations. The expected growth rates of African cities in the next 15 years thus range from 3% to more than 5% annually. By 2020, the urban population will exceed the rural population in West Africa and reach 66% of the total population by 2050.
At the same time, the demand for freshwater supply, is expected to more than triple in Africa over the period 2005–2030 (Citation2030Water resource group 2009), generally increasing faster than the population for several reasons, such as the emergence of a middle class whose water needs are increasing and reaching the Sustainable Development Goals. Ensuring reliable access to safe drinking water and functional sanitation facilities is, probably, one of the most important issues of the century to ensure the sustainable growth of cities in developing countries.
Historically, groundwater resources have been used to supply drinking water to cities, as aquifers are often less sensitive to anthropogenic pollution. However, the rapid growth of cities has gradually made it necessary to resort to much more vulnerable surface waters to supplement, and even replace, underground resources, which are often overexploited and are now polluted. In many cases, urban water resources now combine underground water under or in the immediate vicinity of the city and surface waters, e.g. Ouagadougou reservoirs (Burkina Faso), Guiers Lake for Dakar (Sénégal), the Niger River for Bamako (Mali) and Niamey (Niger). The availability of surface water resources is directly linked to short-term climate variations (one to several years of drought) and to long-term climate change.
Urban growth is “inextricably linked” with slum expansion and poverty. In sub-Saharan Africa, 62% of urban dwellers live in slums, lacking basic necessities such as safe drinking water and sanitation facilities. Less than 22% of African cities have their wastewater treated (UN-Habitat Citation2002). As Nyenje et al. (Citation2010, Citation2014)) pointed out, industrial and domestic effluents are directly discharged in the environment and generate the eutrophication processes observed in African surface waters. Another consequence is the development of cyanobacteria blooms in many African water bodies (Ndlela et al. Citation2016).
With more than five million inhabitants (projected value based on the last national census of the population (Institut National de la Statistique de Côte d’Ivoire Citation2014), Abidjan district faces tremendous difficulties in water supply linked to the combined effects of population growth and the limits of the groundwater resources. The Continental Terminal aquifer located below Abidjan (Jourda Citation1987) provides most of the drinking water to the population. More than half of the slums in the communes of Abidjan have limited access to public services and infrastructure (Lall et al. Citation2017). Tangible signs of chemical and biological groundwater pollution also appear (Ahoussi et al. Citation2013). Faced with future threats to the groundwater in terms of both quality and quantity, the search for additional sources of water to supply Abidjan is thus an important issue. The Aghien Lagoon, the largest freshwater reserve near Abidjan, has been identified by the State of Côte d’Ivoire as a potential resource for the production of drinking water. Unfortunately, the main lagoon tributaries rise in the peripheral urbanized zones of the city that lack sanitation services. Despite the urbanization of Abidjan and the challenge of providing sufficient quantities of good quality water, the Aghien Lagoon catchment remains ungauged and its water quality is poorly known, particularly in its tributaries.
This study explores two questions related to the sustainability of the Aghien Lagoon: (a) Are the water inflows in the lagoon sufficient to supplement the demand for the future drinking water needs of Abidjan? and (b) How do urbanization and the deficiency of sanitation services affect nutriment fluxes to the lagoon? To help answer these questions, this paper addresses three main points: (i) quantification of the water flowing into and out of the Aghien Lagoon, (ii) characterization of the water quality in terms of nutrients in the lagoon and its tributaries, and (iii) evaluation of nutrient transfer to the lagoon. First, these results will help better manage the water resources of Abidjan and, secondly, they will also help reduce the scarcity of data for tropical urbanized and unsewered basins.
Material and methods
Study site
The Aghien Lagoon located in northeast Abidjan (Côte d’Ivoire), covers a surface area of 19.45 km2 (). Geographical and climatological information on this region is reported in . The sediments at the bottom of the lagoon are mainly mud, whereas the borders of the lagoon are mainly sands (Tastet and Guiral Citation1994, N’Guessan et al. Citation2011). A 5-km natural channel links the Aghien Lagoon to the Potou Lagoon. The Aghien-Potou lagoon system is connected to the brackish Ébrié lagoon system by a narrow channel located in the south of the Potou Lagoon. An artificial channel connects the Abidjan harbour in the Ébrié lagoon to the Atlantic Ocean (). The effect of the tide is felt up to the western end of the Aghien Lagoon. The climate is tropical monsoon characterized by bi-modal rainy seasons (May–July and October–November), separated by two dry periods (July–September and December–April). The relief of the Aghien Lagoon catchment consists of plateaus with deep valleys leading to the lagoon. Two rivers (Djibi and Bété) flow directly into the west end of the lagoon. A third river (Mé) flows into the Aghien-Potou channel and its water could flow up the channel and contribute to fill the Aghien Lagoon. All the rivers have permanent flows.
Table 1. Main features of the Aghien Lagoon and its catchment.
Figure 1. Study area, instrumentation and piezometric contour (ONEP, pers. comm.) of the Aghien hydrosystem.
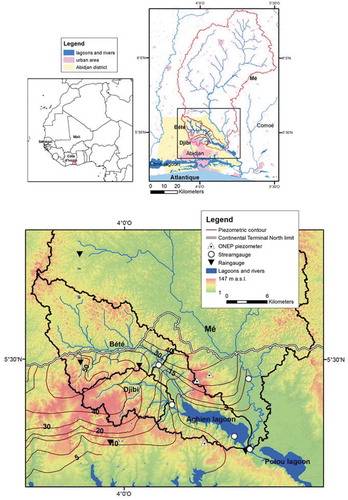
For the Djibi catchment and half of the Bété catchment (), the sedimentary substratum consists of the Continental Terminal aquifer, mainly composed of lenticular stratifications of fine to coarse sands and clays. A crystalline basement occupies the northern part of the Bété catchment and the whole Mé catchment (Jourda Citation1987). As shown by the piezometric contour (), the groundwater drains into the Aghien Lagoon (Adiaffi Citation2008). This is confirmed by the traditional shallow wells located on the sides of the lagoon where the marked acidity of the water is characteristic of the Continental Terminal groundwater (Jourda Citation1987).
The Mé catchment is mainly rural, whereas the Bété and the Djibi catchments are partially urbanized. Part of the northern suburbs of Abidjan (Abobo; 700 000 inhab.) extends over the Upper Djibi catchment. Agriculture remains the main activity in the lagoon area and its watershed.
Observation networks, protocols and methods
Hydro-climatic network
Taking into account the lack of hydro-climatic data in this catchment, three gauging stations were installed at Djibi Bridge (2 km upstream from the lagoon), Bété Bridge (6.5 km upstream from the lagoon) and Mé Bridge (20 km upstream from the confluence with the Aghien-Potou channel). Water levels were monitored at a 15-min time step and a 1-cm resolution. In 2015, rating curves were established at each station by regular gauging surveys (see in the Appendix for the rating curves). Water discharge was gauged by velocity field exploration in the river section, using an electromagnetic current meter or an acoustic Doppler current profiler (ADCP). The uncertainties of the measurement are around 5% (Oberg and Mueller Citation2007).
A gauging station was also set up to quantify the water fluxes in the Aghien-Potou channel downstream from the Aghien Lagoon. This channel streamgauge station (rating curve not currently available) presents inversion of the flow direction due to the tidal influence (twice a day). To complete this set-up, a water-level measurement station was set up in the Aghien Lagoon. Water levels are monitored at a 15-min time step and a 1-mm resolution. The study period started in February-March 2015 for the river stations and in June 2015 for the lagoon/channel stations (). At the same time, six tipping-bucket (0.5-mm resolution) raingauges were installed in the catchment and its surrounding zones.
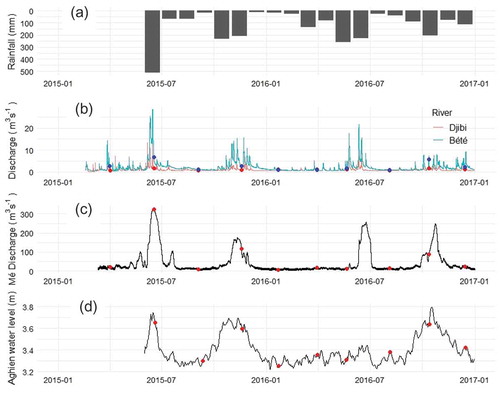
Figure 2. Rainfall, discharge time series for the Djibi, Bété and Mé rivers and daily Aghien Lagoon water levels. The dates of the water quality surveys are shown by the red and blue dots on the curves.
Due to the dysfunction of the weather station, we used monthly mean 1968–1979 Penman evapotranspiration from a site located some 30 km west of the lagoon (Monteny and Lhomme Citation1980).
A few groundwater level data, around the lagoon, were obtained from the National Drinking Water Agency (Office National de l’Eau Potable, ONEP), which manages the piezometric network of the Abidjan Continental Terminal aquifer ().
Aghien-Potou channel flow
The Aghien-Potou channel inflow (or outflow) was estimated at a 15-min time step using the lagoon water budget equation:
where ∆Lagoon is the change in storage in the Aghien Lagoon (positive when the storage increases), Rain is rainfall, Flow is inputs of water from the Djibi and Bété rivers, Gw is the groundwater discharge in the lagoon, Evap is surface water evaporation and Ch is the channel streamflow (positive when the streamflow leaves the lagoon through the channel, i.e. outflow).
We considered variation in storage, rainfall and evaporation as the product of the lagoon area by the respective variables for each time step. In the preliminary approach, the groundwater discharge Gw was evaluated using Darcy’s law applied to a few ONEP observation wells located near the lagoon.
Sampling network and sampling protocols
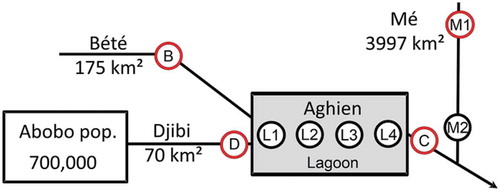
A sampling network consisting of nine sites () was set up: four located at the four gauging stations (Bété Bridge: B; Djibi Bridge: D; Mé Bridge: M1 and Aghien/Potou channel: C); four located along the central axis of the Aghien Lagoon, from its west end to east end (L1–L4), where L1 is near the mouths of the Bété and Djibi rivers at the west end of the lagoon; and the last site located on the Mé River just upstream from its confluence with the Aghien/Potou channel (M2).
Figure 3. Diagrammatic representation of the nine sampling sites on the Aghien hydrosystem (red circles for gauging stations).
Ten campaigns, spaced about 2 months apart, were carried out from April 2015 to December 2016. The chosen frequency was a compromise between the available budget and the desire to detect eventual variations. The same protocol was used for each campaign. Water samples were removed manually 0.40 m below the surface, between 09:00 and 14:00 h. They were kept in a cool box and taken to the laboratory in less than four hours. The samples were immediately partially filtered and stored until analysis, which was done the day after. Physical and chemical parameters (water conductivity, dissolved oxygen, pH and temperature) were measured in situ with the appropriate probes connected to a HACH HQ40d portable multi meter (HACH®, USA).
Analysis protocols
Concentrations of total phosphorus (TP), soluble reactive phosphorus (SRP), total nitrogen (TN), ammonium (NH4), nitrates (NO3) and nitrites (NO2) in the water samples were analysed. Analyses were performed using a HACH DR6000 UV VIS (HACH®, USA) and LCK cuvette test system. Data and cuvette test references are presented in . The TP and TN were analysed after digestion using a high temperature HACH HT 2500 thermostat. Nitrogen forms and SRP were analysed after 0.45-µm filtration. Organic nitrogen (Norg) was calculated as the difference between TN and NH4, NO3 and NO2 and particulate phosphorus (Ppart) as the difference between TP and SRP.
Table 2. Annual rainfall and streamflow in the three catchments (in brackets: streamflow-rainfall ratio).
The unpaired two-sample Wilcoxon test was used to compare median values from one location to another. This is a non-parametric test which can be used to compare data that are not normally distributed. We used it with a significance level of 0.05 (null hypothesis taken as equal medians).
Nutrient fluxes
For each campaign, instantaneous fluxes were calculated as the product of TN (or TP) concentration by the instantaneous discharge. For the whole period (June 2015–December 2016), TN and TP total fluxes were also calculated. Because our sampling frequency was low, we calculated these TN and TP fluxes with several commonly used methods (Moatar and Meybeck Citation2005, Salles et al. Citation2008, Stenback et al. Citation2011, Raymond et al. Citation2013). Where C is the concentration of the element concerned, Q is the discharge measured at the gauging station and V is the runoff volume, the following methods were applied:
Method 1 calculates the sum of the products of the instantaneous flux by the representative time period of the sample:
Method 2 considers the average concentration of all the samples. The estimated load is therefore the runoff volume multiplied by the average concentration:
Method 3 uses the average flow weighted concentration instead of the average concentration:
Method 4 assumes a constant concentration during the representative period of the sample, but considers changes in discharge at the finest timescale during this period. The flood load is estimated as the sum of the N products of average flow during the sample representative period by instant concentration:
Results
Hydrology
Rainfall and streamflow of the three rivers
Mean rainfall on the lagoon has been reliable only since June 2015. Compared to the long-term annual rainfall time series of IRHO-Mé (1960–2012, provided by the Centre National de la Recherche Agronomique, ), the empirical exceedence probability of the annual rainfall in 2016 on the Djibi or Bété catchments () ranged from 53% to 65%, thereby defining 2016 as rather dry.
Water level measurements began on 20 February (Djibi, Bété) and 11 March 2015 (Mé). The streamflow time series shows the characteristic pattern of the annual rainfall distribution in two rainy seasons (). The discharge of the Mé River was 10 times greater than that of the Bété and Djibi rivers. The annual flow of the Bété and Djibi rivers amounted to 88 × 106 m3, which is equivalent to the volume of the Aghien Lagoon. The runoff coefficient (streamflow–rainfall ratio) for 2016 for the Djibi catchment was higher than that of the Bété catchment. Even though the 2015 discharge data series is incomplete, the streamflow was equal to or greater than that in 2016 at the three streamgauge stations. The year 2015 was probably wetter than 2016. The annual rainfall observed at Abidjan Airport (Direction de la Météorologie, personal communication) confirmed this hypothesis: 2015 was wetter than 2016 (2172 vs 1388 mm).
Seasonal variations in the level of the Aghien Lagoon ()) were around 0.4 m and the mean daily tidal range (not shown) was 0.24 m. The 14-day lunar cycle is clearly visible. The occurrence of high water levels in the lagoon is complex and does not necessarily depend on high flows in the Mé River, as attested by low water levels in the lagoon in June 2016, despite the occurrence of a flood in the Mé River.
Groundwater discharge to lagoon
We postulate that mud clogs up the central part of the lagoon bottom, whereas at the sides, the sands allow groundwater to discharge into the lagoon. The elevation above sea level of the traditional wells on the sides of the lagoon is not known, but as they are just a little above the surface level of the lagoon, we considered a piezometric level of 1.25 m a.s.l. (the mean lagoon water level is 1 m a.s.l.). We calculated the hydraulic gradient between the piezometric level of these wells and the mean interannual piezometric levels, which are known for a few observation wells (ONEP piezometers in ). The hydraulic gradient is steeper on the north side of the lagoon (5 × 10⁻³ m m−1) than on the south side (2 × 10⁻³ m m−1). Even if a diversity of texture is described in the Continental Terminal formation (Osemwegie et al. Citation2018), a very small number of long-term pumping tests with constant flow rates are available (Jourda Citation1987). For these pumping tests, the hydraulic conductivity of the aquifer was around 10−4 m s−1. According to Darcy’s law and a strong hypothesis on the hydraulic processes in the lagoon bottom, groundwater discharge was estimated at 2.1 m3 s−1, i.e. 66 × 106 m3 per year.
Discharges into the Aghien-Potou channel
A total of 355 discharge measurements were made with an ADCP from May to November 2016 in the Aghien-Potou section of the channel. The hydraulic system is particularly complex. The surface profile of the water is controlled by upstream and downstream water levels. Downstream, the system depends on tidal oscillations and discharge from the Mé River but also on the water level in the Comoé River, which flows into the eastern part of the Ébrié Lagoon. It was difficult to establish a classical water–discharge relationship based on two factors: the water level at the section and the water profile slope.
Nevertheless, discharge measurements were compared with calculated discharges from the lagoon water depth variation at a 15-min time step. In a first approximation, this calculation did not take into account the uncertain groundwater discharge to lagoon. Despite this approximation, there was a complete correlation between measured and calculated discharges ()). ) gives an example of channel flows over the course of one day (26 May 2016).
Figure 4. (a) ADCP discharge measurements in the Aghien-Potou channel versus discharge calculated from the water balance equation considering no groundwater exfiltration. (b) Example of observed and calculated discharge on 26 May 2016. Due to the tide oscillation, the flow direction changes twice a day: channel discharge is positive when the flow is out of the lagoon.
Daily inflow (or outflow) volumes are in the order of 8 × 10⁶ m3, which represents 10% of the total volume of the lagoon.
Physical-chemical parameters
Box-and-whisker plots summarizing the physical-chemical parameters values as well as TN, N-NH4, N-NO3, N-NO2, TP and SRP concentrations at the nine sampling sites in the Aghien hydrosystem are presented in .
Figure 5. Box-and-whisker plots summarizing the physical-chemical parameters, total nitrogen (TN), ammonium (N-NH4), nitrite (N-NO3), nitrate (N-NO2), total phosphorus (TP) and SRP concentrations at the nine sampling sites in the Aghien hydrosystem. Boxes indicate the interquartile range (IQR) around the median; whiskers indicate the maximum and minimum values, excluding outliers (dot: values more than 1.5 × IQR).
Spatial variations
Analysis of the physical-chemical parameters in each site showed the singularity of the Djibi River (D). The site was characterized by the highest median values for electrical conductivity (EC, 217 µS cm−1), total nitrogen (TN, 7.1 mg N L−1), nitrite (0.038 mg N-NO2 L−1), ammonium (3.35 mg N-NH4 L−1), total phosphorus (TP, 0.467 mg P L−1) and soluble reactive phosphorus (SRP, 0.096 mg P-PO4 L−1). It presented also the lowest dissolved oxygen saturation rate (DO, 10%). Importance of TN (composed by 50% of N-NH4) and TP as well as the low level of DO exhibited the anthropogenic origin of the water.
The lagoon sites (Lx) showed no significant differences between the medians (Wilcoxon test, p-value > 0.05) from one site to the other. Lagoon sites were characterized by the highest pH (8–8.7), DO saturation rate (>100) and Norg (80 to 86% of NT). This was due to the significant algal and bacterial activity in the water. The high values of DO were directly linked to the intensity of photosynthesis, which reduced CO2 in the water and increased pH as well as concentrations of dissolved oxygen (Varlet Citation1978, Hunter et al. Citation1998, Kim et al. Citation2002). It is worth noting that few pH measurements made simultaneously at a depth of 4 m in the lagoon ranged from 6.5 to 7.5.
Bété and Mé sites (B, Mx) showed the same median values (Wilcoxon test, p-value > 0.05) for pH, TN, NO2, TP and SRP. The Mé site (M1) exhibited the lowest EC (64 µS cm−1) among all sites while the Bété River had the highest median nitrate concentration (1.4 mg N-NO3 L−1).This high concentration was probably due to extensive areas of market gardening upstream from the sampling site. Nevertheless, this value remained relatively low. The weak EC of the Mé River could be due to the rural land cover.
According to its location, channel site (C) presented median values closed to Mé sites as pH, DO) or close to those observed at the eastern lagoon extremity (L4) (as EC and nutrients concentrations).
In the different rivers and in the lagoon, particulate forms of phosphorus (Ppart) represented the main contribution to the total concentration of phosphorus.
Seasonal variations
Few seasonal variations were observed. Even though Aghien lagoon is influenced by the tide, with clear oscillations of its level ()), the Aghien lagoon contained freshwater throughout the year, which was not the case of Potou lagoon located downstream (Tastet and Guiral Citation1994). Maximum values of EC (and also outliers) in the lagoon and channel were measured during the March 2016 campaign. Due to the combined drop in discharges and low lagoon levels, more mineralized water from the Potou lagoon flowed into the Aghien lagoon through the channel. A decreasing conductivity gradient was observed from the channel site (C, 340 µS cm−1) to the west end of the lagoon (L1, 200 µS cm−1). High EC were also measured in the lagoon in the May 2016 campaign. In 2012 and 2013, Yeo et al. (Citation2015) also observed an increase of EC for this period of the year. For the whole sites (except for the Djibi), the TP concentrations measured during the November 2015 campaign were dramatically higher (from 0.6 to 0.9 mg P L−1) than for the others campaigns. These high values could be attributed to river inputs for this particularly wet year. As in Aghien Lagoon, Varlet (Citation1978) observed also an increase in the SRP concentration in the Ebrié lagoon during the short rainy season (October-November) and attributed it to river inputs (Comoé River).
Nutrients exported from the rivers
Instantaneous TN and TP fluxes were calculated for the Bété and Djibi Rivers to evaluate the nutrient fluxes into Aghien Lagoon and to better characterize the temporal variability of the water quality dynamics. Instantaneous TN and TP fluxes were also calculated for the Mé River ().
Figure 6. Instantaneous total nitrogen (TN) and total phosphorus (TP) fluxes in the Bété, Djibi and Mé river sites (hatched boxes: high flow conditions, HFC).
According to the importance of discharge, sampling campaigns were classified in high flow condition (HFC) or low flow condition (LFC) (). The small size of the Djibi and Bété catchments makes it difficult to sample at the heart of a flood. For these two catchments, HFC samplings showed rather moderate discharges and therefore low contrast between LFC and HFC. The Mé River showed more contrasted discharge conditions (6 m3 s−1 (LFC) vs. 320 m3 s−1 (HFC)).
Table 3. Physico-chemical parameters of the Bété river (B), Djibi river (D), Mé river (M1, M2) and Aghien Lagoon (L1–L4). Shaded discharge cells indicate sampling under high-flow conditions. DO: dissolved oxygen; TN: total nitrogen; TP: total phosphorus.
At the Djibi site (D), the instantaneous TN fluxes varied from 200 to 700 kg-N d−1, in LFC and from 700 to 1200 kg-N d−1 in HFC. Due to only small variations in concentrations and discharges, instantaneous TP fluxes were stable, ranging from 30 to 95 kg-P d−1 in both LFC and HFC. Only the campaign in June 2015 failed to reveal this pattern, as the highest TP flux reached 205 kg-P d−1 due to the highest TP concentrations (1.37 mg P L−1).
At the Bété site (B), the instantaneous TN fluxes varied from 200 to 500 kg-N d−1, in LFC. In HFC, TN fluxes were above 2000 kg-N d−1. The instantaneous TP fluxes varied from 3 to 60 kg-P d−1, in LFC except for the November 2015 characterised by high TP values in all the sites (lagoon and rivers) except Djibi River. In HFC, TP fluxes increased significantly and varied from 190 kg-P d−1 to 400 kg-P d−1.
At the Mé site (M1), the instantaneous TN fluxes ranged from 600 to 7000 kg-N d−1, in LFC. In HFC, these fluxes increased dramatically and varied from 20000 kg-N d−1 to 53000 kg-N d−1. The instantaneous TP fluxes varied from 45 to 900 kg-P d−1 in LFC. In HFC, TP fluxes ranged from 1800 kg-P d−1 to 6200 kg-P d−1.
Despite the fact that the catchment area and the discharges from the Bété River were bigger than those of the Djibi River, the instantaneous fluxes in the Djibi River were significantly higher during LFC (Wilcoxon test, p-value < 0.05). The lower flow rate of the Djibi River was offset by higher nutrients concentrations in relation with the urbanization of its catchment. On the other hand, TN or TP fluxes in the Bété River were 2 to 4 times higher than those of the Djibi River during HFC. For the Mé River, these fluxes increased dramatically and varied considerably from one campaign to another due to the high variability of both discharges and concentrations.
The total fluxes were also calculated, from June 2015 to the end of December 2016. The results, obtained with the four methods described above, were quite similar for each nutrient (). For the Bété River, total loads to the lagoon ranged from 420 to 510 ton-N and 38 to 58 ton-P. For the Djibi River, the total loads to the lagoon varied less from one method to another, they only ranged from 370 to 380 ton-N and from 29 to 34 ton-P. For the Mé River, the loads varied from 6000 to 7500 ton-N and from 580 to 900 ton-P.
Table 4. Total nitrogen and total phosphorus fluxes between June 2015 and December 2016, calculated using four different methods (see the section on “Nutrients fluxes”).
Related to the catchment area, the TN loads were 2.3 to 3.2 kg-N km−2 d−1 for the Mé, 4.1 to 5.0 kg-N km−2 d−1 for the Bété and 9.1 to 9.3 kg-N km−2 d−1 for the Djibi. In the same way, the TP loads were 0.25 to 0.39 kg-P km−2 d−1 for the Mé, 0.37 to 0.57 kg-P km−2 d−1 for the Bété and 0.73 to 0.84 kg-P km−2 d−1 for the Djibi catchments.
Discussion
Sustainability of the Aghien lagoon
The different terms of the lagoon water budget and particularly the inflows are required to discuss the quantitative sustainability of Aghien lagoon face to the future water demand of Abidjan. Knowing Djibi and Bété streamflow, the groundwater exfiltration and the water level in the lagoon, channel inflow-outflow was deduced from the water budget equation at the 15-minute time step.
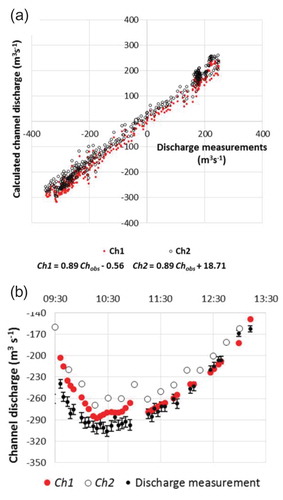
Even if evaporation or rainfall were not well estimated, they were much lower than the flow from the Djibi and Bété Rivers. The major uncertainty of the lagoon water budget concerned the groundwater exfiltration. The detrital formations of the Continental Terminal aquifer show a large range of hydraulic conductivity from 10−5 m s−1 (fine clayey sandy layers) to 10−3 m s−1 (coarse sandy layers) (Osemwegie et al. Citation2018). With 2 values of hydraulic conductivities (10−4 and 10−3 m s−1), the calculated channel discharge (Ch in Equation (1)) were compared to channel discharge measurements (). In , channel discharge measurements were compared to calculated channel discharge without groundwater exfiltration. The slope of the regression line is slightly less than 1. Intercept of the regression line is equal to −2.7 m3 s−1 without groundwater exfiltration, close to 0 for a hydraulic conductivity of 10−4 m s−1. When the hydraulic conductivity is higher (10−3 m s−1), the points are vertically offset (y-intercept becomes 18.7 m3 s−1) (): Ch2 equation). Ch2 inflow discharge to the lagoon were clearly underestimated ()). Therefore, a reasonable conductivity value should be around 10−4 m s−1.
Figure 7. (a) Calculated channel discharge (Ch1, Ch2) versus channel discharge measurements for two values of groundwater hydraulic conductivity (Ch1: 10−4 m s−1; Ch2: 10−3 m s-1). (b) Example for an inflow period. Channel discharge is positive when the flow is out of the lagoon.
The mean calculated channel inflow-outflow was around 220 × 106 m3 month−1 (or 7 × 10⁶ m3 d−1) while the Djibi and Bété contribution was the same order of the groundwater exfiltration (7.3 versus 5.6 × 10⁶ m3 month−1) with high variations between dry and rainy seasons (). The channel inflow-outflow ensured 3 times a month the water renewal of the lagoon while the Djibi and Bété streamflow was equivalent to the lagoon volume only at annual scale. For a year less dry than 2016, the Djibi-Bété contribution would increase but it would be always far below the channel inflow-outflow.
Figure 8. Monthly channel flow in and out of the Aghien Lagoon deduced from the water budget of the Aghien Lagoon.
If we postulate that the population growth rate of Abidjan (3.3%, between the two last censuses: 1998 and 2014) will be the same during the two next decades, the population of Abidjan (5.1 million in 2017) will reach 7.9 million in 2030. At the end of 2017, the groundwater extraction was 7 m3 s−1, which corresponded to a mean consumption rate of 120 L d−1 per inhabitant. With the same consumption rate, 3.7 m3 s−1 must to be found in addition to the current 7 m3 s−1, in 2030.
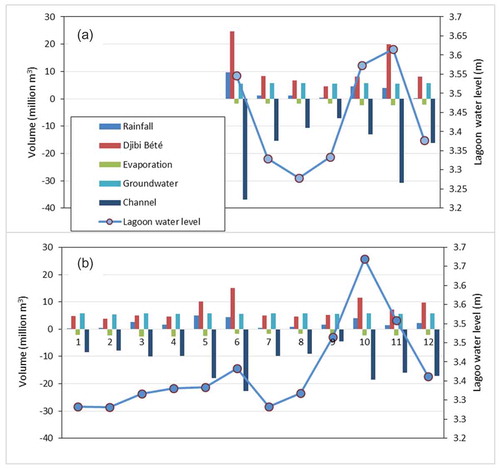
The Abidjan groundwater cannot support this new withdrawal (Artelia Citation2015). How can the Aghien lagoon support a monthly withdraw of 8.8 × 10⁶ m3? In 2016, a rather dry year, 7 months out of 12, the Djibi and Bété streamflow to the lagoon was less than this volume (). Despite the uncertainty about the groundwater exfiltration and according to the importance of the channel inflow-outflow, it is realistic to consider that the lowering of the water level in the lagoon will be offset by a larger inflow of water through the channel.
Figure 9. Monthly components of the lagoon water budget: (a) for 2015 and (b) for 2016. Values are positive for contributions to the lagoon. Groundwater exfiltration is obtained with a hydraulic conductivity fixed at 10−4 m s−1.
As the channel provide the major water flux to the lagoon, a subsidiary question to evaluate the sustainability of the lagoon concern the contribution of the Mé River to the channel flow to the lagoon. A punctual discharge survey during a flood episode of the Mé River (June 2017) was undertaken to a better understanding of the Mé contribution to channel. Discharges were measured at the 3 sections around the confluence of the Mé River to the channel (see sites A, B and C in ) in outflow and inflow conditions. Mé River discharge was around 130 m3 s−1 in each case.
Figure 10. Point discharge survey at the Mé confluence in July 2017 during outflow and inflow phases (discharge is given in m3 s−1, circles represent the gauging sections around the confluence).
In outflow condition, the sum of the channel discharge (site A) and the Mé River discharge (site B) was obviously almost equal to the channel discharge at site C.
In inflow condition, discharge to the lagoon (site A) was almost equal to the sum of the discharges at the site B and C. So, a large part of the Mé River discharge was taken back to the Aghien lagoon. To be in this case, the ratio between discharge at B and discharge at A should be less than 40%.
Some general information about the Mé River contribution to the inflow channel to lagoon can be deduced from this one-time survey:
During Mé low flow periods (75% of the monitoring period), this ratio is less than 10%: the Mé River contribute to the lagoon inflow but its discharge remains low in comparison to the channel inflow (7 × 10⁶ m3). Taking into account the channel volume (10 × 106 m3 deduced from N’Guessan et al. (Citation2011)), the turnover of the channel water is low during the dry seasons.
During high flow periods, when the Mé River discharge is much higher than the up flow at site C, the Mé River should dampen the inflow to the lagoon but we have no direct observations (streamgauges) to confirm this assertion. We can just mention that during the highest Mé River flood of the monitoring period, in June 2015, the channel inflow to lagoon was notably reduce ().
The comparison between the Aghien water level and Mé River discharge time series () remains difficult (for example, no high water levels in the lagoon in June 2017 during the Mé flood, beginning of high water levels in the lagoon in September 2015 and October 2016 before the Mé floods). Other downstream controls probably interfere in the water level in the lagoon.
Urbanisation and quality of the surface waters
The question of how urbanization affects the water quality of the Aghien lagoon and its tributaries has partly been addressed from the samplings carried out.
In the case of long term exchanges between water bodies, like in lagoons, and under a hot climate where ammonification processes are particularly easy (Vymazal Citation2007), the TP:TN ratio appears to be the more appropriate to evaluate the water quality status (McDowell et al. Citation2009). According to MEDD (Citation2003) and SEQ-eau (Citation2010), Aghien lagoon has a quite good water quality status (). The Bété and the Mé Rivers have a fair water quality status and the Djibi River has a poor status. But, according to trophic criteria (OECD Citation1982, Pellerin et al. Citation2011), TP values measured in the lagoon are a clear indicator of hypereutrophic status (threshold = 0.1 mg P L−1). In the same way, according to Grizzetti et al. (Citation2011), TN values are typical of a high potential risk of eutrophication (threshold = 1.5 mg N L−1).
Figure 11. Water quality status at the study sites (M1: Mé river; B: Bété river; D: Djibi river).
The Djibi site revealed the impact of the urbanized part of the catchment on the levels of pollution. The anoxia of the Djibi River and the resulting ammonium as the main form of nitrogen (Vymazal Citation2007, Mangimbulude et al. Citation2012) confirm the eutrophic state of the river and its poor chemical and ecological status. The eutrophic character of Bété and Mé Rivers is not so marked. Even if the TN and TP values are above the eutrophication thresholds, their conductivities and dissolved oxygen values are in the same range as Ivorian coastal rivers (Iltis and Lévèque Citation1982). Their eutrophic states can be discussed in light of thresholds other than those established for rivers under temperate climates. A study (based on urban tropical rivers in the Yangtze delta (China) (Liang et al. Citation2014) sets higher eutrophic thresholds, i.e. at 2.4 mg N L−1 and 0.2 mg P L−1. According to these thresholds, Bété River is only slightly eutrophic.
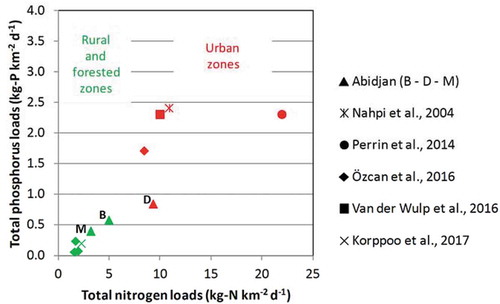
Nutrient loads are generally difficult to compare from one river to another. Numerous physical and anthropogenic factors influence nutrient loads including climate, catchment areas, hydrological processes, land uses, population, industrial settings, and systems of waste water treatment. Nevertheless, TN and TP loads of our studied catchments are compared to those of different authors (). For different rural catchments almost in forest and grassland and for catchments with livestock farming, Özcan et al. (Citation2016) and Korppoo et al. (Citation2017) (south Finland) reported TN and TP loads less than 2.5 kg-N km−2 d−1 and 0.5 kg-P km−2 d−1, respectively. The TN and TP loads of Mé River are in the range of these values, which are characteristic of rural and forested catchments where urbanization is still low. For urban catchments, Van der Wulp et al. (Citation2016) in Jakarta (Indonesia), Perrin et al. (Citation2014) in Fez (Morocco) and Nahpi et al. (Citation2004) in Harare (Zimbabwe) reported TN loads from 10 kg-N km−2 d−1 to 22 kg-N km−2 d−1 and TP loads around 2.5 kg-P km−2 d−1. Even if the TP loads of the Djibi River remains lower, the TN loads are in the same range of values and marked the urban character of the catchment. Bété River presents an intermediate position between the others rivers and the TN and TP loads are in agreement with the increasing degree of urbanization in all three catchments.
Figure 12. Total phosphorus (TP) load versus total nitrogen (TN) load for the Bété (B), Djibi (D) and Mé (M) rivers compared to load in forested, rural and urban catchments.
Conclusions
The Aghien lagoon hydrosystem is of strategic importance for the future water supply of Abidjan in addition to the continued exploitation of groundwater. This study provides baseline information about the sustainability of the Aghien lagoon both in terms of quantity and quality.
The annual flow of the two tributaries (Bété and Djibi Rivers) and the estimation of groundwater exfiltration amount the equivalent twice of the volume of Aghien lagoon. Due to the tide, the monthly rate of turnover of the lagoon by the Aghien-Potou channel is 3. The Aghien lagoon water budget is governed by the flow through the Aghien-Potou channel, whatever the annual rainfall amounts.
The daily channel flow which enters or leaves the Aghien lagoon is in the same order that the channel volume. It implies that the channel water turnover is weak, particularly in the dry seasons when the Mé discharge is small.
According to the importance of the channel inflow-outflow, it is realistic to consider that the lagoon is sustainable face to the future needs of water for the Abidjan district. The water quality review of lagoon and rivers does not allow such optimistic conclusions:
The Djibi River with currently 38% urban areas is already highly impacted by the anthropogenic activities and numerous markers of pollution (anoxic waters, high ammonium concentration, etc.). The Bété River with 12% urbanized zones is obviously less impacted. Nevertheless, taking into account its mean discharge, it contributes higher nutrient loads to the Aghien lagoon than Djibi River. Lagoon sites show both a hypereutrophic status with PT and intense algal and bacterial activities with high pH values and oxygen oversaturation.
In term of knowledge, nutrient loads of the Djibi catchment is in the range of the nutrient exportation features observed in developing countries. Probably, Djibi (and also Bété) loads are underestimated, as floods were under-sampled. Efforts are needed to evaluate groundwater exfiltration and exports during floods. Given the urbanization and the current lack of sewage system and treatment, it would be relevant to monitor pathogen contamination and heavy metals.
A sanitation master plan is in progress in northern Abidjan. As swamps occupy the lower parts of the Djibi and Bété catchments, we suggest that the retention capacities of these wetlands be studied in order to use these swamps as remediation areas (Bateganya et al. Citation2015, Jia et al. Citation2016). In addition to the development of a sanitation basement plan for grey waters, the transformation of these wetlands into improved lagoon ponds could improve the sustainability of the Aghien lagoon.
Acknowledgements
This research work was in part supported by the AMRUGE project from the Ministère de l’Enseignement Supérieur et de la Recherche Scientifique de Côte d’Ivoire and by IRD, the French National Research Institute for Sustainable Development. We are thankful to BRL Ingenierie for the loan of the ADCP gauging equipment.
Disclosure statement
No potential conflict of interest was reported by the authors.
Additional information
Funding
References
- 2030 Water resource group, 2009. Charting our water future, economic frameworks to inform decision making, p. 185. Available from: http://www.2030wrg.org/wp-content/uploads/2014/07/Charting-Our-Water-Future-Final.pdf [Accessed 4 February 2019].
- Adiaffi, B., 2008. Apport de la géochimie isotopique, de l’hydrochimie et de la télédétection à la connaissance des aquifères de la zone de contact “socle-bassin sédimentaire” du sud-est de la Côte d’Ivoire. Thesis (PhD). Université Paris Sud - Paris XI, p. 196 + annexes.
- Ahoussi, K.E., et al., 2013. Evolution spatio-Temporelle des Teneurs en Nitrates des eaux souterraine de la ville d’Abidjan (Côte d’Ivoire). International Journal of Pure and Applied Bioscience, 1 (3), 45–60.
- Artelia, 2015. Actualisation des études hydrogéologiques SOGREAH de 1997. Etude de la gestion et de la protection de la nappe d’Abidjan. Rapport final. p. 67 + annexes.
- Bateganya, N.L., et al., 2015. Buffering municipal wastewater pollution using urban wetlands in sub-Saharan Africa: a case of Masaka municipality, Uganda. Environmental Technology, 16 (17), 2149–2160. doi:10.1080/09593330.2015.1023363
- BRL Ingénierie, 2016. Étude de la protection du bassin versant de la lagune Aghien - phase 4: evaluation du bilan hydrologique de la lagune, p. 28.
- Grizzetti, B., et al., 2011. Nitrogen as a threat to European water quality. In: M.A. Sutton, et al., eds.. European nitrogen assessment. Cambridge, UK: Cambridge University Press, 379–404.
- Hunter, K.S., Wang, Y., and van Cappellen, P., 1998. Kinetic modelling of microbially driven redox chemistry of subsurface environments: coupling transport, microbial metabolism and geochemistry. Journal of Hydrology, 209 (1–4), 53–80. doi:10.1016/S0022-1694(98)00157-7
- Iltis, A. and Lévèque, C., 1982. Caractéristiques physico-chimiques des rivières de Côte d’ivoire. Revue d’Hydrobiologie Tropicale, 15 (2), 115–130.
- Institut national de la statistique de Côte d’Ivoire, 2014. Recensement Général de la population et de l’Habitat 2014 de Côte d’Ivoire. Résultats globaux. Available from: http://www.ins.ci/n/RESULTATS%20GLOBAUX.pdf [Accessed 30 May 2019].
- Jia, Z., et al., 2016. Water quality improvement through five constructed serial wetland cells and its implications on nonpoint-source pollution control. Hydrological Sciences Journal, 61 (16), 2946–2956. doi:10.1080/02626667.2016.1171323
- Jourda, J.P., 1987. Contribution à l’étude géologique et hydrogéologique de la région du grand Abidjan (Côte d’Ivoire). Thesis (PhD). Université Scientifique et Médicale de Grenoble, p. 299 + annexes.
- Kim, K., et al., 2002. Inorganic chemicals in an effluent-dominated stream as indicators for chemical reactions and streamflows. Journal of Hydrology, 264 (1–4), 146–156. doi:10.1016/S0022-1694(02)00074-4
- Korppoo, M., et al., 2017. Simulation of bioavailable phosphorus and nitrogen in an agricultural river basin in Finland using VEMALA v.3. Journal of Hydrology, 549, 363–373. doi:10.1016/j.jhydrol.2017.03.050
- Lall, S.V., Henderson, J.V., and Venables, A., 2017. Africa’s cities: opening doors to the world. Washington, DC: World Bank, 166.
- Liang, X., et al., 2014. Biological thresholds of nitrogen and phosphorus in a typical urban river system of the Yangtze delta, China. Environmental Pollution, 192, 251–258. doi:10.1016/j.envpol.2014.04.007
- Mangimbulude, J., van Straalen, N.M., and Röling, W.F.M., 2012. Microbial nitrogen transformation potential in surface run-off leachate from a tropical landfill. Waste Management, 32, 77–87. doi:10.1016/j.wasman.2011.07.029
- McDowell, R.W., Larned, S.T., and Houlbrooke, D.J., 2009. Nitrogen and phosphorus in New Zealand streams and rivers: control and impact of eutrophication and the influence of land management. New Zealand Journal of Marine and Freshwater Research, 43, 985–995. doi:10.1080/00288330909510055
- MEDD, 2003. Système d’évaluation de la qualité de l’eau des cours d’eau. Grilles d’évaluation SEQ-eau (Version 2). MEDD, Agences de l’eau. Available from: http://rhin-meuse.eaufrance.fr/IMG/pdf/grilles-seq-eau-v2.pdf [Accessed 5 May 2019].
- Moatar, F. and Meybeck, M., 2005. Compared performance of different algorithms for estimating annual nutrient loads discharged by the eutrophic River Loire. Hydrological Processes, 19, 429–444. doi:10.1002/hyp.5541
- Monteny, P.A. and Lhomme, J.P., 1980. Données climatiques recueillies à la station ORSTOM Adiopodoumé, (1948–1979). Adiopodoumé: ORSTOM, 31.
- N’Guessan, Y.A., et al., 2011. Granulometric analysis and environment of deposits of superficial sands of the Adjin lagoon (Côte d’Ivoire). Revue Paralia, 4, 6.1–6.14. doi:10.5150/revue-paralia.2011.006 [[Accessed 1 May 2019].
- Nahpi, I., Siebel, M.A., and Gijzen, H.J., 2004. The impact of urbanisation on the water quality of Lake Chivero, Zimbabwe. Water and Environment Journal, 18 (1), 44–49. doi:10.1111/j.1747-6593.2004.tb00492.x
- Ndlela, L.L., et al., 2016. An overview of cyanobacterial bloom occurrences and research in Africa over the last decade. Harmful Algae, 60, 11–26. doi:10.1016/j.hal.2016.10.001
- Nyenje, P.M., et al., 2010. Eutrophication and nutrient release in urban areas of sub-Saharan Africa–a review. Science of the Total Environment, 408, 447–455. doi:10.1016/j.scitotenv.2009.10.020
- Nyenje, P.M., et al., 2014. Phosphorus transport and retention in a channel draining an urban, tropical catchment with informal settlements. Hydrology and Earth System Sciences, 18, 1009–1025. doi:10.5194/hess-18-1009-2014
- Oberg, K.A. and Mueller, D.S., 2007. Validation of stream-flow measurements made with acoustic doppler current profilers. Journal of Hydraulic Engineering, 133 (12), 1421–1432. doi:10.1061/(ASCE)0733-9429(2007)133:12(1421)
- OECD (Organization for Economic Cooperation and Development), 1982. Eutrophication of waters. Monitoring assessment and control. Final report. OECD cooperative programme on monitoring of inland waters (eutrophication control), environment directorate. Paris: OECD, 154.
- Osemwegie, I., et al., 2018. Multi-tracer assessment of seasonal water source changes in coastal water systems along the southeastern coast of Ivory Coast (West Africa). Hydrological Sciences Journal, 63 (15–16), 2124–2145. doi:10.1080/02626667.2018.1558366
- Özcan, Z., Kentel, E., and Alp, E., 2016. Determination of unit nutrient loads for different land uses in wet periods through modelling and optimization for a semi-arid region. Journal of Hydrology, 540, 40–49. doi:10.1016/j.jhydrol.2016.05.074
- Pellerin, H., Dorioz, J.-M., and Morel, C., 2011. Bilan environnemental du phosphore. In: M.C. Girard, et al., eds. Sols et environnements. Paris: Dunod, 358–377.
- Perrin, J.L., et al., 2014. Water quality assessment of highly polluted rivers in a semi-arid Mediterranean zone Oued Fez and Sebou river (Morocco). Journal of Hydrology, 510, 26–34. doi:10.1016/j.jhydrol.2013.12.002
- Raymond, S., et al., 2013. Choosing methods for estimating dissolved and particulate riverine fluxes from monthly sampling. Hydrological Sciences Journal, 58 (6), 1326–1339. doi:10.1080/02626667.2013.814915
- Salles, C., Tournoud, M.G., and Chu, Y., 2008. Estimating nutrient and sediment flood loads in a small Mediterranean river. Hydrological Processes, 22 (2), 242–253. doi:10.1002/(ISSN)1099-1085
- SEQ-eau, 2010. Arrêté du 25/01/2010 relatif aux méthodes et critères d’évaluation de l’état écologique, de l’état chimique et du potentiel écologique des eaux de surface pris en application des articles R. 212-10, R. 212-11 et R. 212-18 du code de l’environnement. Available from: http://www.legifrance.gouv.fr/affichTexte.do?cidTexte=JORFTEXT000021865356 [Accessed 4 May 2019].
- Stenback, G.A., et al., 2011. Rating curve estimation of nutrient loads in Iowa rivers. Journal of Hydrology, 396 (1–2), 158–169. doi:10.1016/j.jhydrol.2010.11.006
- Tastet, J.P. and Guiral, D., 1994. Géologie et sédimentologie. In: ORSTOM, ed. Environnement et ressources aquatiques de Côte d’Ivoire - Tome II. Paris, France: les milieux lagunaires, 35–57.
- UN-DESA, 2015. World population prospects: the 2015 revision, key findings and advance tables. Working Paper No. ESA/P/WP.241, p. 66. Available from: https://esa.un.org/unpd/wpp/Publications/Files/Key_Findings_WPP_2015.pdf [Accessed 30 May 2019].
- UN-Habitat, 2002. Global urban indicators database, Version 2, p. 41. Available from: https://unhabitat.org/books/global-urban-indicators-database/ [Accessed 25 May 2019].
- Van der Wulp, S.A., et al., 2016. Numerical simulations of river discharges, nutrient flux and nutrient dispersal in Jakarta Bay, Indonesia. Marine Pollution Bulletin, 110, 675–683. doi:10.1016/j.marpolbul.2016.05.015
- Varlet, F., 1978. Le régime de la lagune Ébrié (Côte d’Ivoire), traits physiques essentiels. In: ORSTOM, ed. Travaux et documents de l’ORSTOM. Paris, 162. + annexes.
- Vymazal, J., 2007. Removal of nutrients in various types of constructed wetlands. Science of the Total Environment, 380, 48–65. doi:10.1016/j.scitotenv.2006.09.014
- Yéo, K.M., et al., 2015. Physicochemical quality of coastal Potou lagoon (Côte d’Ivoire, Western Africa). Journal of Water Resource and Protection, 7, 741–748. doi:10.4236/jwarp.2015.79061
Appendix A
Figure A1. Rating curves of the Bété, Djibi and Mé (M1) streamgauge stations.