
 ?Mathematical formulae have been encoded as MathML and are displayed in this HTML version using MathJax in order to improve their display. Uncheck the box to turn MathJax off. This feature requires Javascript. Click on a formula to zoom.
ABSTRACT
Water temperature monitoring is important in many scientific studies. This study compares three models of water temperature sensors (Vemco Minilog II, HOBO TidbiT and HOBO Pendant) to test the importance of: (1) using cross-calibration to minimize relative errors, (2) using cross-calibration to improve on the accuracy of less accurate sensors, and (3) protecting sensors against direct solar radiation heating. The results show that when the same sensor models are cross-calibrated, the relative error can be reduced (Vemco: 0.01°C; HOBO TidbiT: 0.02°C; and HOBO Pendant: 0.07°C). Cross-calibration can also improve less accurate sensors (HOBO TidbiT and Pendant) to similar accuracies of Vemco (±0.1°C). Finally, no evidence of solar radiation heating was observed for Vemcos (unprotected); however, HOBO TidbiT and Pendant showed heating up to 2°C (maximum). When HOBO TidbiT and Pendant are shielded (flow-through system), heating is no longer an issue.
Editor A. CastellarinAssociate editor X. Fang
Introduction
River and stream temperature is an important variable that influences many physical, chemical and biological processes in river ecosystems and plays a key role in many hydrological studies. Among others, it influences the metabolic and growth rate of fishes, as well as being a major determinant of the geographical distribution of fish species within river systems. In order to implement any fisheries management strategies (related to high temperature or otherwise) it is important to have a good understanding of the natural water temperature variability within rivers. Also, better quantifying river temperatures and associated variabilities are essential in the development of better water temperature models (Webb et al. Citation2008). These models range from simple statistical relationships and stochastic models (Cluis Citation1972, Pilgrim et al. Citation1998, Ahmadi-Nedushan et al. Citation2007, Caissie et al. Citation2016) to more complex deterministic models (e.g. Brown Citation1969, Morin and Couillard Citation1990, Sinokrot and Stefan Citation1993, Hebert et al. Citation2011). As such, water temperature monitoring is becoming increasingly important to address many hydrology and fisheries related issues. Moreover, the monitoring of river temperatures has become easier with the advent of low cost and reliable water temperature sensors.
Although water temperatures are monitored in rivers by different groups and agencies (both government and non-government groups), many regions do not have a comprehensive and well-structured river temperature monitoring programs (Benyahya et al. Citation2014). Water temperature is often monitored using different models of sensors coming from different manufacturers which provide data with various temperature accuracies (USEPA Citation2014). For instance, the latter study discusses important issues to consider when acquiring water temperature sensors including the sensor accuracy, temperature range, battery life, memory or storage capacity, and the cost among others. Also of importance are the protocols that are followed when installing water temperature sensors in order to have the best possible data quality for present and future use (Dunham et al. Citation2005). Studies have used a flap attachment on the top of sensors or PVC shields to prevent any direct solar radiation heating (e.g. Dunham et al. Citation2005, Isaak and Horan Citation2011). Although the protection of water temperature sensors against direction solar radiation heating is recognised as important in the literature, detailed analyses of such an approach are sparse. Moreover, such studies may prove important for water resources managers when planning or implementing good water temperature monitoring programs. Therefore, the objective of this study is to compare different models of water temperature sensors under different thermal regimes (small tributaries to large rivers) and forest canopy closures. In addition, the potential benefits of having sensors within a flow-through protective casing (shielded) vs no protective casing (open), i.e. subject to direct solar radiation heating is also investigated. Within this study, both precision and accuracy are discussed. Here, the accuracy refers to the closeness of a measured value to a standard value or the true value. The accuracy of sensors is generally a function of the construction and the technology used by the manufacturer of the sensor. In this study, each model type has a stated manufacturer accuracy. The precision refers to reproducibility and repeatability of measured values under the same condition, i.e. how close two or more temperature measurements are to each other. Some sensors have been observed to experience temperature drift over time, and this could be important in some studies. In this study, the analysed period was relatively short and, as such, no drifting of water temperatures was assumed (this aspect was not considered in the study).
The specific objectives of this study are: (1) to use different models of water temperature sensors with various stated manufacturer accuracies (ranging from ±0.5°C to ±0.1°C); (2) to cross-calibrate all sensors to see if improved relative difference is possible among different sensors; (3) to compare the results of water temperature monitoring with and without the use of a flow-through protective casing (shielded vs open) to study the potential impact of direct solar radiation heating on sensors; and (4) to install water temperature sensors in different river settings (from small tributaries to large rivers) and study the influence of different forest canopies. This study was carried out within Miramichi River drainage basin (New Brunswick, Canada).
Study sites and data collection
Different models of water temperature sensors were installed in three different river environments, a first-order tributary, a brook-size stream and a large river. The first study site is located within the first tributary (Trib 1) of Catamaran Brook (). The basin drainage area upstream of Trib 1 is 4.5 km2 and this brook has a mean annual flow of 0.10 m3 s−1. Trib 1 has a stream width of 2 m with an average depth of 0.12 m. The canopy closure at Trib 1 is typically between 85% and 90%, so it represents a well shaded site. The second study site is located within the main stem of Catamaran Brook (CatBk; drainage area: 27 km2) approx. 8 km upstream from its confluence with the Little Southwest Miramichi River. At this site, Catamaran Brook is approximately 10 m in width and has a mean water depth of 0.21 m, with a mean annual flow of 0.65 m3 s−1. The forest along CatBk has a canopy closure of approx. 55–65%. Therefore, this site would experience direct solar radiation reaching the water surface during part of the day, i.e. a period of high solar elevation angle. The third study site is located on the Little Southwest Miramichi River (LSWM) above the confluence of Catamaran Brook (). The LSWM has a drainage basin of 1190 km2 at the study site and the river is approximately 80 m in width; the river has an average depth of 0.55 m and a mean annual flow of 29.6 m3 s−1. The forest along the LSWM has a canopy closure of less than 20%. As such, this study site is well exposed to meteorological conditions and direct solar radiation throughout most of the day.
Figure 1. Location of water temperature monitoring sites in Catamaran Brook (CatBk), Tributary 1 (Trib 1) and Little Southwest Miramichi River (LSWM).
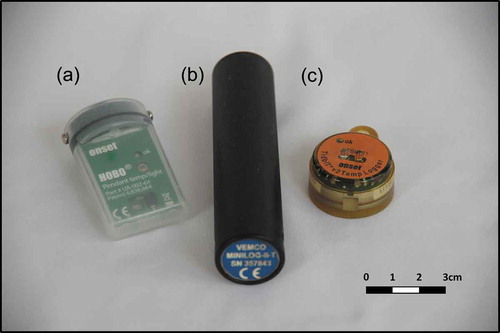
At each study site, three different models of sensors were installed to compare river water temperature measurements using different models and accuracies of sensors. These sensors are (1) Vemco Minilog II, (2) HOBO TidbiT and (3) HOBO Pendant (). In all, 30 sensors (10 of each type) were deployed during the study. The Vemco Minilog II has a manufacturer stated accuracy of ±0.1°C for a temperature range of –5°C to 35°C, with a battery life of 10 years; the HOBO TidbiT v2 has a stated accuracy of ±0.2°C over a temperature range of 0–50°C and a battery life of 5 years; and the HOBO Pendant has a stated accuracy of ±0.5°C over a temperature range of 0–50°C and a battery life of 1 year. The battery of the HOBO Pendant can be replaced, while it cannot be replaced for the Vemco Minilog II and the HOBO TidbiT.
Figure 2. Different models of water temperature sensors used in the present study: (a) HOBO Pendant (±0.5°C), (b) Vemco Minilog II (±0.1°C) and (c) HOBO TidbiT (±0.2°C).
All 30 water temperature sensors were initially installed under shielded conditions in Catamaran Brook (using cut-out branches of vegetation to provide shade on top of the sensors) for a period of 1 week (5–13 July 2017) to collect data in a common temperature environment for the cross-calibration. Data were collected every 30 min (number of samples, N = 377 for the cross-calibration and N = 1824 between 14 July and 20 August 2017, i.e. for the study). The objective of the cross-calibration is to compare and adjust all sensors to the same mean water temperature during the calibration period, in order to better detect differences among sites and treatments (open vs shielded conditions).
After the calibration period, all sensors were redeployed in the three different river environments described above, namely Trib 1, CatBk and LSWM (see ). Sensors were installed at depths similar to mean discharge depths (0.12–0.55 m; see above). During the redeployment, some sensors were attached using a cable inside a protective casing (100 mm diameter plastic PVC pipe, 300 mm in length) to be used as a flow-through system (all three sensor models in the same PVC pipe). The PVC pipe was secured close to the bottom of the stream using a rebar. Sensors were installed in a well-mixed environment of the river (flowing water) where no groundwater upwelling conditions were present. These sensors are referred to as shielded sensors. A matching set of sensors without solar shields was installed at the same three stream locations to study any potential influence of direct solar radiation heating on the sensors. The CatBk and LSWM sites are more exposed to direct solar radiation; therefore, 24 sensors were installed (one replica for each sensor model, and for open and shielded conditions). Fewer sensors were installed in Trib 1 (six in total, no replicas) because of the limited number of sensors and because this site was the most naturally shaded site.
To compared differences in the mean water temperatures, both parametric (Student’s t distribution) and nonparametric (Wilcoxon signed-rank) tests were performed on the different sensors (manufacturer/model), as well as on different treatments (open vs shielded). The significance level of 95% (p < 0.05) was used to test the differences in both parametric and nonparametric analyses. All analyses were performed in the statistical freeware R (R Development Core Team Citation2017). Where the results of the parametric and nonparametric tests were the same, only the parametric results are reported; otherwise both are presented.
Results and discussion
Cross-calibration of water temperature sensors
Following the deployment of all 30 sensors in CatBk for a 1-week cross-calibration period (5–13 July 2017), the mean water temperature was 17.93°C as the average of the Vemco Minilog II sensors. It is to be noted that water temperatures are presented to 0.01°C for comparison purposes only. During the cross-calibration period, water temperatures varied between a minimum of 14.4°C (13 July 08:30 h) and a maximum of 21.8°C (9 July 16:30 h).
) shows the difference in mean water temperature among all sensors in comparison to the overall mean of the Vemco Minilog (i.e. 17.93°C). For the purpose of this study, the mean of 17.93°C was selected to reflect an arbitrary “true temperature” for the cross-calibration period. For instance, the greatest difference among the Vemco Minilog sensors was observed in Sensor 1 at –0.07°C (i.e. a mean temperature of 17.86°C; cross-calibration period). As expected, all Vemco Minilog sensors were within ±0.1°C (stated manufacturer accuracy) of the calculated mean value. The HOBO TidbiT sensors showed a slightly higher overall mean temperature (17.99°C) than the overall mean of Vemco Minilog sensors. A difference between 0.04°C (Sensor 15) and 0.10°C (sensors 11 and 18) was observed for the HOBO TidbiT sensors. The HOBO Pendant sensors also showed a higher overall mean water temperature, at 18.11°C. The difference ranged between 0.14°C (Sensor 24) and 0.21°C (Sensor 26; )).
Figure 3. Water temperatures during the calibration period (5–13 July 2017): (a) differences between each sensor and the mean water temperature of Vemco Minilogs (17.93°C); (b) relative error of all adjusted sensors compared to Sensor 5 (see text for details).
All water temperature sensors were then adjusted by an offset temperature so that they would all have the same mean overall temperature of 17.93°C during the cross-calibration period (offset values are presented in )). The objective of the cross-calibration is to more effectively compare temperatures among sites and selected treatments. The Vemco Minilog (Sensor 5) was used as the standard unit, i.e. the sensor which had the closest mean temperature compared to the overall mean of 17.93°C (a difference of 0.00043°C; )). When using the Vemco Minilog (Sensor 5) as the standard unit, the difference in temperatures expressed as a relative error (RE), i.e. the differences between Sensor 5 (adjusted) and all other adjusted temperature sensors, was calculated. The relative error (RE) is given by:
where Twi(S5) represents the adjusted water temperatures for Sensor 5, Twi(other) represents the adjusted water temperatures for all other sensors and N represents the total number of data points (every 30 min) during the cross-calibration period.
The results of this analysis are presented in ). The RE for the Vemco Minilog sensors was less than 0.013°C (mean: 0.010°C for all 10 sensors), whereas that for the HOBO TidbiT sensors was less than 0.03°C (mean: 0.02°C) and for the HOBO Pendant sensors less than 0.06°C (mean: 0.04°C). These results show that when sensors are cross-calibrated, the difference in temperature among them (different units and models) can be significantly reduced. The RE values were less than 0.06°C after the cross-calibration ()). This reduction in the relative error or temperatures differences can improve the accuracy of less accurate sensors, i.e. HOBO TidbiT (±0.2°C) and HOBO Pendant (±0.5°C). In fact, the low RE of the HOBO TidbiT and HOBO Pendant sensors (after the cross-calibration) should bring these units to an accuracy similar to the Vemco Minilog (i.e. ±0.1°C). These results show the importance of cross-calibration among sensors in order to improve the overall temperature differences or relative errors (and accuracy for less accurate sensors); this can improve river temperature monitoring networks.
Improved precision is also possible when cross-calibration is carried out among the same sensor models. However, the accuracy remains the same as stated by the manufacturer. For instance, if HOBO TidbiT sensors were cross-calibrated only among themselves, the mean temperature for would be 17.99°C (value used for offsetting). When the HOBO TidbiT Sensor 11 (with the mean temperature closer to the mean temperature of HOBO Tidibit sensors) is used as a standard unit and all other HOBO TidbiT temperatures are compared to this sensor (after the cross-calibration), the overall RE ranges between 0.009°C and 0.027°C (mean: 0.02°C). This means that, although these sensors may only provide water temperatures accurately within ±0.2°C (i.e. of the true water temperature – reported accuracy by the manufacturer), a comparison of temperatures among sensors is possible with RE less than 0.03°C. Such a cross-calibration and low RE can be very useful when comparing temperatures among sites, i.e. spatial analysis of river temperatures (different rivers), or differences in temperatures among river reaches in hydrological studies.
A similar analysis was carried out with the HOBO Pendant sensors, where the mean temperature was 18.11°C. After a cross-calibration with Sensor 21 (the sensor with the mean temperature closer to that of HOBO Pendant), the RE among all other HOBO Pendant sensors varied between 0.034°C and 0.066°C, with an overall mean RE of 0.04°C. Although HOBO Pendant sensors have an accuracy of ±0.5°C, cross-calibration can be used to compare temperatures among sites with a relative error of approximately 0.07°C. The RE of the cross-calibrated HOBO TidbiT (0.03°C) and HOBO Pendant sensors (0.07°C) was slightly higher than that of the cross-calibrated Vemco Minilog sensors (0.01°C). The results show that cross-calibration can improve water temperature monitoring networks (or studies dealing with the comparison of temperatures at different spatial scales) when using the same sensor models.
When combining less and more accurate sensors within the same water temperature network, improvement in the accuracy of less accurate sensors is possible. In the case where a water temperature network is already set up, the deployment of more accurate sensors for a short cross-calibration period (a few weeks) at each site can also be used to improve existing network accuracies.
Impact of direct solar radiation on water temperature sensors
Following the cross-calibration, water temperature sensors were redeployed in different river environments where some sensors were shielded and others were not (open). The period of study was from 14 July to 20 August 2017 (38 days). Water temperature varied both spatially (among sites) and temporally (over the study period; ). In , the mean hourly water temperature at each site represents the mean value of shielded sensors. The mean overall water temperature at Trib 1 was 14.9°C, where temperatures varied between 11.1°C (minimum) and 19.7°C (maximum). In CatBk, the mean overall temperature was 17.3°C (min: 12.4°C, max: 23.5°C). The LSWM was the warmest site, with a mean overall temperature of 21.1°C (min: 15.0°C, max: 28.4°C).
Figure 4. Mean hourly water temperatures at each site for sensors under shielded conditions (protected against direct solar radiation heating) during the study period (14 July–20 August 2017; 38 days).
A comparison of the mean water temperature among sensors/sites is provided in . The value on top of each bar is the standard deviation (SD). For instance, six sensors were installed at Trib 1 (three open and three shielded; )). When comparing the differences in mean temperatures among all models at Trib 1, no significant differences were observed among sensors (p > 0.4). The largest difference in water temperature was observed between the HOBO TidbiT (open; 14.88°C) and the HOBO Pendant (open; 14.93°C); however, the difference among these two sensors was not significant (p = 0.5). In addition, when data of open vs shielded sensors are pooled, no significant differences were observed at Trib 1 (p = 0.9). The results show that in very shaded environments (Trib 1; canopy closure of 85–90%), direct solar radiation heating may not be prevalent, as all mean temperatures were generally the same (with no significant differences). However, it should be pointed out that this study was carried out during the summer period when the forest canopy was fully developed (at maximum). It is important to protect sensors against solar radiation heating in shaded environments too (i.e. all year) as canopy closure could change on a seasonal basis.
Figure 5. Mean water temperatures during the study period for various sensor models (Vemco Minilog, HOBO TidbiT and HOBO Pendant) and for both shielded and open conditions. Values on top of bars represent the standard deviation (SD).
A similar analysis of mean water temperatures was carried out at CatBk, where the differences were only noted for open sensors ()). No significant differences were found among all sensors under shielded conditions (p > 0.8), and no significant differences were found among sensors of similar models under open conditions (p > 0.58). However, if all open and shielded sensors are pooled, there is a significant difference (p < 0.004), i.e. open sensors had an overall higher mean temperature than the shielded sensors. When comparing open vs shielded sensors by model, the results show that the Vemco Minilog sensors did not show any significant difference (p = 0.9); however, the HOBO TidbiT showed a significant difference (p < 0.045; both parametric and nonparametric tests showed the same results) and the HOBO Pendant sensors also showed a significant difference (p < 0.005). Under open conditions, the Vemco Minilog sensors were significantly different than the HOBO Pendant sensors (p < 0.004), but not compared to the HOBO TidbiT sensors (p > 0.06). The HOBO TidbiT and HOBO Pendant sensors did not show any significant differences for open conditions (p = 0.28). The results for CatBk showed similar temperatures for Vemco Minilog sensors (open vs shielded); however, both HOBO TidbiT and HOBO Pendant sensors showed significantly higher temperatures for open conditions.
The analysis for the LSWM showed similar results to CatBk, in that pooled data (open vs shielded) showed a significant difference (p < 0.0001; )). For the open conditions, no significant differences were noted among similar models (Sensor 1 vs Sensor 2; p > 0.53). However, when comparing among models for open conditions, there was a significant difference between the Vemco Minilog sensors and the HOBO TidbiT sensors (p < 0.01) as well as between the HOBO Pendant sensors (p < 0.0001). The HOBO TidbiT sensors also showed a significant difference compared to the HOBO Pendant sensors (p < 0.005). Sensors under shielded conditions did not show any significant differences among models (p > 0.81). When comparing open vs shielded conditions, the Vemco Minilog sensors did not show any significant differences (p = 0.94); however, both the HOBO TidbiT (p < 0.02) and HOBO Pendant sensors (p < 0.0001) showed a significant difference. In all the differences that were significant between open and shielded conditions, the mean water temperatures of open sensors were slightly higher. These results suggest that some sensors, particularly the HOBO TidbiT and HOBO Pendant sensors, are subject to direct solar radiation heating when installed unprotected. The results also show that sensors in more open environments (less canopy) have greater temperature differences. Isaak and Horan (Citation2011) also showed some level of sensor heating when direct solar shield protection was removed from sensors and differences in temperatures were in the range of 0.2–0.5°C (maximum values). The water temperature sensors used in their study were HOBO TidbiT v2, similar to those used in this study. Similar results were also observed by Johnson and Wilby (Citation2013), who studied the impact of direct solar radiation heating on Gemini Tinytag Aquatic 2 thermistors. They observed a maximum difference of 1.6°C due to direct solar radiation heating; however, their outdoor experiment was carried out in aquaria, with conditions very different compared to the stream environment of our study.
The results of this study show the level of heating that can occur as a function of canopy closure: shielding the sensors will effectively prevent any direct solar radiation heating. It is important for the flow-through system (PVC pipe) not to have holes, as holes would let some direct solar radiation penetrate the housing and potentially heat sensors during specific times of the day.
As the HOBO TidbiT and HOBO Pendant sensors recorded higher temperatures under open conditions, such direct solar radiation heating should also be noticeable on a diel scale (over the 24-h period). shows a boxplot of hourly temperature differences for a few sensors (under open conditions) compared to the average temperatures under shielded conditions. For instance, the Vemco Minilog (Sensor 2) in the LSWM under open conditions showed practically no differences when compared to the shielded sensors (average temperatures; )). Similar results were observed with all the other Vemco Minilog sensors. After contacting the manufacturer of these units to understand why they did not react to direct solar radiation heating, a representative of the company replied that is was presumably because of the larger and thicker epoxy casing used in the construction of these units. They also replied that the Vemco Minilog IIs have not been tested for direct solar radiation heating. The results for all sensors under shielded conditions were comparable to those shown in ).
Figure 6. Boxplot of hourly temperature differences for selected sensors under open conditions (difference = temperature of sensor – average temperature of shielded sensors).
Alternatively, if sensors were installed in a river without a protective casing, then a diel heating pattern was generally observed for the HOBO TidbiT and HOBO Pendant sensors. In the case of Trib 1, the HOBO TidbiT (open) showed very little diel heating (figure not shown) and the HOBO Pendant sensor (open) showed a slight heating during the day ()). In ), the highest temperature difference was observed at 12:00 h (median: 0.08°C, maximum recorded value (difference): 0.84°C). Although the mean temperature differences at Trib 1 (open vs shielded) are not significantly different (see above), a slight heating component is nevertheless noticeable during specific times of the day. This heating most likely occurred when direct sunlight penetrated the forest canopy and reached the sensor.
In CatBk, the results of two sensors are presented, i.e. HOBO TidbiT Sensor 1 ()) and HOBO Pendant Sensor 2 ()). The results for the other sensors were similar. The HOBO TidbiT (Sensor 1) showed a median value of 0.42°C at 12:00 h and a maximum recorded difference of 0.85°C ()). Direct solar radiation heating of sensors generally occurred between 08:00 h and 18:00 h; however, the most important differences were noted between 09:00 h and 13:00 h, suggesting that after 13:00 h some of the sensors would be in a partially shaded section of the brook. The HOBO Pendant (Sensor 2) showed similar results but with higher differences in temperatures ()). The highest median value was observed at 12:00 h, with a temperature difference of 0.98°C and the maximum recorded difference was 1.85°C (also at 12:00 h). The potential shading effect (forest canopy) towards the end of the day was more visible for the HOBO Pendant (Sensor 2; )) than for the HOBO TidbiT (Sensor 1; )).
In the case of the LSWM, the results for the HOBO TidbiT (Sensor 2) and HOBO Pendant (Sensor 1) are presented in . The results of the other sensors (not shown) were similar. The HOBO TidbiT (Sensor 2) in LSWM showed differences that are similar to those in CatBk. The highest difference in temperatures was observed at 13:00 h, with a median value of 0.66°C (maximum difference: 1.07°C). The HOBO Pendant (Sensor 1) in LSWM showed a median value of 1.22°C (13:00 h) and a maximum difference of 2.20°C. Stream orientation could be an important factor, particularly in CatBk, where temperature differences were highest around noon (12:00 h) and dropped sharply after 14:00 h ()), suggesting that sensors were shaded later in the afternoon. The LSWM sensors were observed to be heating throughout most the day (); however, a slight drop in temperature differences after 18:00 h ()) could be the result of forest canopy shading towards the end of the day.
Isaak and Horan (Citation2011) reported that maximum daily temperatures are more likely to be affected by direct solar radiation of sensors than minimum daily temperatures, although they have not quantified such differences. The results of this study show that the greatest direct solar heating of sensors generally occurred around mid-day (12:00–13:00 h). As such, it is likely that the maximum daily recorded temperatures would be more influenced by direct solar radiation heating, than the minimum daily temperatures, occurring early in the morning (07:00–08:00 h) when the solar elevation angle is low. shows the differences between open and shielded temperatures for the daily minimum and maximum temperatures. This analysis was carried out over the 38-day study period (14 July to 20 August 2017).
Figure 7. Boxplot of temperature differences at open sites when calculating minimum and maximum daily water temperatures (difference = open site temperature – average temperature of shielded sites).
All daily minimum and maximum water temperatures of open Vemco sensors showed they were not affected by direct solar radiation heating (Vemco; ). As expected, the daily minimum temperatures of open sensors were not strongly affected (), although slight differences were noted in LSWM (HOBO Pendant Sensor 1; median: 0.17°C). In the case of the maximum daily temperatures only a slight difference was noted for the HOBO Pendant in Trib 1 (median: 0.10°C; )). These results suggest that, under relatively high canopy closure, both minimum and maximum daily temperatures would be well captured under both open and shielded sensor conditions. However, major differences are noted in the maximum water temperatures for HOBO TidbiT (median: 0.33°C) and HOBO Pendant (median: 0.30°C) at CatBk ()). At CatBk, a maximum temperature difference of over 2°C was observed for the HOBO Pendant (Sensor 1). Similar results were observed for HOBO TidbiT (median: 0.37–0.43°C) and HOBO Pendant sensors (median: 0.92–1.03°C) at LSWM ()). In the LSWM, a maximum difference of 2.35°C was observed for the HOBO Pendant (Sensor 1).
Studies have shown that other factors (e.g. flow, wind) can influence measurement biases when monitoring environmental parameters (e.g. Terando et al. Citation2017). As such, to assess the potential influence of water levels (flow) on direct solar heating of sensors, a regression analysis of the effect of river discharge on open-site temperature differences for daily maximum temperatures was conducted. The discharge was relatively stable during the study period at all sites, with flows of between 0.007 and 0.067 m3 s−1 at Trib 1 (mean: 0.016 m3 s−1); between 0.045 1 and 0.426 m3 s−1 at CatBk (mean: 0.099 m3 s−1) and between 6.58 and 15.3 m3 s−1 at LSWM (mean: 8.96 m3 s−1). The regression analysis showed that, of 15 regressions, there were five significant relationships (p < 0.05) and only one significant relationship with a negative slope (Trib 1; HOBO TibiT; slope: – 2.58; R2 = 0.15). As discharge was generally low at Trib 1 (< 0.07 m3 s−1), this slope represents a weak response between the maximum temperature differences and discharge (less than 0.2°C). Some of the strongest significant relationships (0.12 < R2 < 0.35) had positive slopes (higher maximum temperature differences associated with higher flows) and most likely influenced by a few random outliers. As sites were of shallow depths (<0.55 m) and clear water, the water level was not a predominant factor in direct solar radiation heating.
Conclusions
In this study we evaluated the performance of multiple water temperature sensors under varying riverine conditions to assess the importance of different materials and calibration choices in hydrological studies. The first objective of the study was to cross-calibrate sensors in order to increase the precision and more effectively compare water temperatures among units and sites. The results of this part of the study show that the relative error (RE) among sensors was significantly reduced following the cross-calibration, with RE less than 0.06°C for all sensors. The advantage of an increased precision within a water temperature network lies in the ability to better compare water temperatures at different spatial scales (e.g. river, reach).
The second objective was to use the cross-calibration (different sensor models and accuracies) in order to improve the accuracy of less accurate sensors. These results show that you can bring the accuracy of less accurate sensors to a similar accuracy of more accurate sensors by cross-calibrating. In this study, the accuracy of both HOBO TidbiT (±0.2°C) and HOBO Pendant (±0.5°C) sensors was similar to that of Vemco Minilog sensors (±0.1°C) after the cross-calibration.
The third objective of the study was to shield sensors (using a flow-through protective PVC pipe) to protect them from direct solar radiation heating during the day. Different types of stream settings (ranging from a small tributary stream with a high canopy closure to a wide and large river environment with a low canopy closure) were studied. The results show that when some sensors are directly installed in a stream environment (e.g. HOBO TidbiT and HOBO Pendant), significant direct solar radiation heating of the sensors can occur (as much as 2°C). Most of the direct solar radiation heating occurred on open sites (e.g. LSWM) during the middle of the day when the angle of solar elevation was high. However, when sensors were put into a flow-through protective casing, there was no evidence of direct solar radiation heating.
We believe that the results of our study can improve the overall water temperature monitoring and data quality. Improved water temperature data will contribute towards the development of better water temperature models (from both a predictive and a forecasting perspective), as well as contribute toward better management of fisheries and aquatic resources.
Acknowledgements
The authors would like to acknowledge the contribution of Ilias Hani who help carry out some of the field data collection. Authors thank Dr André St-Hilaire for valuable comments on the manuscript and two anonymous reviewers and Dr Adam J. Terando for valuable comments and for their review of the manuscript.
Disclosure statement
No potential conflict of interest was reported by the authors.
References
- Ahmadi-Nedushan, B., et al., 2007. Predicting river water temperature using stochastic models: case study of the Moisie River (Québec, Canada). Hydrological Processes, 21, 21–34. doi:10.1002/hyp.6353
- Benyahya, L., et al. 2014. Workshop on the development & implementation of a water temperature monitoring network for Atlantic Salmon (Salmo salar) rivers in eastern Canada held in Quebec City, Quebec, 22-23 January 2014: abstracts and proceedings. Canadian Manuscript Report of Fisheries and Aquatic Sciences, 3045, vi + 14p.
- Brown, G.W., 1969. Predicting temperatures of small streams. Water Resources Research, 5 (1), 68–75. doi:10.1029/WR005i001p00068
- Caissie, D., Thistle, M.E., and Benyahya, L., 2016. River temperature forecasting: case study for little Southwest Miramichi River (New Brunswick, Canada). Hydrological Sciences Journal, 62 (5), 683–697. doi:10.1080/02626667.2016.1261144
- Cluis, D.A., 1972. Relationship between stream water temperature and ambient air temperature A simple autoregressive model for mean daily stream water temperature fluctuations. Nordic Hydrology, 3 (2), 65–71. doi:10.2166/nh.1972.0004
- Dunham, J., et al., 2005. Measuring stream temperature with digital data sensors: A user’s guide. Gen. Tech. Rep. RMRSGTR-150WWW. Fort Collins, CO: U.S. Department of Agriculture, Forest Service, Rocky Mountain Research Station, 15 p.
- Hebert, C., et al., 2011. Study of stream temperature dynamics and corresponding heat fluxes within Miramichi River catchments (New Brunswick, Canada). Hydrological Processes, 25, 2439–2455. doi:10.1002/hyp.v25.15
- Isaak, D.J. and Horan, D.L., 2011. An evaluation of underwater epoxies to permanently install temperature sensors in mountain streams. North American Journal of Fisheries Management, 31, 134–137. doi:10.1080/02755947.2011.561172
- Johnson, M.F. and Wilby, R.L., 2013. Shield or not to shield: effects of solar radiation on water temperature sensor accuracy. Water, 5, 1622–1637. doi:10.3390/w5041622
- Morin, G. and Couillard, D., 1990. Predicting river temperatures with a hydrological model, Chapter 5. Encyclopedia of Fluid Mechanic, Surface and Groundwater Flow Phenomena,Gulf Publishing Company, Houston, Texas, 10, 171–209.
- Pilgrim, J.M., Fang, X., and Stefan, H.G., 1998. Stream temperature correlations with air temperature in Minnesota: implications for climatic warming. Journal of the American Water Resources Association, 34 (5), 1109–1121. doi:10.1111/j.1752-1688.1998.tb04158.x
- R Development Core Team (version 3.4.0), 2017. R: a language and environment for statistical computing. Vienna, Austria: R Foundation for Statistical Computing, ISBN 3-900051-07-0.
- Sinokrot, B.A. and Stefan, H.G., 1993. Stream temperature dynamics: measurements and modeling. Water Resources Research, 29 (7), 2299–2312. doi:10.1029/93WR00540
- Terando, A.J., et al., 2017. Ad hoc instrumentation methods in ecological studies produce highly biased temperature measurements. Ecology and Evolution, 7, 9890–9904. doi:10.1002/ece3.3499
- U.S. Environmental Protection Agency (EPA), 2014. Best practices for continuous monitoring of temperature and flow in wadeable streams. Washington, DC: Global Change Research Program, National Center for Environmental Assessment. EPA/600/R-13/170F.
- Webb, B.W., et al., 2008. Recent advances in stream and river temperature research. Hydrological Processes, 22, 902–918. doi:10.1002/(ISSN)1099-1085