
 ?Mathematical formulae have been encoded as MathML and are displayed in this HTML version using MathJax in order to improve their display. Uncheck the box to turn MathJax off. This feature requires Javascript. Click on a formula to zoom.
ABSTRACT
Severe urban floods have frequently caused social and financial infrastructure problems due to a lack of hydraulic capacity of urban drainage systems or the structural failure of network elements. Conventional, reliability-based design methods of drainage networks only provide acceptable performance under expected conditions of loading. In this study, a new approach based on resilience is proposed for the rehabilitation of urban drainage systems; this approach is able to maintain a predefined service level under both external and unexpected internal loads, including different scenarios of blockage and a severe rainfall event. The performance of different design methods: resilient, non-resilient, deterministic and uncertain models, is comprehensively compared and the most appropriate approaches are introduced. The results show that the new resilient approach outperforms conventional design/rehabilitation methods in terms of flood volume reduction. Additionally, the single blockage scheme and the Poisson distribution-based model show the best performance to enhance the resilience of the network.
Editor A. CastellarinAssociate editor B. Dewals
Introduction
Severe floods have been increasing in urban areas in recent years due to the growth of global urbanization and climate change. These events may cause improper function of urban stormwater drainage systems (USDSs) (Perez-Pedini et al. Citation2005, Yazdi and Kim Citation2015). Heavy rainfall accompanied by unexpected and inappropriate operation of the hydraulic structures of USDS, such as trash racks, sediment control structures, bridges and culverts, can lead to an increased possibility of blockage in drainage networks. In particular, bottlenecks – due to considerable contraction of drain cross-section area – are critical elements in the drainage network, having a high risk of causing blockages. A bottleneck blockage is an important factor in increased urban flooding. Thus, it is necessary to employ a proper USDS design/rehabilitation approach that can consider the network’s ability to recover from conditions of failure (e.g. a bottleneck blockage).
Several studies have been performed to enhance USDS operation under uncertainties and abnormal conditions. Sun et al. (Citation2011) reported that risk-based design/rehabilitation methods may attain a better performance than conventional approaches assuming a specific design return period. They developed a risk-based optimization framework to simulate the sewerage network under multiple design storms. Karamouz and Nazif (Citation2013) studied climate change impacts on rainfall and temperature patterns. They optimized best management practices (BMPs) under climate change conditions using a general circulation model (GCM) and downscaling techniques in an urban catchment. Woodward et al. (Citation2014) obtained the best mitigating strategies in a flood protection system using a multi-objective optimization algorithm and considering expected annual damage (EAD). Vojinovic et al. (Citation2014) emphasized the inspection and maintenance of the assets such as storage units, pipes and manholes, in order to sustain appropriate operation of a drainage network. Using a genetic algorithm (GA) and through a risk-based approach, they developed a multi-objective optimization framework for minimizing rehabilitation costs and expected damages. The effects of dependent structure of rainfall variables on a USDS operation were evaluated by Fu and Butler (Citation2014) using a copula-based Monte Carlo simulation. Yazdi and Kim (Citation2015) developed a copula-based coupled numerical and optimization framework to rehabilitate USDSs under rainfall uncertainties by using a joint cumulative distribution function of rainfall variables. Duan et al. (Citation2016) described a number of different uncertain parameters influencing the design of USDSs to optimize the dimensions of storage units using multi-objective particle swarm optimization (MOPSO) and the Environmental Protection Agency – Stormwater Management Model (EPA-SWMM). Mohammadiun et al. (Citation2018) developed a coupled numerical and optimization model to rehabilitate USDSs with a resilient method considering the uncertainty of rainfall parameters. They considered the effects of bottleneck blockage on the performance of a USDS through a Monte Carlo simulation-based method. A specific meta-model, reducing the accuracy of the simulation process and the efficiency of optimal solutions, was developed in this study due to the requirement of significantly high computation time in their approach. Yazdi (Citation2018) developed a probabilistic framework based on Monte Carlo simulation in order to improve the resilience of USDSs. His model required considerable computation time and did not compare the quality of the results with simpler more straightforward methods.
Assuming different quantifying indices, such as failure duration and magnitude, the application of coupled models and a resilient design approach have been addressed in the field of water distribution systems and wastewater treatments (Xu and Goulter Citation1999, Mugume et al. Citation2015a, Sweetapple et al. Citation2017, Butler et al. Citation2017, Juan-Garcia et al. Citation2017, Alizadeh et al. Citation2019). The concept of resilience has been also introduced as an essential requirement in USDS design/rehabilitation by numerous researchers. Blackmore and Plant (Citation2008) stated that, despite the assumptions of conventional methods, unpredictability is an intrinsic property of an urban drainage system and interconnected components play an important role in the performance of these networks. They introduced resilience-based design methods as an appropriate alternative for common risk assessment approaches for drainage network design or rehabilitation. Yazdandoost et al. (Citation2013) and Tahmasebi Birgani and Yazdandoost (Citation2013) selected total time of nodal flooding as an index of the recovery capacity of a system. They presented optimal application of BMPs in a drainage network by using objective functions of nodal flooding time, flooding volume and total suspended solids. Zahmatkesh (Citation2014) provided a local and coastal flooding simulation framework to propose effective patterns of developing resilient cities. She concluded that application of the resilient approach led to reduced urban flood risk. Mugume et al. (Citation2015b) evaluated the structural resilience of an urban drainage system using an approach based on consecutive failure of the system components. Although they suggested a suitable resilience definition for USDSs, they did not present any design/rehabilitation framework. They evaluated cumulative failure scenarios in a sewer network using the global resilient approach analysis. Karamouz and Zahmatkesh (Citation2016) defined resilience as the system capacity to retain a level of service during flooding. They utilized a multi-criteria decision-making technique to determine effective social factors on flood resilience in coastal cities. Mugume and Butler (Citation2016) introduced a resilience index considering the effects of flood duration and magnitude to design a USDS under a wide range of extreme rainfalls. Mugume et al. (Citation2017) used a number of rainwater-harvesting strategies to enhance the structural resilience of urban drainage systems subjected to cumulative failure scenarios.
To sum up, most of the previous studies conducted on USDSs only focus on the hydraulic reliability of the network to provide the required capacity. A limited number of studies evaluate structural resilience but do not propose any resilience-based design/rehabilitation approach for USDSs. The design/rehabilitation of USDSs in order to retain a predefined performance level during and after a range of unexpected accidents, such as bottleneck blockages or/and assets collapse, is of great importance. Moreover, the application of some previously developed methods, considering the effects of blockage on a network, not only requires considerable computation time but may also result in reduced accuracy and efficiency of the results. Thus, the main purpose of this study is to develop a straightforward numerical and optimization framework to design/rehabilitate USDSs using a resilient approach which does not reduce the accuracy and efficiency of optimal strategies. Also, the performance of all previously developed models and the models suggested in this study are comprehensively compared, and the most efficient models are introduced. Moreover, a comprehensive, quantitative evaluation of resilience, enhanced by the application of bypass lines, is presented in this paper. In this direction, the eastern part of the Tehran Stormwater Drainage System (TSDS) in Iran (TETCO V4(2) Citation2011) was selected as a challenging case study. This drainage network suffers from a significant lack of hydraulic capacity and has a number of critical bottlenecks which are highly susceptible to blockage. To select an appropriate and efficient resilient design/rehabilitation framework, a wide range of blockage scenarios is evaluated in this study.
Resilience
Resilient design/rehabilitation of USDSs plays an important role in the minimization of expected flood damages (Mugume et al. Citation2015a). Mugume et al. (Citation2015a) proposed “Safe-Fail Approach” framework as a resilient and sustainable way for flood mitigation. Initially, resilience was defined as the ability of an object under a specific force to return into its original shape or location (Zahmatkesh Citation2014). Different descriptions of resilience may be found in the literature (e.g. Holling Citation1973, Mileti Citation1999, Adger et al. Citation2005, Folke Citation2006, Manyena Citation2006, Mugume et al. Citation2015b), but considering the quantitative aspects of this research, resilience is assumed here as the minimization amount of failure aspects of an urban network under unpredictable external and internal loads. Unpredictable loading conditions are considered as the internal loading of the system with random probability patterns, such as malfunctions of certain components of the urban drainage networks. It is worth mentioning that reliability-based conventional design methods only consider the ability of the system to minimize the frequency of service-level failure during normal conditions of loading (e.g. a predefined rainfall event). So, in this approach, reliability is the probability of successful operation of the system (non-failed state). Therefore, failure probability is minimized in a reliable drainage network, while a resilience-based approach minimizes the intensity and duration of service-level failure in order to resist failure to the greatest extent possible or return to a predefined condition in the case of failure. In other words, an appropriately resilient system can resist failure under unexpected loading and rapidly recover from a failed state when needed. In this context, various system specifications need to be assessed to provide a network with a better resilient operational condition. Among them, flexibility and redundancy are considered as the most efficient aspects of urban drainage networks: a flexible urban drainage network can attain a predefined operation level by alternating the performance of system components under different loading scenarios, while redundancy is a desired degree of substitutions that is available by considering extra components for essential parts of a system in order to recover network operations from unpredictable failure scenarios. In this study, the unexpected condition is defined as failure or blockage of specific hydraulic structures in the studied USDS, such as critical bridges and culverts.
Methodology
A coupled numerical and multi-objective optimization model is developed for minimizing “rehabilitation costs” and maximizing “system resilience” when the USDS is subjected to different scenarios of stochastic bottleneck blockages. The main stormwater drainage network of Tehran was used as a case study and a severe rainfall event selected from available records of the area under study was considered.
In this methodology, a calibrated HEC-HMS (Hydrologic Engineering Center – Hydrologic Modeling System) model (USACE Citation2010) is used to calculate related surface runoff in sub-catchments as the boundary conditions of the TSDS hydraulic model (in EPA-SWMM, Rossman Citation2015). Optimal amounts of different parameters were retrieved from Khazayi (Citation2018), who has suggested calibrated curve numbers (CN) and Manning coefficients (n) of permeable areas in the selected case study. Khazayi (Citation2018) calibrated and validated these parameters using different storms and their simultaneous hydrographs at the outlet of the eastern part of the TSDS. Subsequently, this hydraulic model is connected to a multi-objective evolutionary algorithm, referred to as non-dominated sorting differential evolution (NSDE) (Yazdi et al. Citation2016) in order to attain optimal rehabilitation strategies considering different bottleneck blockage scenarios. In this direction, logical probabilities are assigned to each blockage scenario considering the effects of upstream flow discharge/water levels and the geometric properties of bottlenecks on the blockage.
Surface runoff calculation
According to the available data, 81 sub-catchments were considered in the eastern part of Tehran urban catchment (). To estimate losses and transform excess rainfall into surface runoff, the curve number (CN) method of the Soil Conservation Service (SCS) and the SCS unit hydrograph method were applied to the HEC-HMS model. Initial abstractions, curve numbers, lag times and time intervals of each sub-catchment were obtained from available reports (TETCO V2(3) Citation2011, Khazayi Citation2018). Runoff discharging to the rivers located in the study area was modelled in SWMM through each sub-catchment. Also, all baseflows of the network were considered in the SWMM model. These baseflows were assumed as external inflows received at the related junction of the urban network.
Figure 1. The eastern part of the TSDS sub-catchments and constructed drainage network.
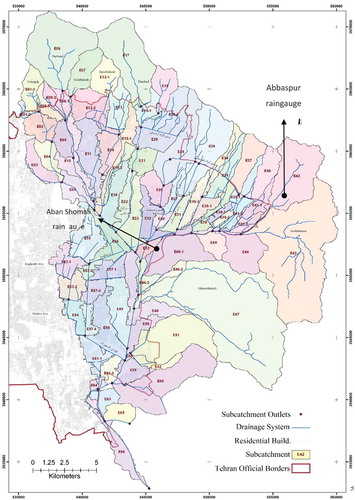
The rainfall event of 3 April 2002, the largest recorded event of the catchment, was selected as the design rainfall. A sensitivity analysis was conducted in order to compute rainfall temporal distribution based on the recorded data on 3 April 2002, at two rainfall stations, Aban Shomali and Shahid Abbaspur, located in the eastern part of the TSDS, with average elevations of 1250 and 1550 m a.s.l., respectively. The flood hydrograph of the eastern catchment was calculated for three cases using rainfall data: (a) recorded at Aban Shomali station; (b) recorded at Shahid Abbaspur station; and (c) obtained by inverse distance weighting (IDW) method using recorded data from the two stations. shows the flood hydrographs obtained at the outlet of the network. Rainfall data for the two stations produce two relatively different flood responses, where the rainfall for the first station has a higher time to peak and that of the second station generates a two-modal flood hydrograph, with a peak discharge occurring at an earlier time. The rainfall intensity recorded at Aban Shomali and Shahid Abbaspur raingauges was 4.29 and 4.14 mm/h, respectively.
Figure 2. Rainfall patterns at the catchment outlet.
The rainfall hyetograph obtained by IDW method produces an intermediate hydrograph which has the features of rainfall for both stations and therefore is selected as the design rainfall hyetograph in this study. shows the typical related temporal distribution of this rainfall hyetograph for one of the sub-catchments (E47 in ). This is a variation of cumulative depth with time obtained by IDW method and typically seen in sub-catchment E47. Therefore, the effects of both raingauge stations are considered based on the distance between them and the mentioned sub-catchment.
Figure 3. Cumulative rainfall distribution for sub-catchment E47.
Flood routing in the drainage network
Considering the one-dimensional characteristics of unsteady flow in the USDS studied, the partial differential Saint Venant equations should be solved (Equations (1) and (2)) which are a simpler derivative form of Navier–Stokes equations used in a wide range of numerical models (Huang et al. Citation2002, Mohammadiun et al. Citation2015, Citation2016). EPA-SWMM software with “dynamic wave” routing method was chosen to solve the governing equations (Chaudhry Citation2008):
where Q is the flow discharge; A represents cross-section area of the channel; and g, So, Sf and t are the gravitational acceleration, channel slope, energy grade line and time, respectively.
Optimization approach
The present problem has a substantially large search space, which is required for meta-heuristic optimization approaches, and it also deals with a considerably large case study. In order to optimize rehabilitation strategies according to conflicting objective functions of rehabilitation costs and resilience, the NSDE meta-heuristic algorithm was utilized. First, due to computational limitations, critical bottlenecks of the TSDS were determined based on field surveys and primary numerical modelling of the drainage network.
Then, in the first blockage modelling approach, the network bottlenecks are ranked according to the volume of flooding in each bottleneck (resulting from the blockage) and the entrance flow velocity. After that, the blockage probability of each critical bottleneck is estimated for three cases: (a) separate blockage of bottlenecks; (b) cumulative blockage of all challenging bottlenecks; and (c) selective blockage of the three most critical bottlenecks. Also, in the second blockage modelling approach, the probabilistic nature of the blockage based on the average number of failure events in the network is considered. In this method, the expected number of blockages is estimated using the Poisson probability distribution function and the blockage probability of each bottleneck. The Poisson distribution can be used to consider the effects of the number of events in a specific time interval on simulation of a probabilistic process. Following that, by multiplying these probabilities with their related flood volume on the network, scaled flooding, referred to here as stochastic flooding, can be calculated. Eventually, maximization of the network resilience is obtained through minimization of stochastic flooding by applying relief tunnels, storage units and bypass lines. It should be mentioned that the relief tunnels are considered as buried tunnels providing additional hydraulic capacity for the network at predefined locations, and bypass lines are used in order to provide reliable capacity near the bottlenecks, in case of blockage.
First blockage modelling approach
Here, the mathematical form of the multi-objective optimization problem can be formulated as:
Subject to:
In Equations (3–11), Costi (US$) is the construction unit cost of candidate solution members depending on concrete pipe sizes, presented in , where circular and rectangular shapes are considered for sections of pipes and bypass lines; Le (m) and n are assumed as the length and number of tunnels, respectively; Costj (US$) is the construction unit cost for storage detentions used in order to reduce the peak volume of overflow (Equation (12)); (m3/s),
(m3/s), and
(s) are, respectively, the calculated flooding discharge of the network, the maximum discharge capacity of the network and the duration of flooding, for the kth bottleneck and the bth blockage scheme among the three schemes of the first blockage modelling approach, including single (b = 1), cumulative (b = 2) and selective (b = 3) blockages with nb= 8, 8 and 7 (number of assumed blockages in each scheme), respectively. The blockage combination of the three most critical bottlenecks is considered in the selected blockage scheme considering the single and simultaneous blockages of the mentioned bottlenecks. The values of
and
are obtained by flood routing in the USDS using the EPA-SWMM model. Also,
and
are weighting coefficients used to control the effects of failure magnitude (flooding volume) and failure duration/recovery time (flooding duration) on the resilience index, respectively. Volj (m3) and m are the volume of the jth storage unit and the total number of them, respectively; and Pk,b, calculated as explained in the Case study section, represents the blockage probability of the kth bottleneck in the bth blockage scheme. Moreover, v, vmax, dim, w, hb, Ar and hs are water, respectively, the velocity in the studied USDS, the maximum allowable velocity of water, the pipe diameter in the case of circular tunnels, the width in the case of rectangular tunnels, the height of rectangular tunnels, the area of storage detention and the depth of storage detention, respectively.
Table 1. Commercial pipe sizes and associated costs (TETCO V11 Citation2011).
It should be noted that, in addition to the 18 discrete sets of dimensions considered for pipes, bypass lines and storage units, the zero value may be attributed to these strategies in the case of there being no implementation through the optimization process. The dimensions of the storage units are assumed based on the available spaces in the study area (TETCO V6(1) Citation2011).
The unit cost of the storage detentions, (US$), in the TSDS is calculated based on available reports (TETCO V11 Citation2011):
It is worth mentioning that, with an increase in w1 and a decrease in w2, the role of an acute flood (a flood with a greater magnitude and shorter duration) becomes more important. Conversely, larger w2 and lower w1 leads to an increase in the effects on the resilience index of chronic floods (floods with lower magnitude and longer duration). By assuming w1 = w2 = 1 in this work, the flood duration and magnitude have the same contribution to the resilience of the network and Equation (4) may be simplified as:
where (m3) is the detected flooding in the drainage network for the kth blockage in the bth blockage scheme and Function2 (m3) is considered as the stochastic flooding volume.
Second blockage modelling approach
In this approach, the only difference is the calculation of the second objective function. To this end, a considerable number of blockage scenarios, generated by sampling from the Poisson distribution function, is used to evaluate the second objective function. The average amount of flooding volume of these blockage scenarios is reported as the second objective function of the blockage modelling approach.
Non-dominated sorting differential evolution (NSDE)
Following previous research on the application of a meta-heuristic optimization algorithm in real-world design/rehabilitation problems, differential evolution (DE) was found to be an appropriate and robust optimization tool in the field of USDS rehabilitation. (Yazdi et al. Citation2015a, Citation2015b, Citation2016). To solve the above optimization problem, an extended version of DE (i.e. NSDE) is used here (Yazdi et al. Citation2016). Although DE and GA have similar operators, the former uses its own effective mutation and cross-over procedure. According to both convergence and diversity criteria, NSDE is introduced as one of the best multi-objective evolutionary algorithms (MOEAs) applied to USDSs (Yazdi et al. Citation2016). The different parameters of the NSDE are set as in the previous research works (e.g. Yazdi et al. Citation2016), taking into account the available computational capacity as summarized in .
Table 2. Parameter settings of NSDE.
Coupled framework
The main steps of the coupled numerical and multi-objective optimization model in the case of the first blockage modelling approach are illustrated in .
Figure 4. Optimization and simulation framework of this study in the first blockage approach.
As seen in , first, an initial population of candidate solutions is randomly generated (Step 1). Next, the first objective function i.e. rehabilitation cost is calculated using Equation (3) (Step 2). Following that, the EPA-SWWM model of TSDS is executed based on the activated blockage scheme, comprised of single, cumulative and selective blockages, and the rehabilitation priorities of each bottleneck. Considering the blockage probabilities attributed to each bottleneck in this step, the objective function of the stochastic flooding volume is computed (Step 3). Then, individuals in the population are ranked using the objective function values, calculated in steps 2 and 3 based on non-domination and crowding distance (Deb et al. Citation2002), in Step 4. Subsequently, a new population is generated using mutation and cross-over operators (Step 5). Then, the two objective functions are evaluated similar to the second and third steps (steps 6 and 7). Next, the previous and new populations are merged to create a unified population (Step 8). To achieve an updated population with initial size, the worst solutions are eliminated after sorting the recent population based on non-domination and crowding distance criteria (Step 9). Finally, steps 5–10 are repeated until the stopping criterion is met, which is a predefined number of iterations (Step 10).
For the second blockage modelling approach, all steps are similar, except for the central part related to blockage schemes. Here, the variation in water elevation is calculated at the upstream node of each bottleneck using the EPA-SWMM for the base condition (being a model with no rehabilitation strategies). Subsequently, a reasonable amount of blockage probability is assigned to each bottleneck based on its variation in water elevation using an assumed function (defined in the next section). Then, the number of expected blockages in the system is determined by sampling from an assumed Poisson distribution. The mentioned probabilities are used to select candidate bottlenecks for blockage through the application of a selection method, such as roulette wheel selection. After that, the second objective function is calculated for each blockage scenario generated by sampling from the Poisson distribution. This calculation is performed for a specific number of samples, assumed here as 50, separately. The average amount of second objective functions on different samples is reported as the second objective function in this approach.
Case study
The eastern part of the USDS of Tehran city, Iran, is selected here as a case study. This network suffers from lack of hydraulic capacity and has several critical bottlenecks that are susceptible to blockage (TETCO V6(1) Citation2011). The severe rainfall even of 3 April 2002, which was one of the most severe rainfalls in Tehran, is selected as the design rainfall. Based on field surveys (TETCO V11 Citation2011), several bridges in the eastern part of the TSDS were identified as critical bottlenecks that are more susceptible to blockage. Dividing the Tehran main drainage network into four sub-drainage systems of Eastern, Western, Central and Chitgar catchments is justified due to the separate system outlets and topographic conditions. The biggest part of the TSDS is the Eastern catchment, with an area of approx. 202 km2; this catchment has a serious lack of sufficient hydraulic capacity. Additionally, about 205 km of main drainage channels have been constructed in this catchment which are selected here as the case study (TETCO V2(3) Citation2011).
A wide variety of cross-sections consisting of circular, open/closed rectangular, arch, catenary and modified basket-handle channels has been detected in the selected case study. Previous studies conducted on the TSDS introduced a combination of relief tunnels and storage units as an appropriate solution to compensate for the hydraulic deficiency of this network (TETCO V6(1) Citation2011). This mitigating strategy dictated a construction work of approximately 7.5 km of relief tunnels and seven storage units (with a total storage volume of approx. 865453 m3) in specific locations determined by feasibility studies (TETCO V6(1) Citation2011). In this study, to achieve more effective strategies, five additional relief tunnels are added to the candidate interventions located in downstream regions of the network that are more vulnerable to flooding. According to primary hydraulic modelling of the TSDS with the EPA-SWMM software, as well as field observations (TETCO V11 Citation2011), the eastern part of this drainage system includes eight critical bottlenecks which are heavily susceptible to blockage due to the contraction of the cross-section area. For the determination of blockage priorities in the first blockage modelling approach, these critical culverts were ranked for rehabilitation based on local upstream velocity and nodal flood volume resulting from an artificial blockage applied to each bottleneck separately. The former considers the effects of the reduction in cross-section area as well as an upstream discharge for each critical culvert, while the latter takes into account the severity of blockage consequences. Weighting coefficients of 0.55 and 0.45 were subjectively allocated to the velocity and nodal flood volume indices, respectively, to determine the final rehabilitation priority ranking.
presents upstream flow discharge under design rainfall, culvert dimensions, the percentage of reduction in cross-section area relative to the upstream channel, maximum upstream flow velocity under design rainfall, volume of local flooding in the upstream node in the case of bottleneck blockages and associated rankings of the culverts for rehabilitation.
Table 3. Specifications and ranking of each bottleneck in the eastern part of the TSDS. The location of each critical bottleneck is shown in .
Figure 5. The eastern part of the TSDS hydraulic model (Mohammadiun et al. Citation2018).
A hydraulic model of the TSDS was set up according to information available in reports (TETCO V11 Citation2011) and from field observations. Relief tunnels, storage units and bypass lines (used in the bottleneck locations) are illustrated in . For this modelling, geographical data, the type and dimensions of channels, channel lengths, channel slopes, etc. were obtained from the reports and considered in the numerical model. The model parameters were set as the calibrated values reported by Tehran Stormwater Management Master Plan (TETCO V11 Citation2011).
A total of 17 relief tunnels (labeled T1–T17) and seven storage units (S1–S7) was used to compensate for the hydraulic deficiency, as illustrated in . Critical bottlenecks of the network (labeled C1–C8) are also shown in . Two separate bypass lines with circular-shape pipes, connected to the upstream of culverts using two orifices, were considered in the vicinity of each critical bottleneck. Not only does the consideration of two bypass lines for each bottleneck provide a better redundancy, improving the resiliency of the system, but this layout can provide sufficient capacity to safely divert stormwater into the downstream of each bottleneck with respect to conditions of the selected case study and available sizes of pipes. It should be mentioned that different rehabilitation strategies were evaluated through the optimization process, including the application of one or/and two bypass lines or even the elimination of these tunnels in some strategies (i.e. no bypass lines).
The coupled model was developed in such a way that mentioned orifices will be opened when the bottleneck is blocked and, thus, the bypass lines are activated. Therefore, when a critical bottleneck is blocked, the related bypass line(s) will divert the flood discharge to the downstream of that culvert and provide the network with a structurally resilient capacity. In addition, a flap gate was used at the end of each bypass line to prevent backflow in the case of no implementation of bypass lines in hydraulic model. It should also be mentioned that there is no additional flooding generated by bypass lines and they are just used to change the path of flood conveyance locally in the case of blockage. Bypass lines provide safe lines of flood conveyance in bottlenecks. Furthermore, the combined effects of bypass lines on flooding at the upstream and downstream of bottlenecks are considered by the simulation model and are taken into account in the second objective function. Thus, inappropriate rehabilitation strategies are neglected through the optimization process.
Overall, 40 decision variables comprised of 17 relief tunnels, seven storage units and 16 bypass lines (two sets for each critical bottleneck) were considered in this study. Each decision variable can individually take 19 different values. Therefore, the size of search space, i.e. the number of all possible solutions in the optimization problem is 1940 = 1.41301 × 10+51, which can be considered as a real-world, large-sized optimization problem.
In this study, by assuming blockage schemes as independent variables, the blockage probabilities, , of each bottleneck (k = 1 to 8) in a single blockage scheme (b = 1) were set to
. Under this scheme, each bottleneck blockage is considered independent of the other bottlenecks.
For the cumulative blockage scheme (b = 2), blockage probabilities are allocated using Equation (14). In this scheme, all critical bottlenecks are blocked cumulatively in order of their rehabilitation priority ranking:
where k represents the rank of each critical bottleneck (, last column) and varies from 1 to 8.
Finally, for the selective blockage scheme (b = 3), all seven combinations of the three most critical bottleneck blockages (k = 1, 2, 3, 1 + 2, 1 + 3, 2 + 3, 1 + 2 + 3) are considered. Under this scheme, the blockage probabilities are computed by Equation (15). It should be mentioned that considering simultaneous blockage combinations of more than three critical bottlenecks does not have any considerable effect on the stochastic flood index (due to the small amount of related blockage probabilities). It also requires large computational time which is not practically possible. For example, in the case of four simultaneous bottleneck blockages, the related probability is 0.0027 and 15 different blockage combinations need to be considered for only one objective function evaluation, so the computational burden is great. To avoid this difficulty, the three most critical bottlenecks were selected according to the rehabilitation priorities, thus demanding less than half of the computational effort of the four-bottleneck blockage case.
In Equation (15), k= 1 + 2 + 3 means that the first, second and third critical bottlenecks (see ) are blocked simultaneously.
It should be noted that, in each of the three schemes described above, the summation of probabilities for all blockages is equal to 1 , where nb is the total number of blockages, assumed as eight for the single and cumulative schemes and seven for the selective scheme).
To determine the probabilities required in the second blockage modelling approach, Equation (16) is used. This equation is introduced based on the proposed fragility curves of levees (Hui et al. Citation2016):
where Dk is the height of the kth bottleneck; Hk(t) considers the variation of water elevation with time upstream of the kth bottleneck; and is a weighting coefficient to control the effect of depth variation on the assigned probability, which is subjectively assumed as 100 in this study.
As mentioned above, in order to determine the required number of blockages (x) in the second blockage modelling approach, the Poisson distribution is used, as follows:
where λ is the “event rate” considering the average number of blockages during the return period of a design rainfall, λ = 2 and λ = 3 in this study, with the coupled models being run for each value separately; and is the probability of x blockages with an event rate of
.
After determination of the number of blockages for each sample, bottlenecks were selected using the roulette wheel selection method based on the blockage probability of each bottleneck (Pk). In the roulette wheel method, bottlenecks with larger probabilities have a higher chance of selection.
Results and discussion
Different structural failure scenarios were considered through the optimization process to investigate the resilience of different rehabilitation strategies. In order to compare the results of the resilient approach with a traditional method (the non-resilient approach), the Pareto front of each method was determined separately. shows a Pareto front of a traditional method (with minimization of flood volume and related costs) for the rainfall event of 3 April 2002 ()), as well as a Pareto front obtained by the resilient approach of cumulative blockage ()), which is the most severe loading condition. Variations in the two conflicting objective functions of “rehabilitation cost” and “stochastic/normal flooding” are observable in . These Pareto fronts may provide decision-makers with valuable information for selecting suitable rehabilitation strategies based on desirable performance level and available budget under various loading conditions.
Figure 6. Pareto fronts obtained by (a) a resilient approach and (b) a non-resilient approach.
Flooding in the non-resilient approach and stochastic flooding in the resilient approach show similar variation ranges. It should be noted that, as the number of simultaneous blockages of critical bottlenecks increases, the amount of attributed probabilities decreases. Comparison of resilient and non-resilient approaches under the same loading condition is shown at the end of this section.
The characteristics of four selected optimal plans, shown using four squares on the related Pareto front ()), are depicted in for a cumulative blockage scheme. While the amount of stochastic flooding increases from Plan 1 to Plan 4, the rehabilitation costs decrease. In other words, the best resilience is attributed to the first plan and the last one is the worst strategy in terms of the resilience.
Table 4. Selected optimal plans of the cumulative blockage scheme. D: diameter (m) for circular tunnel; H: height (m) for rectangular tunnel/storage unit; W: width (m) of rectangular tunnel; V: volume (m3) of storage unit; S: sensitivity ranking of the plan (explained at the end of the section). R and L: right- and left-hand side of each bottleneck, respectively (looking downstream).
Different structural failures and their related probabilities considered in this research cover a wide range of unexpected loadings, which may occur in the eastern part of the TSDS.
Also, evaluation of other schemes provides similar trends and shows that cumulative and selective blockage schemes impose greater rehabilitation costs to attain a highly desirable performance level (e.g. first plans); this is attributable to the more severe loading conditions considered in these schemes. Simultaneous blockage of more, or all, of the critical bottlenecks resulted in a severe amount of flooding in the network in the case of cumulative and selective blockage schemes. shows that the application of rehabilitation strategies led to a significant reduction of flooding in the network. Considering the high performance of bypass lines in the case of blockages, most of the rehabilitation plans with lower amount of floods (plans 1–3) used at least one of the bypass lines for critical bottlenecks. In addition, due to the huge amount of upstream flow received by critical bottleneck C1, the relief tunnel T5, with small relative length and consequently a small amount of construction and maintenance costs, was implemented in all optimal plans. Besides, a reduction in the mentioned tunnel size may lead to increased diameters of the related bypass lines. Moreover, all medium- and low-flooding plans (e.g. plans 1–3) retain an appropriate connection of the eastern part of the network with the downstream by activating a combination of relief tunnels (T11–T13).
According to Equation (14), in the cumulative blockage scheme, three most critical bottlenecks play an important role in the calculation of stochastic flooding and the effects of a higher number of simultaneous blockages are not considerable. Therefore, larger diameters of bypass lines were assigned to critical bottlenecks C8, C4 and C1. It should be mentioned that considering the short length of C3, which may lead to a lower amount of rehabilitation costs, the bypass lines of this culvert required a larger diameter. Additionally, in the selective blockage scheme, different combinations of C8, C4 and C1 blockages were considered and bypass lines with large diameters were assigned to these critical bottlenecks, too.
Furthermore, a sensitivity analysis was carried out on the relative importance of actions in the best rehabilitation strategy in terms of the resilience (Plan 1) from the Pareto front of the cumulative scheme. The ranking obtained by this analysis is also presented in . According to the ranking, the most sensitive bypass lines of this optimal solution are those used for the most critical bottleneck, C8, and next, the second critical bottleneck, C4; however, there is no significant sensitivity to the other bypass lines. This observation can be related to low blockage probabilities attributed to three and more simultaneous blockages of critical bottlenecks based on assumed rehabilitation priorities (). Besides, detention reservoirs generally show an appropriate function due to a significant reduction in the required relief tunnel length by reducing the peak flood discharge. Meanwhile, detention reservoir S7, as an off-line storage unit that receives a huge amount of inflow from upland areas, is ranked third. Moreover, as mentioned above, relief tunnels T12 and T13 provide the eastern part of the network with a desirable connection to the downstream areas and are, therefore, also important components for flood mitigation. Downstream relief tunnels (e.g. T16 and T17) dealing with huge amounts of collected runoff from the whole network should also be considered as essential elements.
To compare non-resilient and resilient design approaches and introduce the most reliable design scheme, the performance of all previous models in addition to an uncertain probabilistic model considering a wide range of return period for design rainfalls, introduced by Mohammadiun et al. (Citation2018), were compared under an identical loading condition.
To this end, 100 artificial rainfalls, considering depth and duration as two uncertain parameters, were generated using long-term records of a raingauge station located in the study area. For this purpose, the Monte Carlo simulation method was used, along with the application of copula functions based on the approach introduced in Mohammadiun et al. (Citation2018). Thus, a gamma probability distribution, with shape and invert scale parameters of 2.2588 and 271.25, respectively, was used as the marginal distribution of duration, while the generalized extreme value probability distribution, with shape, scale and location parameters of 0.22105, 5.7477 and 15.486, respectively, was considered as the marginal distribution of depth. Moreover, the Frank copula function, with θ= 6.3990 was selected as the joint probability distribution function of depth and duration. Also, the intensity–duration–frequency (IDF) equation for Tehran, considering the spatial variation of the rainfall in the city based on the elevation of each sub-catchment, was used to modify the related depth of each artificial rainfall in the different sub-catchments. The generalized IDF equation of the case study and its coefficients are described in Yazdi et al. (Citation2018). Specifications of artificial rainfalls used in this study and different sub-catchments of the eastern part of the TSDS are presented in . As can be seen, a wide range of intensity, depth, duration and return periods was used in the calculation. Considering 81 sub-catchments of the study area and 100 assumed artificial rainfalls, 8100 depths and durations of rainfall were introduced in the SWMM as the severe external loading to compare the performance of the different models.
Table 5. Specifications of artificial rainfall and sub-catchments.
In order to determine internal severe loading, 50 blockage events were generated using the Poisson distribution function with λ = 2. Based on the number of probabilistic blockages, in addition to the blockage probabilities assigned to each bottleneck by Equation (16) and the SWMM model for each artificial rainfall, specific bottlenecks were selected to be blocked by application of the roulette wheel selection method. Because 100% blockage of bottlenecks can be considered as a highly severe loading condition, a reduction of 65% of cross-section area of each culvert was assumed as the blockage event in this part of the study.
To evaluate the performance of the mentioned approaches, three different optimal plans were selected from each Pareto front obtained by coupled numerical and optimization models. The approximate rehabilitation costs of these selected plans (plans 1–3) were 1.8 × 10⁷, 1.2 × 10⁷ and 7.9 × 10⁶ US$, respectively. The total flood volume of the network, the flood volume at the upstream node of each bottleneck and the flood duration at the upstream of the bottlenecks were calculated under the aforementioned loading condition for plans 1–3 of each model. shows the average amounts of these variables for the three different plans. In order to select the best performance, the average volumes and durations for 50 × 100 different scenarios of blockages and rainfalls are also illustrated in . Based on this table, the single blockage scheme and blockage model based on sampling from Poisson distribution outperformed other approaches by a considerable reduction of total flood volume and duration.
Table 6. Average amounts of flood volume and duration for plans 1–3 at the upstream of each bottleneck with the average total volume of the network for each approach. Volume in 103 m3; duration in h.
The related results of these two approaches are also similar to each other. The uncertain model performance in the reduction of flood volume and duration at the upstream node of each bottleneck was acceptable. Moreover, the performance of the cumulative approach was better than that of the selective approach, and the Poisson distribution-based model with larger event rate (λ) outperformed that with the smaller λ due to the condition of more severe loading in the calculation of its Pareto front. Additionally, the results show the importance of a resilient design method application because, respectively, 50%, 90% and 92% reduction in total flood volume of the network, and flood volume and flood duration at the upstream of bottlenecks was achieved by a resilient approach in comparison with a non-resilient one.
To compare the performance of the methods in detail, the variation in flood volume with time at the most critical bottleneck (C8) is reported in for three resilient approaches and one non-resilient approach under three different artificial rainfalls and five blockage events.
Figure 7. Flood volume at the most critical bottleneck for the first selected plan and five blockage events under rainfall with a return period of (a) 407 years, (b) 102 years and (c) 25 years.
The previously introduced Plan 1 with an approximate rehabilitation cost of 1.8 × 10⁷ US$ was used for this purpose. As can be seen in , the largest amounts of flood volume and duration were attributed to the non-resilient approach. For example, in ), while flood duration in the non-resilient approach (conventional reliability-based method) was 12 h and 30 min, the corresponding amount in the resilient approaches was just 5 h and 30 min. Also, a reduction of 78% and 80% was achieved for total flood volume and peak flood volume, respectively, by the resilient approaches compared to the non-resilient one. Moreover, as the return periods of rainfall decreased, the flood volume decreased as well. Although there is still a lack of hydraulic capacity in the non-resilient approach under an artificial rainfall with a return period of 25 years ()), the resilient methods provide sufficient capacity under the unexpected loading condition in this rainfall.
As stated above, a resilient design method considers both sources of internal and external loading and provides a USDS with a capacity of recovering from a failure state to a predefined performance level as soon as possible. Here, bypass lines are activated in the case of a blockage and these enhance both the recovery time and the flood volume reduction in resilient models. Also, blockage probabilities and scenarios considered in the single blockage scheme and a model based on sampling from the Poisson distribution take a wider range of probable failure states into account compared to cumulative and selective schemes. Although the two first models consider the blockage effects of all bottlenecks in the calculation of the second objective function, the cumulative scheme assigns small amounts of blockage probabilities for bottlenecks with a lower critical rank of 3; the selective scheme just considers the blockage effects of the three most critical bottlenecks.
The proposed design/rehabilitation approach with the implementation of bypass lines shows extremely efficient performance and is superior with respect to the non-resilient method. Also, considering the computation time required and the acquired enhanced performance level ( and ), the single blockage scheme and a blockage model based on sampling from the Poisson distribution can be introduced as the best design approaches.
Conclusions
The conventional reliability-based design method of urban drainage networks cannot consider the effects of unexpected loading, such as structural failure of the network’s assets. A new resilience-based design approach was suggested in this study to design/rehabilitate urban drainage networks in such a way as to be able to attain a predefined service level during and after unexpected loading conditions. In this study, only the failure risk of internal elements of the urban drainage network was considered within the proposed resilient approach, and external loads such as severe uncertain rainfalls beyond the hydraulic capacity, which may simultaneously intensify the internal failure risks, were neglected in order to introduce a practical framework with reasonable required computation time. However, the performance of this method was also compared with an uncertain model, considering the effects of external severe loads. Among the evaluated approaches, the single and Poisson distribution-based blockage schemes showed the best resilient behaviour and also the application of bypass lines led to an adaptive performance of the network under unexpected loadings. Additionally, implementing a combination of relief tunnels, detention reservoirs and bypass lines using a resilient approach resulted in a reduction of approx. 90% in stochastic flooding compared to a non-resilient conventional approach. Application of the developed resilience-based framework could provide the eastern part of the TSDS with desirable adaptability to unexpected structural failure.
Disclosure statement
No potential conflict of interest was reported by the authors.
References
- Adger, W.N., et al., 2005. Social-ecological resilience to coastal disasters. Science, 309 (5737), 1036–1039. doi:10.1126/science.1112122
- Alizadeh, Z., et al., 2019. Evaluation of data driven models for pipe burst prediction in urban water distribution systems. Urban Water Journal, 16 (2), 136–145. doi:10.1080/1573062X.2019.1637004
- Blackmore, J.M. and Plant, R.A.J., 2008. Risk and resilience to enhance sustainability with application to urban water systems. Journal of Water Resources Planning and Management, 134 (3), 224–233. doi:10.1061/(ASCE)0733-9496(2008)134:3(224)
- Butler, D., et al., 2017. Reliable, resilient and sustainable water management: the safe & sure approach. Global Challenges, 1 (1), 63–77. doi:10.1002/gch2.1010
- Chaudhry, M.H., 2008. Open-channel flow. New York, NY: Springer.
- Deb, K., et al., 2002. A fast and elitist multiobjective genetic algorithm: NSGA-II. IEEE Transactions on Evolutionary Computation, 6 (2), 182–197. doi:10.1109/4235.996017
- Duan, H.-F., Li, F., and Tao, T., 2016. Multi-objective optimal design of detention tanks in the urban stormwater drainage system: uncertainty and sensitivity analysis. Water Resources Management, 30 (7), 2213–2226. doi:10.1007/s11269-016-1282-1
- Folke, C., 2006. Resilience: the emergence of a perspective for social–ecological systems analyses. Global Environmental Change, 16 (3), 253–267. doi:10.1016/j.gloenvcha.2006.04.002
- Fu, G. and Butler, D., 2014. Copula-based frequency analysis of overflow and flooding in urban drainage systems. Journal of Hydrology, 510, 49–58. doi:10.1016/j.jhydrol.2013.12.006
- Holling, C.S., 1973. Resilience and stability of ecological systems. Annual Review of Ecology and Systematics, 4, 1–23. doi:10.1146/annurev.es.04.110173.000245
- Huang, J., Weber, L.J., and Lai, Y.G., 2002. Three-dimensional numerical study of flows in open-channel junctions. Journal of Hydraulic Engineering, 128 (3), 268–280. doi:10.1061/(ASCE)0733-9429(2002)128:3(268)
- Hui, R., Jachens, E., and Lund, J., 2016. Risk-based planning analysis for a single levee. Water Resources Research, 52 (4), 2513–2528. doi:10.1002/2014WR016478
- Juan-Garcia, P., et al., 2017. Resilience theory incorporated into urban wastewater systems management. State of the art. Water Research, 115, 149–161. doi:10.1016/j.watres.2017.02.047
- Karamouz, M. and Nazif, S., 2013. Reliability-based flood management in urban watersheds considering climate change impacts. Journal of Water Resources Planning and Management, 139 (5), 520–533. doi:10.1061/(ASCE)WR.1943-5452.0000345
- Karamouz, M. and Zahmatkesh, Z., 2016. Quantifying resilience and uncertainty in coastal flooding events: framework for assessing urban vulnerability. Journal of Water Resources Planning and Management, 143 (1), 04016071.
- Khazayi, P., 2018. Optimal design of urban stormwater storage units considering uncertainties of rainfalls. M.A.Sc. Dissertation. Faculty of Civil, Water and Environmental Eng., Shahid Beheshti University.
- Manyena, S.B., 2006. The concept of resilience revisited. Disasters, 30 (4), 434–450. doi:10.1111/j.0361-3666.2006.00331.x
- Mileti, D., 1999. Disasters by design: a reassessment of natural hazards in the United States. Washington, DC: Joseph Henry Press.
- Mohammadiun, S., et al., 2015. Effects of open-channel geometry on flow pattern in a 90° junction. Iranian Journal of Science and Technology, Transactions of Civil Engineering, 39 (C2+), 559–573. doi:10.22099/IJSTC.2015.3520
- Mohammadiun, S., et al., 2016. Numerical investigation of submerged vane effects on flow pattern in a 90° junction of straight and bend open channels. Iranian Journal of Science and Technology, Transactions of Civil Engineering, 40 (4), 349–365. doi:10.1007/s40996-016-0039-7
- Mohammadiun, S., et al., 2018. Development of a stochastic framework to design/rehabilitate urban stormwater drainage systems based on a resilient approach. Urban Water Journal, 15 (2), 167–176. doi:10.1080/1573062X.2018.1424218
- Mugume, S.N. and Butler, D., 2016. Evaluation of functional resilience in urban drainage and flood management systems using a global analysis approach. Urban Water Journal, 14 (7), 727–736. doi:10.1080/1573062X.2016.1253754
- Mugume, S.N., et al., 2015a. Enhancing resilience in urban water systems for future cities. Water Science and Technology: Water Supply, 15 (6), 1343–1352.
- Mugume, S.N., et al., 2015b. A global analysis approach for investigating structural resilience in urban drainage systems. Water Resources, 81, 15–26.
- Mugume, S.N., et al., 2017. Multifunctional urban flood resilience enhancement strategies. Proceedings of the Institution of Civil Engineers - Water Management, 170 (3), 115–127. doi:10.1680/jwama.15.00078
- Perez-Pedini, C., Limbrunner, J.F., and Vogel, R.M., 2005. Optimal location of infiltration-based best management practices for storm water management. Journal of Water Resources Planning and Management, 131 (6), 441–448. doi:10.1061/(ASCE)0733-9496(2005)131:6(441)
- Rossman, L.W., 2015. Storm water management model- user’s manuel version 5.1. Cincinnati, OH: U.S. Environmental Protection Agency.
- Sun, S.A., Djordjević, S., and Khu, S.-T., 2011. A general framework for flood risk-based storm sewer network design. Urban Water Journal, 8 (1), 13–27. doi:10.1080/1573062X.2010.542819
- Sweetapple, C., Fu, G., and Butler, D., 2017. Reliable, robust, and resilient system design framework with application to wastewater-treatment plant control. Journal of Environmental Engineering, 143 (3), 04016086. doi:10.1061/(ASCE)EE.1943-7870.0001171
- Tahmasebi Birgani, Y. and Yazdandoost, F., 2013. Role of resilience in sustainable urban stormwater management. Hydraulic Structures, 1 (1), 42–50.
- TETCO (Tehran Engineering and Technical Consulting Organization) V2(3), 2011. Tehran stormwater management master plan, volume 2: basic studies, part 3: urban flood hydrology & sediment load. Tehran, Iran: Tehran Engineering and Technical Consulting Organization.
- TETCO V11, 2011. Tehran stormwater management master plan, volume 11: summary report. Tehran, Iran: Tehran Engineering and Technical Consulting Organization.
- TETCO V4(2), 2011. Tehran stormwater management master plan, volume 4: existing main drainage network, part 2: hydraulic modelling & capacity assessment. Tehran, Iran: Tehran Engineering and Technical Consulting Organization.
- TETCO V6(1), 2011. Tehran stormwater management master plan, volume 6: existing drainage system improvement, part 1: major drainage network capacity improvement & extension, and other improvements. Tehran, Iran: Tehran Engineering and Technical Consulting Organization.
- USACE (US Army Corps of Engineers), 2010. Hydrological modelling system (HEC-HMS)- user’s manual. Davis, CA: Institute for Water Resources, Hydrologic Engineering Center.
- Vojinovic, Z., et al., 2014. Multi-objective rehabilitation of urban drainage systems under uncertainties. Journal of Hydroinformatics, 16 (5), 1044. doi:10.2166/hydro.2014.223
- Woodward, M., et al., 2014. Multiobjective optimization for improved management of flood risk. Journal of Water Resources Planning and Management, 140 (2), 201–215. doi:10.1061/(ASCE)WR.1943-5452.0000295
- Xu, C. and Goulter, I.C., 1999. Reliability-based optimal design of water distribution networks. Journal of Water Resources Planning and Management, 125 (6), 352–362. doi:10.1061/(ASCE)0733-9496(1999)125:6(352)
- Yazdandoost, F., Tahmasebi Birgani, Y., and Moghadam, M., 2013. Resilient risk management strategies in urban drainage systems. Beijing: IAHR World Congress.
- Yazdi, J., 2018. Improving urban drainage systems resiliency against unexpected blockages: a probabilistic approach. Water Resources Management, 32 (14), 4561–4573. doi:10.1007/s11269-018-2069-3
- Yazdi, J. and Kim, J.H., 2015. intelligent pump operation and river diversion systems for urban storm management. Journal of Hydrologic Engineering, 20 (11), 04015031. doi:10.1061/(ASCE)HE.1943-5584.0001226
- Yazdi, J., Lee, E.H., and Kim, J.H., 2015a. Stochastic multiobjective optimization model for urban drainage network rehabilitation. Journal of Water Resources Planning and Management, 141 (8), 04014091. doi:10.1061/(ASCE)WR.1943-5452.0000491
- Yazdi, J., et al., 2018. Assessment of different MOEAs for rehabilitation evaluation of urban stormwater drainage systems – case study: Eastern catchment of Tehran. Journal of Hydro-environment Research, 21, 76–85. doi:10.1016/j.jher.2018.08.002
- Yazdi, J., et al., 2015b. Application of multi-objective evolutionary algorithms for the rehabilitation of storm sewer pipe networks. Journal of Flood Risk Management, 10 (3), 326–338. doi:10.1111/jfr3.12143
- Yazdi, J., Yoo, D.G., and Kim, J.H., 2016. Comparative study of multi-objective evolutionary algorithms for hydraulic rehabilitation of urban drainage networks. Urban Water Journal, 14 (5), 483–492. doi:10.1080/1573062X.2016.1223319
- Zahmatkesh, Z., 2014. An algorithm for assessment of flood adaptability and resiliency in coastal cities. Ph.D. Thesis. College of Engineering, University of Tehran.