
ABSTRACT
Public participation in engineering projects has been minimal to date, whereas it is growing in other fields. This paper assesses the lessons learned from public participation in two hydrologic engineering projects, as citizen scientists or through participatory mapping. The two projects were conducted in communities that faced a common problem of flooding due to sea-level rise. The lessons learned include the need to invest time at the beginning of a project to get an idea of what knowledge the public can contribute and have a plan in place to sustain participation at the level needed for the project to be successful. Our cost comparison shows that public participation should be encouraged when the project area is large enough to make travel for data collection cost prohibitive, or when extensive interaction with the public will already be required.
Editor S. Archfield Guest editor F. Nardi
1 Introduction
Engaging the public in research is a practice that has been occurring for centuries (Silvertown Citation2009). The roles that citizens have taken as a part of research teams have varied from collecting data to being engaged from project creation (Buytaert et al. Citation2014). Advances in technology have resulted in increased public participation in data collection for projects in fields including ecology, geography, human health, astronomy, and hydrology (Bonney et al. Citation2014). Volunteers having the potential to collect data at higher resolution and larger scales at reduced costs compared to researchers has increased the number of projects with public participation. In hydrology, the public has been responsible for monitoring water quality (e.g., HydroCrowd, Breuer et al. Citation2015), precipitation (e.g., SmartPhones4Water, Davids et al. Citation2019; CoCoRaHs, Cifelli et al. Citation2005), surface water levels (e.g., King Tides, California Coastal Commission Citation2018; CrowdWater, Seibert et al. Citation2019; CrowdHydrology, Lowry and Fienen Citation2013), and estimating flow rates (e.g., Flood Chasers, Le Coz et al. Citation2016). A common theme among the hydrologic-related projects that use public participation is limiting the time commitment or having the project setup where anyone with a phone or tablet can participate (Brouwer et al. Citation2018, Weeser et al. Citation2018).
Public participation in engineering has been more limited than in other fields. Searching for public participation in engineering in popular search engines, those used by the general public (e.g, Google; Bing), and academic focused (e.g., Web of Science; Google Scholar), bring up results related to environmental assessment, shaping policy, or getting public input on engineering projects. Meetings where the community has the opportunity to comment on public works projects, such as highway development, are commonplace and the literature in this area focuses on the best way to gain support for projects (Creighton Citation2005, Ng et al. Citation2012). The consulting engineers responsible for these public infrastructure projects are accustomed to keeping the community informed about a project, seeking their input through public forums, and answering their questions (Ng et al. Citation2012), but using the citizens as a part of the team to collect the needed data is rare. The literature search results suggest that this is similar among engineering researchers and consulting engineers.
Sea-level rise (SLR) is a challenge being faced by coastal communities whether they have the vast resources of a large city or are a small rural county (Hauer et al. Citation2016). The increase in flooding that is a consequence of SLR has similar outcomes in each location as it disrupts transportation, hinders economic activity, and can harm human health (Moftakhari et al. Citation2015). The projects undertaken in urban areas to combat SLR are well publicized and range from levees to parking garages that double as emergency reservoirs (Kimmelman Citation2017). These projects focus on protecting the buildings, ports, and streets that are vital to these hubs of economic activity. Less prosperous, rural communities are using similar approaches to protect the agricultural lands, hunting lodges, or vacation homes that are vital to their economic sustainability (Bhattachan et al. Citation2018). One of the best resources that the small communities have is that members of the public are willing to take action to help their community and livelihoods survive. Involving the public in engineering or other projects that affect their community can result in increased knowledge of challenges, improve social capital, and promote positive community changes (Overdevest et al. Citation2004, Yusuf et al. Citation2018).
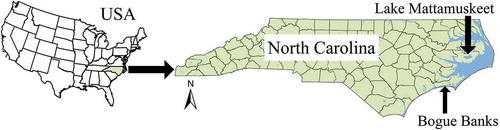
The goal of our work was to assess the use of public participation in two coastal communities, which includes the residents and officials, with low populations and limited resources that are dealing with increased flooding caused by SLR along the Atlantic coast of the United States. The first community was in the Lake Mattamuskeet watershed, in Hyde County, North Carolina (). In this location, the public assisted with mapping the watershed boundary and locations of pumps that are used to move water throughout the watershed. The second community was on the island of Bogue Banks () in Carteret County, North Carolina. In this location, we assessed the short-term use of citizen scientists for collecting groundwater and surface water levels. We hypothesized that having the public participate in the hydrologic data collection would serve as a low-cost way of collecting the data needed to begin an engineering analysis in both communities. In this paper we will present our assessment of the lessons learned, including financial benefits, from public participation in hydrologic engineering data collection.
Figure 1. Locations of Lake Mattamuskeet and Bogue Banks in eastern North Carolina, USA.
2 Public participation methods
2.1 Lake Mattamuskeet watershed
Lake Mattamuskeet is the largest natural lake in North Carolina with a surface area of over 16 000 ha. The average depth of the lake is 0.5 m and much of the lake bottom is below sea level (USFWS Citation2013). A major challenge facing Lake Mattamuskeet and the surrounding area is flooding. Water input to the lake is primarily from rainfall and surface water from the surrounding watershed (Heath Citation1975). Hurricane Joaquin in 2015 and Hurricane Matthew in 2016 both caused flooding that destroyed thousands of acres of agricultural crops and kept residents’ septic systems under water for weeks at a time (Hyde County Citation2017). Because of the challenges facing the lake, members of federal, state, and local government have worked together to develop a watershed restoration plan (NCCF Citation2018). One of the first steps in the planning process was delineating the watershed. This is typically done using topographic maps or digital elevation models. This was not the case for Lake Mattamuskeet, as human activities dating back to the 1800s have substantially altered the natural watershed boundary defined by topography (Forrest Citation1999). Currently, most of the drainage to the lake is controlled by pumps, which make agricultural production possible near the lake. Many of the fields are isolated from nearby drainage canals by large berms that serve the purpose of reducing the likelihood of flooding. The pumps were installed by private landowners and no permit was required for pump installation. The complex flow of water that follows the pumps and canals instead of the natural topography required local knowledge to map.
The anticipated outcomes of the larger project were: (a) community involvement and guidance at the beginning of the process to address challenges in the Lake Mattamuskeet ecosystem; (b) collating volunteered geographic information and evaluating potential solutions based on current knowledge of the lake ecosystem; and (c) mapping products of the Lake Mattamuskeet watershed to include the drainage pumps. For this paper, our goals were to assess the use of public participation and describe the lessons learned in using public participation to define the watershed boundary, map the pump locations, and document the pump flow rates.
We followed the steps in to complete this work. The main method that we used to define the watershed boundary and determine pump locations was participatory mapping at a public meeting. We printed an aerial photo with our estimated watershed boundary on large (35.5 cm × 48 cm) cardstock. At the meeting, we distributed the large maps with markers and asked the participants to note pump locations with an asterisk and alter the watershed boundary to include/exclude areas based on their local knowledge.
Figure 2. Flow chart showing our methods of public engagement (a) for the Lake Mattamuskeet project and (b) for the Bogue Banks project.
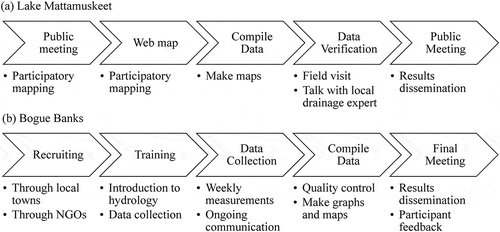
We used additional participatory mapping to increase participation. The mapping was completed both face-to-face and online. When interacting with participants face-to-face, the research team asked the citizens to map their pumps and record their pump flow rates on a tablet using ArcCollector (Esri, Redlands, CA). A link to the web map was mailed to more than 450 landowners in the watershed using county tax records to allow the public to add pump locations and flow rates. This project began with face-to-face participatory mapping in November 2016 and was followed by the public meeting in January 2017. Links to the web map were mailed to the landowners following the public meeting and again in August 2017. The participatory mapping ended in September 2017. At the end of the data collection phase, all the input gathered online, face-to-face, and at the public meeting were compiled into vector and point data files. As expected, there was conflicting information reported in the mapping of the watershed boundary. The research team resolved these discrepancies in the boundary and checked pump data through field verification, aerial photos, and talking with Hyde County’s drainage manager. The results of the data collection were presented at a public meeting in November 2017 and were used throughout the watershed restoration planning process.
2.2 Bogue Banks
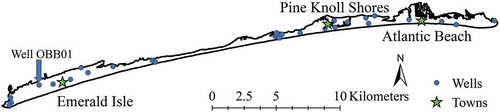
Bogue Banks is a barrier island that is separated from the mainland by Bogue Sound. There are multiple towns located on the island including Atlantic Beach, Emerald Isle, and Pine Knoll Shores (). Bogue Banks has higher relief than the area surrounding Lake Mattamuskeet with elevations ranging from 1 m below sea level to 17 m above sea level. The substantial elevation changes are due to the dunes and swales that are typical on the island.
Figure 3. Map of Bogue Banks with groundwater monitoring well and town locations.
Flooding following rainfall events is becoming a more frequent occurrence and the towns are investing in infrastructure, including pumps, to reduce the effects of flooding on their communities. Sea-level rise is likely to exacerbate the flooding issues faced on the island through both marine inundation (where previously dry land is covered by sea water) (Cooper et al. Citation2013) and groundwater inundation (where groundwater tables reach the soil surface) (Rotzoll and Fletcher Citation2013, Masterson et al. Citation2014, Manda et al. Citation2015). A next step for the communities to move forward with developing engineering solutions is to calibrate and validate a hydrologic model. Long-term time series of data are generally needed for calibrating and validating hydrologic models (Buytaert et al. Citation2014).
The objectives of the larger research project were to: (a) recruit, train, educate and engage citizen scientists to measure and record hydrologic data, (b) monitor groundwater levels and surface water levels, (c) determine the validity and reliability of hydrologic data collected by citizen scientists, and (d) evaluate the perceptions of citizen scientists participating in the project. The present paper focuses on presenting the lessons learned from using citizen scientists for collecting groundwater levels and surface water levels. Due to limited funding, only three months of data were collected during the study. We recognize this duration of data collection is generally not enough for use in models unless the dataset includes a major rainfall event (Juston et al. Citation2009). However, the results of this data collection were used to evaluate the participation of citizen scientists in collecting data for use in hydrologic models or other engineering analysis.
We followed the process outlined in to complete this project. First, we recruited citizen scientists through advertising with local non-profit organizations, putting up flyers, and through the towns’ social media beginning in January 2017. In February, the citizen scientists that volunteered to participate went through a training session where they were introduced to basic concepts of SLR, groundwater hydrology, and stormwater control measures as applicable to Bogue Banks. The session also included training on data collection procedures, how to measure groundwater levels, and how to submit data to the research team. Groundwater level measurements were made using portable water level meters and recorded on data sheets provided by the research team. Each citizen scientist was assigned at least one groundwater well and asked to measure the level at a specific time each week (e.g., 10:00 on Friday). The 29 shallow groundwater monitoring wells used in this study were installed as a part of a pilot project on Bogue Banks in 2015 (). Once problem areas for flooding were identified, stage gauges were installed in locations where the citizen scientists could read the gauges and take a picture of the water level with their phone (Royem et al. Citation2012, Lowry and Fienen Citation2013, Bruinink et al. Citation2015, Weeser et al. Citation2018). The pictures served as a way of checking the reading submitted by the citizen scientist. The groundwater data, surface water data, and pictures were submitted to the research team via the project website.
The research team began the quality control check by looking for any obvious outliers. Expected trends based on precipitation and other fluxes were taken into account during the quality control check. Following the quality control check, the research team graphed the time series data for use in project meetings.
The data collection took place from February 2017 through May 2017. The research team stayed in contact with the citizen scientists throughout the project via emails and phone calls, approximately two to three times per month, in order to answer questions and provide assistance. In addition, a mid-project meeting (March 2017) was held, during which preliminary data and challenges faced by the citizen scientists were discussed. A final project meeting (May 2017) was held after data collection was completed. Participating in the final meeting allowed the citizen scientists to return their equipment and provide feedback to the research team. In addition, the research team led a discussion of the data collected by the citizen scientists that included groundwater contour maps and relationships between rainfall events and groundwater levels. Additional information on the methods for the Bogue Banks project can be found in Grace-McCaskey et al. (Citation2019).
2.3 Alternative cost comparison
To assess whether using public participation resulted in the lowest cost for completing the data collection, an alternative cost analysis was completed for each project. For the Lake Mattamuskeet project, the alternative to the use of public participation was having a technician visit each property in the watershed to determine whether the water flowed toward the lake or another outlet. For the Bogue Banks project, the alternative to the use of public participation was using automated loggers and having a technician download the data regularly. Due to the need for long-term data collection, we assumed the project duration was increased to three years for the Bogue Banks project. The per unit labor costs, equipment cost, and travel cost were accounted for in each project. and summarize the variables included in the cost analysis for the Lake Mattamuskeet and Bogue Banks projects, respectively. The cost per hour for Principal Investigators (PI; US$91 h−1) and technicians (US$36 h−1) was the same for both projects and included benefits and indirect costs. The cost per kilometer of US$0.52 for travel included indirect costs.
Table 1. Tasks, estimated labor hours for a principal investigator (PI) and technician, and driving distance required to complete the Lake Mattamuskeet project using public participation and individual property visits.
Table 2. Tasks, estimated labor hours for a principal investigator (PI) and technician, and driving distance required to complete the Bogue Banks project using public participation and traditional groundwater monitoring methods.
3 Challenges, successes, and lessons learned
3.1 Lake Mattamuskeet
The challenges that are faced in new endeavors are often easier to identify than the successes. This was the case in the Lake Mattamuskeet project. Based on the previous experience of the research team, we expected the flow rates of the pumps to be available from the farmer or manufacturer published pump curves. However, the pumps used in the area were custom built by a local manufacturer and were sized based on pump diameter instead of flow rate. The farmers indicated that due to the customization of the pumps that the flow rates varied between pumps of the same diameter. Collecting pump location () improved our understanding of pump driven flow in the watershed, but did not provide the information that knowing flow rate would have provided. Knowing this from the beginning of the project would have altered our methods to focus on collecting pump diameter and working with the local manufacturer to test pump flow rates.
Figure 4. Map showing the results of public participation for the Lake Mattamuskeet project. It includes the pump locations and the changes in the watershed boundary during the project.
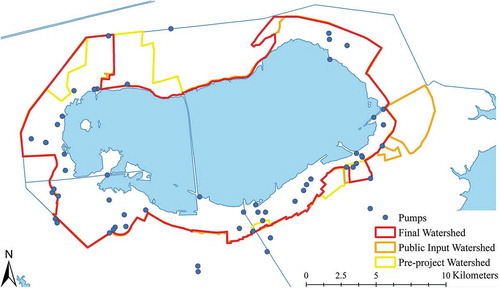
Engineers and other professionals that work with hydrology at the watershed scale are accustomed to looking at aerial images throughout a project. People that work in this field are able to identify features and locations without many details or landmarks on the image. Adding these details can make a map cluttered and other important features can be lost. Based on the small size of the land portion of the lake watershed compared to the size of the lake (), the citizens’ familiarity with the area surrounding the lake, and many of the citizens having jobs that require geographic knowledge (agriculture, hunting guide, or commercial fishing), we decided to include minimal details on the map used for the participatory mapping of pumps and the watershed. While there are relatively few roads in the watershed (), we learned that adding the road names or other landmarks would have been beneficial based on the questions asked by the participants.
Figure 5. Map showing the roads and four drainage canals in the area surrounding Lake Mattamuskeet.
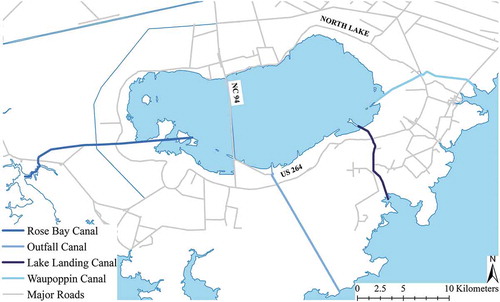
To ensure quality control we conducted field visits and discussed the results with Hyde County’s drainage manager. A portion of the watershed was adjacent to drainage districts that are often surrounded by berms to prevent surface water inflow from adjacent lands. The watershed that resulted from the participatory mapping left parcels that were not considered to be a part of the watershed or a drainage district or were considered to be a part of both. The drainage manager helped work through this conflicting information. The need to verify the citizen responses in a participatory mapping activity when used for engineering design (Bonney et al. Citation2014, Buytaert et al. Citation2014, Weeser et al. Citation2018) was reinforced by an area of farmland on the east side of the lake where the water moves from the fields towards the lake. This land was added to the watershed by the citizens (). When checking the results in the field, we found that this water never reached the lake, but instead reached a ditch that directed the water to either Lake Landing Canal or Waupoppin Canal, which drain to the Pamlico Sound ().
3.2 Bogue Banks
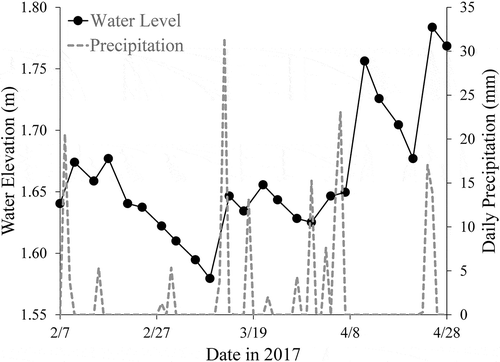
Engaging the participants in the citizen science project at Bogue Banks presented its own set of positive outcomes and challenges. We began recruiting in January 2017 and initiated the data collection in February 2017. We had 31 citizen scientists sign the informed consent forms. By the end of the project in May 2017, we had 21 citizen scientists complete the study. Of the final 21, only 12 participated in the final meeting. The citizen scientists made 510 measurements in 29 wells and eight measurements at three surface water monitoring stations over the 3-month period. An example time series of the water levels measured by a citizen scientist is shown in . It is important to note that the benefits of the Bogue Banks project went beyond the collection of groundwater and surface water levels as the citizen scientists’ knowledge of hydrologic concepts increased through participation (Grace-McCaskey et al. Citation2018).
Figure 6. Time series of water levels measured by a citizen scientist at well OBB01 during the Bogue Banks project.
The project was stopped due to a lack of funding to maintain community engagement. Had the project continued, we expected long-term participation to be a challenge as only 68% of the participants were retained in the 3-month period and only 39% participated in the final meeting. Of the 12 citizen scientists that participated in the final meeting, many expressed interest in continuing the project. They saw the value of the work and wanted to collect data during periods where there was more rainfall to improve the results. The importance of communication in public participatory research is well-known, but it is crucial in sustaining long-term data collection (Devictor et al. Citation2010, Rotman et al. Citation2014). The citizen scientists encouraged actions such as being able to view graphs of their data in real time on the project website, having the research team send them articles related to the research, and receiving a weekly email update as ways to keep them engaged in the project.
We do not know the reason that 10 participants did not complete the study. In addition to the engagement recommendations put forward by the citizen scientists at the final meeting, we think that the lack of continued participation was a combination of the required time commitment and the participants not seeing any action taken based on their results (West and Pateman Citation2016, Frensley et al. Citation2017, Hecker et al. Citation2018). A previous citizen science groundwater monitoring effort only required collection of water levels once every two months (Little et al. Citation2016) compared to the once per week in this study and it also faced the challenge of maintaining long-term participation. The reasons that Little et al. (Citation2016) found for volunteers no longer participating included moving or losing interest in the study. They noted that increased feedback from the project team about the use of the data and progress of the project were wanted by participants, which is similar to the feedback we received.
Having a motivated group of participants who are willing to engage in the research is crucial to sustaining long-term projects. Building a group that has no initial organization and increasing the social capital could turn into a long-term project if the needed structures and support are maintained (Overdevest et al. Citation2004). This is challenging within the context of many research grants and engineering projects as shown here. Hydrology projects may not have the appeal of other participatory projects and may not be as easy to accomplish as a part of someone’s normal daily routine, so we recommend focusing on a problem that already has an active group of citizens working on the issue. This should provide a group of motivated citizens that would be involved from the beginning of a project to build a collaborative or co-created project (Danielsen et al. Citation2005, Pandya Citation2012, Shirk et al. Citation2012, Hecker et al. Citation2018). Regardless of how the project is started, engagement with the community should begin during the recruitment stage and continue throughout the project. This should include using the local media and social media to promote participation in the project and provide project updates (Druschke and Seltzer Citation2012, Hecker et al. Citation2018).
As with many hydrologic monitoring efforts, the success of the research can be dependent upon the weather. From February through April of 2017, a weather station close to Bogue Banks received 15.7 cm of rainfall (NCCO Citation2018). The same weather station usually receives 28.8 cm over this same period (NWS Citation2010). The low rainfall depth prevented the citizen scientists from collecting many surface water measurements and capturing the change in groundwater level due to rainfall. Collecting measurements for a longer period of time likely would have increased the usefulness of the results, but maintaining citizen science participation would have been a challenge that would need to be overcome (Devictor et al. Citation2010, Little et al. Citation2016). The successes of other surface water monitoring projects show the potential of the public to monitor surface waters (Le Coz et al. Citation2016, Weeser et al. Citation2018, Seibert et al. Citation2019), whereas groundwater may be more of a challenge (Little et al. Citation2016).
3.3 Common themes
Identifying the factors that motivate the public to participate in the project is important for project success (Bruyere and Rappe Citation2007). Even though these two projects engaged the public in different ways, there were some common themes among them (). Many of the participants expressed their reason for participating in the projects as a desire to help their community and maintain important livelihoods. It is difficult to do a direct comparison of the amount of participation between our two studies due to the differences in the type of public participation. A quick comparison shows a difference in public interest based on the severity of the problem. Most of the flooding that took place on Bogue Banks prior to our study would be classified as nuisance flooding that resulted in little property damage. Out of the approximately 7500 permanent residents on Bogue Banks, only 31 people participated in the first meeting regarding the project. For the Lake Mattamuskeet project, 44 people attended the participatory mapping public meeting and even more participated using the web mapping tool or face-to-face in a county with a total population of less than 5600 (US Census Bureau Citation2017). The population in the Lake Mattamuskeet watershed is much lower than the total population of the county, so the participation rate was higher than the Bogue Banks project. The higher participation rate may be indicative of the public’s interest in addressing the flooding issue based on its effect on the economic sustainability of their community.
Table 3. Common themes in the Lake Mattamuskeet and Bogue Banks projects.
Due to their interest in solving these problems, their participation in the projects also came with an expectation of action that was outside the scope of the funded projects. In the Lake Mattamuskeet project, there was some skepticism about participating in the project due to a lack of action following previous studies. In this case, our project was immediately followed by a stakeholder driven and government agency funded effort to develop a watershed restoration plan. Completion of the watershed restoration plan will make the watershed eligible for grant funding to begin addressing the flooding issues. The Bogue Banks project was not followed by a similar effort to develop a plan to address the problem. Participants in that project were encouraged, by the research team, to work with town and county officials to seek funds to help solve the issues. We suggest that those leading similar public participation projects be more aware of how participants can influence local policy and get local government agencies involved in the project beyond recruitment (Little et al. Citation2016, Hecker et al. Citation2018).
One of the unexpected challenges was the number of citizens without internet access. The research team in the Lake Mattamuskeet project received phone calls and letters requesting alternate ways to participate. This was also faced in the Bogue Banks project as one of the citizen scientists did not have access to email for communication and could not submit the collected data through the website. Teams carrying out similar projects in communities whose residents are likely to lack wide-spread internet access (e.g., impoverished communities) should have alternate plans in place to allow for public participation.
A goal of this paper was to assess the use of public participation for collecting information that could be used to develop an engineering solution to a hydrologic problem. Although we have learned lessons that will make these projects more effective in the future, one of the things that contributed to the relative successes of these projects were the interdisciplinary teams. The varying experiences of each team member allowed established methods in social science to be altered to be effective in completing hydrologic engineering data collection. We recommend that consulting engineers who are interested in working on projects with more extensive public participation (e.g., the public is involved beyond the typical meetings) work with someone who has social science experience to increase their potential of effectively engaging the community. This is also the case for engineers involved in research, especially when trying to conduct long-term projects. Experts in other disciplines can use approaches such as eco-ethnography to better understand those participating in a project, to make the project better reflect the needs of the participants, and build a strong group of participants (Grace-McCaskey et al. Citation2019).
3.4 Lessons learned
There were two important lessons that stand out from our experiences using public participation in hydrologic engineering data collection:
Invest time at the beginning of the project to get an idea of what knowledge the public can contribute and what will help the public to convey that knowledge to the research team.
Spending a couple of days meeting with people from the public in the communities where the project will be conducted has the potential to greatly improve the information that is provided by the public. It is important in these brief initial meetings to talk with people from the community that have different careers, areas of expertise, and interest in addressing the problems facing the community. The need for doing this for every project was illustrated through our Lake Mattamuskeet project where we based our methods on previous experience working with similar, but not the same, communities. If our research team had invested this time in getting to know the public, we would have also learned that many in the public needed more road names or landmarks on aerial imagery to orient themselves.
(2) Plan to engage the community at the level required to sustain participation and complete the project.
If the goals of public participation in the project include collecting time series data that can be used in hydrologic models, it is important to have a plan in place to keep the participants interested in the project and contributing the needed data. The Bogue Banks project could not be continued due to a lack of funding to maintain engagement. The plan must include funding for structures required for the public to submit data and maintain communication.
3.5 Alternative cost comparison
To expand upon the second lesson learned, we conducted a cost analysis to compare the costs of completing these projects using traditional methods with using public participation. Although we did not quantify them in this paper, the benefits to the citizens should be also be considered when evaluating the use of participatory methods instead of all the work being completed by a project team. Increased social capital and greater knowledge that leads to positive community change are potential positive outcomes that could result from public participation in engineering projects that may outweigh an increased financial cost (Overdevest et al. Citation2004, Yusuf et al. Citation2018, Grace-McCaskey et al. Citation2019). It is also important to note when comparing the costs of these projects that there are likely to be differences in quality and temporal resolution of the data collected using traditional versus public participation methods.
For the Lake Mattamuskeet project (), we compared our public participation method with having a technician pay visits to properties throughout the area to determine which direction the water was being pumped out of fields. The public participation method had an approximate cost of US$7600, whereas visiting properties throughout the county had an approximate cost of US$15,300. These estimates do not include data processing and map making because they were assumed to be the same for each method. The cost comparison shows a clear advantage to using the public participation method with time spent verifying the data.
Table 4. Cost comparison (US$) for the Lake Mattamuskeet project using public participation or individual property visits to complete the watershed delineation, including the time of a principal investigator (PI), a technician, and travel. The number of hours of labor and total distance traveled are included in parentheses. The travel costs are based on an estimation of distance traveled and a flat rate per kilometer.
The cost comparison for the Bogue Banks project (), however, does not show an advantage for using public participation based on the assumptions in . The equipment costs were approximately US$1100 higher for the citizen science project if 31 water level meters (one for each participant) were purchased at a cost of US$335 per meter and 30 water-level loggers (one needed for atmospheric reference) were purchased at a cost of US$300 per logger plus the cost of other needed software and hardware for the traditional method. The cost to conduct the three years of monitoring using public participation was estimated to be US$57,300 and the cost using water level loggers was US$29,000. The major expense for the public participation method was having PIs conduct a meeting with the participants every other month. If the frequency of meetings could be reduced to twice per year, the cost of monitoring using public participation would be reduced to US$29,400. These estimates do not take into account time for data processing as these were assumed to be the same for each method. This shows that a major challenge to using public participation in groundwater monitoring is the cost of maintaining engagement in the project. Based on our experience, the level of engagement of two meetings per year, where the costs for public participation and the traditional method are approximately equal, is likely not enough engagement to maintain participation. Other methods of sustaining interest in a project other than face-to-face meetings should be explored.
Table 5. Cost comparison for three years of water-level collection in the Bogue Banks project using public participation (six meetings per year and two meetings per year), and the traditional method of water-level loggers. See for explanation.
Due to the short travel time (1.5 h) from campus and the groundwater wells being located relatively close together, we assumed that the water level loggers in all 29 wells could be downloaded in one day. If the wells are far enough apart or far enough away that it takes the technician two days to retrieve data from the water level loggers, the monitoring costs increase to $44,800. It becomes more economical to use public participation when travel time necessitates three days to download the water level loggers as the cost becomes US$60,200. Another alternative would be using more expensive water level loggers with telemetry to record and report the data in real-time. Taking into account additional installation time and a water level logger unit cost of US$1850, the monitoring costs would increase to US$68,000. This shows that conducting similar monitoring over a larger area would make public participation more cost effective.
As with any engineering project, identification of the project goals and appropriate methods to achieve those goals is important. Public participation should be considered as a method for collecting data for engineering projects. For the Lake Mattamuskeet project, public participation was crucial to success. Any efforts to complete the project would have required interaction with the landowners as the team would have had to go on private property to verify berm locations and the direction water was being pumped. For the Bogue Banks project, public participation was not required to complete the project. Collecting the data using automated water level loggers would likely have been cheaper and provided a team using the data for design work a more complete record. However, one of the key factors that has been identified in seeking public approval for engineering projects is early involvement in the process by the public (Ng et al. Citation2012). Public participation in the Bogue Banks project would have filled this role and also served the purpose of improving the knowledge of the citizen scientists. The lessons learned from our projects that include gaining a knowledge of what the public can contribute, estimating the amount of engagement required to sustain data collection, and evaluating the costs of multiple methods of collecting data should help others in the fields of hydrology or engineering better implement future public participation projects.
4 Conclusion
Public participation in engineering projects has typically been limited to providing input on design alternatives after much of the needed data has already been collected. Through our two hydrologic engineering projects that included public participation, we learned that we should not assume the knowledge that the public can bring to a project and try to use public participation when it will result in action that can be seen by the participants. Our cost comparison shows that public participation should be encouraged when a large project area makes the travel to collect the data cost prohibitive or the community members can contribute the data through a web map or a public meeting instead of visiting each property individually. Including the public in projects as citizen scientists or through participatory mapping were effective at getting the community involved in addressing problems they are facing. The benefits to the community of having more knowledgeable and engaged citizens should not be forgotten when considering the use of public participation in engineering projects.
Acknowledgements
We would like to thank Tom Vogel, Ethan Credle, Jennifer O’Neill, Jon Gullett, Marla Thompson, and Sara Neilson for their help in data collection. In addition, we also want to thank the citizens that participated in this study, the Pine Knoll Shores Aquarium, the North Carolina Coastal Federation, and the Mattamuskeet National Wildlife Refuge. We greatly appreciate the suggestions by the two reviewers and the associate editor for improving this manuscript.
Disclosure statement
No potential conflict of interest was reported by the authors.
Additional information
Funding
References
- Bhattachan, A., et al., 2018. Sea level rise impacts on rural coastal social-ecological systems and the implications for decision making. Environmental Science & Policy, 90, 122–134. doi:10.1016/j.envsci.2018.10.006
- Bonney, R., et al., 2014. Next steps for citizen science. Science, 343 (6178), 1436–1437. doi:10.1126/science.1251554
- Breuer, L., et al., 2015. HydroCrowd: a citizen science snapshot to assess the spatial control of nitrogen solutes in surface waters. Scientific Reports, 5, 16503. doi:10.1038/srep16503
- Brouwer, S., et al., 2018. Public participation in science: the future and value of citizen science in the drinking water research. Water, 10 (3), 284. doi:10.3390/w10030284
- Bruinink, M., et al., 2015. Portable, automatic water level estimation using mobile phone cameras. In: 2015 14th IAPR international conference on Machine Vision Applications (MVA). Presented at the 2015 14th IAPR international conference on Machine Vision Applications (MVA). Tokyo, Japan: IEEE, 426–429.
- Bruyere, B. and Rappe, S., 2007. Identifying the motivations of environmental volunteers. Journal of Environmental Planning and Management, 50 (4), 503–516. doi:10.1080/09640560701402034
- Buytaert, W., et al., 2014. Citizen science in hydrology and water resources: opportunities for knowledge generation, ecosystem service management, and sustainable development. Frontiers in Earth Science, 2. doi:10.3389/feart.2014.00026
- California Coastal Commission, 2018. California King Tides Project [ online]. California King Tides Project. Available from: https://www.coastal.ca.gov/kingtides/ [Accessed 19 Dec 2018].
- Cifelli, R., et al., 2005. The community collaborative rain, hail, and snow network: informal education for scientists and citizens. Bulletin of the American Meteorological Society, 86 (8), 1069–1078. doi:10.1175/BAMS-86-8-1069
- Cooper, H.M., et al., 2013. Sea-level rise vulnerability mapping for adaptation decisions using LiDAR DEMs. Progress in Physical Geography: Earth and Environment, 37 (6), 745–766. doi:10.1177/0309133313496835
- Creighton, J.L., 2005. What water managers need to know about public participation: one US practitioner’s perspective. Water Policy; Oxford, 7 (3), 269–278. doi:10.2166/wp.2005.0017
- Danielsen, F., Burgess, N.D., and Balmford, A., 2005. Monitoring matters: examining the potential of locally-based approaches. Biodiversity & Conservation, 14 (11), 2507–2542. doi:10.1007/s10531-005-8375-0
- Davids, J.C., et al., 2019. Soda bottle science—citizen science monsoon precipitation monitoring in Nepal. Frontiers in Earth Science, 7. doi:10.3389/feart.2019.00046
- Devictor, V., Whittaker, R.J., and Beltrame, C., 2010. Beyond scarcity: citizen science programmes as useful tools for conservation biogeography. Diversity and Distributions, 16 (3), 354–362. doi:10.1111/j.1472-4642.2009.00615.x
- Druschke, C.G. and Seltzer, C.E., 2012. Failures of engagement: lessons learned from a citizen science pilot study. Applied Environmental Education & Communication, 11 (3–4), 178–188. doi:10.1080/1533015X.2012.777224
- Forrest, L.C., 1999. Lake Mattamuskeet, New Holland and Hyde County. Charleston, SC: Arcadia Pub.
- Frensley, T., et al., 2017. Bridging the benefits of online and community supported citizen science: a case study on motivation and retention with conservation-oriented volunteers. Citizen Science: Theory and Practice, 2 (1), 4.
- Grace-McCaskey, C.A., et al., 2019. Eco-ethnography and citizen science: lessons from within. Society & Natural Resources, 32, 1123–1138. doi:10.1080/08941920.2019.1584343
- Grace-McCaskey, C.A., et al., 2018. A citizen science approach to groundwater monitoring: the impacts of participation on knowledge and attitudes, and implications for management. In: Geoscience information society’s annual conference proceedings for 2017, Seattle, WA, 45.
- Hauer, M.E., Evans, J.M., and Mishra, D.R., 2016. Millions projected to be at risk from sea-level rise in the continental United States. Nature Climate Change, 6 (7), 691–695. doi:10.1038/nclimate2961
- Heath, R., 1975. Hydrology of the Albemarle-Pamlico Region, North Carolina - A preliminary report on the impact of agricultural developments. Raleigh, NC: U.S. Geological Survey, No. WRI 9-75.
- Hecker, S., et al., 2018. Innovation in citizen science – perspectives on science-policy advances. Citizen Science: Theory and Practice, 3 (1), 4.
- Hyde County, 2017. Hurricane Matthew resilient redevelopment plan. Swan Quarter, NC: County of Hyde.
- Juston, J., Seibert, J., and Johansson, P.-O., 2009. Temporal sampling strategies and uncertainty in calibrating a conceptual hydrological model for a small boreal catchment. Hydrological Processes, 23 (21), 3093–3109. doi:10.1002/hyp.v23:21
- Kimmelman, M., 2017. The Dutch have solutions to rising seas. The world is watching [ online]. The New York Times. Available from: https://www.nytimes.com/interactive/2017/06/15/world/europe/climate-change-rotterdam.html [Accessed 16 Nov 2018].
- Le Coz, J., et al., 2016. Crowdsourced data for flood hydrology: feedback from recent citizen science projects in Argentina, France and New Zealand. Journal of Hydrology, 541, 766–777. doi:10.1016/j.jhydrol.2016.07.036
- Little, K.E., Hayashi, M., and Liang, S., 2016. Community-based groundwater monitoring network using a citizen-science approach. Groundwater, 54 (3), 317–324. doi:10.1111/gwat.2016.54.issue-3
- Lowry, C.S. and Fienen, M.N., 2013. CrowdHydrology: crowdsourcing hydrologic data and engaging citizen scientists. Groundwater, 51 (1), 151–156. doi:10.1111/gwat.2013.51.issue-1
- Manda, A.K., et al., 2015. Relative role and extent of marine and groundwater inundation on a dune-dominated barrier island under sea-level rise scenarios. Hydrological Processes, 29 (8), 1894–1904. doi:10.1002/hyp.v29.8
- Masterson, J.P., et al., 2014. Effects of sea-level rise on barrier island groundwater system dynamics – ecohydrological implications. Ecohydrology, 7 (3), 1064–1071. doi:10.1002/eco.v7.3
- Moftakhari, H.R., et al., 2015. Increased nuisance flooding along the coasts of the United States due to sea level rise: past and future. Geophysical Research Letters, 42 (22), 9846–9852. doi:10.1002/2015GL066072
- NCCF (North Carolina Coastal Federation), 2018. Lake Mattasmuskeet watershed restoration plan [ online]. North Carolina Coastal Federation. Available from: https://drive.google.com/file/d/0B5bxM0foxdSDbGRaU1REeVpPWDFkWm9ZX1NvbXFrRE5wRnow/view [Accessed 16 Nov 2018].
- NCCO (North Carolina Climate Office), 2018. Weather and climate database, station KMRH [ online]. North Carolina Climate Office. Available from: https://climate.ncsu.edu/cronos/?station=KMRH&temporal=monthly [Accessed 16 Nov 2018].
- Ng, S.T., Li, T.H.Y., and Wong, J.M.W., 2012. Rethinking public participation in infrastructure projects. Proceedings of the Institution of Civil Engineers: Municipal Engineer; London, 165 (2), 101–113.
- NWS (National Weather Service), 2010. Monthly normal precipitation 1980–2010 [ online]. National Weather Service. Available from: https://www.weather.gov/mhx/MonthlyNormalPrecipitation [Accessed 16 Nov 2018].
- Overdevest, C., Orr, C.H., and Stepenuck, K., 2004. Volunteer stream monitoring and local participation in natural resource issues. Human Ecology Review, 11 (2), 9.
- Pandya, R.E., 2012. A framework for engaging diverse communities in citizen science in the US. Frontiers in Ecology and the Environment, 10 (6), 314–317. doi:10.1890/120007
- Rotman, D., et al., 2014. Motivations affecting initial and long-term participation in citizen science projects in three countries. In: Presented at the iConference 2014 Proceedings: Breaking Down Walls. Culture – Context – Computing, iSchools, Berlin, Germany.
- Rotzoll, K. and Fletcher, C.H., 2013. Assessment of groundwater inundation as a consequence of sea-level rise. Nature Climate Change, 3 (5), 477–481. doi:10.1038/nclimate1725
- Royem, A.A., et al., 2012. Technical note: proposing a low-tech, affordable, accurate stream stage monitoring system. Transactions of the ASABE, 55 (6), 2237–2242. doi:10.13031/2013.42512
- Seibert, J., et al., 2019. Virtual staff gauges for crowd-based stream level observations. Frontiers in Earth Science, 7. doi:10.3389/feart.2019.00070
- Shirk, J.L., et al., 2012. Public participation in scientific research: a framework for deliberate design. Ecology and Society, 17 (2). doi:10.5751/ES-04705-170229
- Silvertown, J., 2009. A new dawn for citizen science. Trends in Ecology & Evolution, 24 (9), 467–471. doi:10.1016/j.tree.2009.03.017
- US Census Bureau, 2017. American FactFinder [ online]. Community Facts. Available from: https://factfinder.census.gov/faces/nav/jsf/pages/community_facts.xhtml [Accessed 19 Dec 2018].
- USFWS, 2013. Mattamuskeet National Wildlife Refuge [ online]. U.S. Fish & Wildlife Service. Available from: https://www.fws.gov/southeast/pdf/brochure/mattamuskeet-national-wildlife-refuge.pdf [Accessed 16 Nov 2018].
- Weeser, B., et al., 2018. Citizen science pioneers in Kenya – A crowdsourced approach for hydrological monitoring. Science of the Total Environment, 631–632, 1590–1599. doi:10.1016/j.scitotenv.2018.03.130
- West, S.E. and Pateman, R.M., 2016. Recruiting and retaining participants in citizen science: what can be learned from the volunteering literature? Citizen Science: Theory and Practice, 1 (2), 15. doi:10.5334/cstp.8
- Yusuf, J.-E.W., et al., 2018. Engaging stakeholders in planning for sea level rise and resilience. Journal of Contemporary Water Research & Education, 164 (1), 112–123. doi:10.1111/j.1936-704X.2018.03287.x