
 ?Mathematical formulae have been encoded as MathML and are displayed in this HTML version using MathJax in order to improve their display. Uncheck the box to turn MathJax off. This feature requires Javascript. Click on a formula to zoom.
ABSTRACT
Predicting the impacts of climate change on water resources remains a challenging task and requires a good understanding of the dynamics of the forcing terms in the past. In this study, the variability of precipitation and drought patterns is studied over the Mediterranean catchment of the Medjerda in Tunisia based on an observed rainfall dataset collected at 41 raingauges during the period 1973–2012. The standardized precipitation index and the aridity index were used to characterize drought variability. Multivariate and geostatistical techniques were further employed to identify the spatial variability of annual rainfall. The results show that the Medjerda is marked by a significant spatio-temporal variability of drought, with varying extreme wet and dry events. Four regions with distinct rainfall regimes are identified by utilizing the K-means cluster analysis. A principal component analysis identifies the variables that are responsible for the relationships between precipitation and drought variability.
Editor S. Archfield Associate editor F.-J. Chang
1 Introduction
There is ever-increasing evidence that global warming is becoming more and more important as the global concentration of carbon dioxide in the atmosphere continues to rise due to anthropogenic emissions (Hsiang and Kopp Citation2018). Global warming causes major changes in the water cycle. It affects the availability of water resources, energy production, agriculture, hydrological regimes of rivers, and also increases the risk of extreme events (Donnelly et al. Citation2017, Sunde et al. Citation2017). Simultaneously, global water demand is also increasing, which exacerbates substantially the drought risk (IPCC (Intergovernmental Panel on Climate Change) Citation2014, Bhuyan et al. Citation2017). In this context, droughts have been portrayed as a prolonged dry weather period caused by a lack of precipitation, which leads to severe hydrological imbalances at different scales (WMO Citation2006, Kreibich et al. Citation2019).
At the regional scale, the Middle East and North Africa region have been identified as one of the hot spots that will be affected by extreme heat and increasing water demand as well as drought (Cook et al. Citation2016, Waha et al. Citation2017). According to the Fifth Assessment Report of the Intergovernmental Panel on Climate Change (IPCC), substantial changes in average rainfall are expected for this region (Bento et al. Citation2018). Total precipitation for this region is expected to decrease while the frequency and intensity of extreme events are expected to increase (Gara et al. Citation2019). Hence, based on these predictions, the succession of dry years with the concentration of prolonged drought and exceptional floods become more likely to occur in this region (Tramblay and Hertig Citation2018).
The above mentioned hydrometeorological alteration is a specific point of concern for Tunisia. This country is situated in the semi-arid Mediterranean region which is highly affected by climate change (Chargui et al. Citation2018, Moussa et al. Citation2019). It is characterized by large spatio-temporal variable rainfall patterns and overall scarce freshwater resources (Gader et al. Citation2015). Water resources are limited and unevenly distributed due to the Mediterranean and arid climate of the country. In this context, it is crucial to study the spatio-temporal dynamics of precipitation and drought.
Studies on climate variability in the Mediterranean region have focused on precipitation trends and distribution (Liuzzo et al. Citation2016, Blanchet et al. Citation2018). Statistical distributions such as the generalized extreme value distribution are used to characterize the variability (Nasri et al. Citation2016, Ben Khalfallah and Saidi Citation2018). Parametric and non-parametric statistical tests like the Mann-Kendall test are used to identify trends (Liuzzo et al. Citation2016, Sahany et al. Citation2018). Other studies have used deterministic and (geo)-statistical techniques to interpolate the space-time distribution of precipitation (Feki et al. Citation2012, Gupta et al. Citation2017). These studies allowed to assess the spatial patterns of precipitation but did not allow having a clear process understanding of the complexity of the rainfall regime and the factors that control its heterogeneity.
Other studies have focused on drought using different drought indices and assessment methods (Ionita et al. Citation2016, Frank et al. Citation2017, Hui-Mean et al. Citation2018). The standardized precipitation index (SPI), for instance, is used by many national meteorological and hydrological services (Svoboda et al. Citation2012, Ionita et al. Citation2016). This index is based on historical precipitation records (Eyring et al. Citation2016, Mathbout et al. Citation2018). The aridity index (AI) is also used to assess drought. This index takes into account the impacts of temperature and precipitation on drought (Bharadiya et al. Citation2015). Yet, the AI robustness is still poor to study drought characteristics in a warming climate (Mukherjee et al. Citation2018). Other studies have tried to combine different drought indices (Mukherjee et al. Citation2018, Yihdego et al. Citation2019). Finally, as drought is strongly affected by the spatial and temporal variability of the drought forcing terms, scope exists to improve the integration of the space-time variability of forcing terms in the drought assessment methodology.
In this context, this study aims to analyse and quantify the spatial and temporal dynamics of precipitation and drought in the Medjerda catchment of Tunisia. The study also aims to explore the contributing factors of the observed variability.
2 Methodology
2.1 Study area
The Medjerda is a transboundary river flowing from Algeria and to Tunisia (). The source of the Medjerda is located near Souk-Ahras, in the Algerian territory. From there onwards, the Medjerda and its tributaries collect the runoff water of part of the eastern Algerian and northern Tunisia territory (Gara et al. Citation2015). The total area of the Medjerda catchment is 23 700 km2. Almost one-third of this is located in Algeria. The river discharges nearly one billion cubic meters of water per year, which constitutes nearly 40% of the country’s wide available surface water.
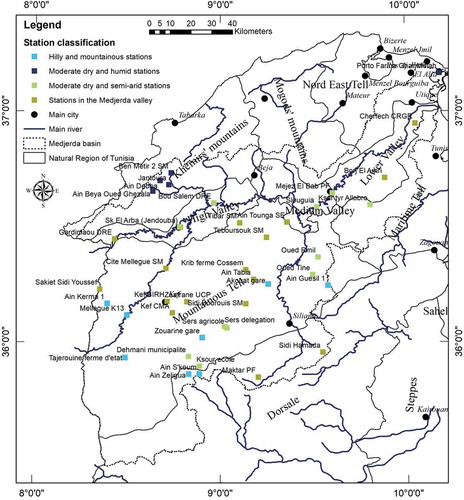
Figure 1. Geographical location of the Medjerda catchment study site in Tunisia and the 41 selected rainfall stations.
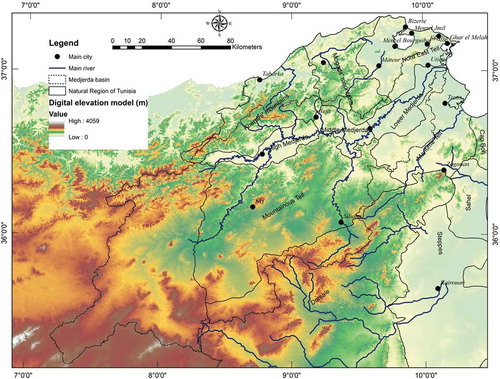
The Medjerda catchment in Tunisia is divided into three distinct parts. The first part, referred to as the High Medjerda, initiates from the Algerian border to the city of Bousalem. The second part, the Middle Medjerda, includes all the tributaries and extends until Medjez el Bab. Finally, the Lower Medjerda ends at the river mouth of Kalaat Landalous. From a geographic point of view, the catchment belongs to the mountainous Tell region, characterized by cold and rainy winters, with a very heterogeneous hydrological regime. The climate of the Medjerda catchment belongs to the humid, sub-humid and semi-arid bioclimatic Mediterranean stages.
The relief in the Medjerda catchment is characterized by a large variability, having an altitude ranging between 0 and 1637 m. The slopes of the catchment are generally high in the upstream mountainous parts exceeding sometimes 40%. The slopes become weaker in the downstream part with values less than 1% in most parts of its lower valley.
2.2 Data collection and processing
The overall methodology of data processing methodology is summarized in . The rainfall database collected from the General Directory of Water Resources in Tunisia (DGRE) (http://www.agridata.tn/organization/dgre) was used. From 172 available rainfall stations, 41 stations were selected having monthly and annual observed rainfall data for 41 years, from 1972/73 to 2012/13. To obtain reliable time series, we only considered stations with missing value ratio less than 15% (). It was also the ambition to have a well-distributed spatial coverage of the catchment ().
Table 1. Descriptive statistics of annual rainfall for the raingauges in Medjerda catchment. Z: altitude (m a.s.l.), Min: minimum annual rainfall (mm/year), Max: maximum annual rainfall (mm/year), SD: standard deviation of annual rainfall (mm/year); CI: coefficient of irregularity; CV: coefficient of variation.
Figure 2. Flowchart of the methodology.
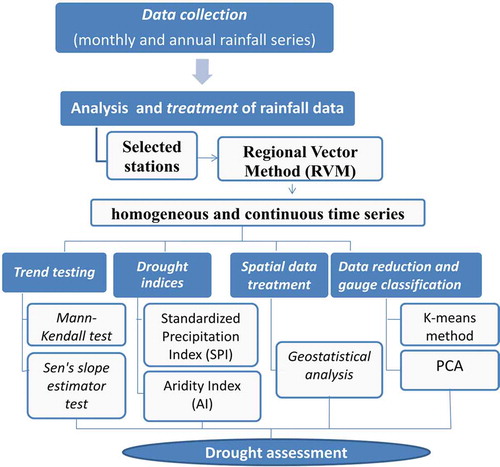
The homogeneity of rainfall series for long periods was assessed to ensure the quality of the data series and to identify the breaks of homogeneity. The Hydraccess software (Vauchel Citation2005) was used to obtain homogeneous and continuous time series for the 41 years and 41 stations. The Regional Vector Method (RVM) developed by ORSTOM/IRD was used to obtain the standardized index of monthly and annual rainfall for a homogeneous region (Taibi et al. Citation2017).
Hiez (Citation1977) defined the regional vector (RV) as a time series of annual or monthly rainfall or hydrometric indices, extracted from the most likely information available from a set of observed stations grouped by region. The calculation of the RV is based on two hypotheses: (a) the pseudo-proportionality hypothesis, ensuring concomitant variations in rainfall at all stations; and (b) the hypothesis that most probable information can be achieved using a frequency criterion.
To have a continuous time series for each station, an index Zi, the ratio of the annual rainfall to the average annual rainfall, was calculated. If Zi is greater than one, the year is humid and if it is less than one then the year is dry (Brunet-Moret Citation1979, Sambou et al. Citation2018).
Since the RV has been assessed, the missing data of the individual stations can be estimated on a monthly as well as on an annual scale. The extension consists of reconstructing the rainfall values by multiplying the vector index of a year by the extended average of the station over the study period.
The Pettitt test was chosen to validate the performance of the RVM based homogenized and interpolated data (Pettitt Citation1979). This test is known for its robustness in detecting changes in stationarity, as demonstrated in previous studies (Kulkarni and Pardeshi Citation2019, Kundu and Mondal Citation2019, Li et al. Citation2019).
It consists of cutting the main series of N elements into two sub-series at each time t between 1 and N – 1. The main series has a singularity at time t if both sub-series (series (Xi), i = 1, t and (Xj), i = t + 1, N) have different distributions:
where sgn(Xj − Xi) is the sign function, and Xi and Xj are the data values in the time series i and j (j > i), respectively.
The variable Ut,N is subsequently defined as:
The variable KN is defined by the absolute maximum of Ut,N for t from 1 to N – 1:
The null hypothesis H0 of non-failure is tested utilizing a non-parametric test. For a given risk value α, H0 is rejected if a certain probability (Prob (KN > k)) calculated from the studied time series is less than α.
2.3 Descriptive statistics
To characterize the spatial and temporal variability of rainfall in the Medjerda catchment, the descriptive statistics for annual rainfall for the 41 stations were used. Use was made of the variance (V), the standard deviation (SD), the coefficient of variation (CV), the interval of variation (IV) and the coefficient of irregularity (CI). These techniques are defined as follows:
where V is the variance, is the sample mean, xi is the ith element from the sample, ni is the number of the ith element from the sample and N is the number of elements in the sample.
where is the square of the sample variance and
is the sample mean.
where Pmax and Pmin are, respectively, the maximum and minimum annual precipitation (mm/year).
2.4 Trend testing
2.4.1 Mann-Kendall test
The Mann-Kendall trend test was presented by Mann (Citation1945) and then further developed by Kendall (Citation1975). It is a non-parametric test generally used to identify the trend in meteorological time series data (Abdulla and Al-Qadami Citation2019, Panda and Sahu Citation2019). The null hypothesis H0 of this test is that there is no trend. The alternative hypothesis means that there is a significant trend. The Mann-Kendall test is based on the calculation of Kendall’s tau (τ) coefficient measuring the association between two variables. More specifically, it measures the correlation of rank between the two variables. In the case of the trend test, the first series is a growing time indicator with ever-increasing ranks, which simplifies the computation process. Kendall’s S statistic and its variance are given by:
where n is the number of data in the series, xi and xj (j > i) are the observations which are supposed to be independent and sgn(xj − xi) is the sign function, as defined in Equationeq (1)(1)
(1) .
The independence hypothesis is verified by the Wald-Wolfowitz test, which is a non-parametric test that tests that the elements of the sequence are mutually independent. It is used to check whether there is a significant autocorrelation between the observations.
2.4.2 Sen’s slope estimator test
Sen’s slope estimator test is a non-parametric method for estimating the slope of the trend in the sample of N pairs of data (Sen Citation1968). The method is based on the calculation of Qi, given by:
where xj and xk are the data values at times j and k (j > k), respectively.
The N values of Qi are ranked from the smallest to the largest. The slope median defines the Sen slope estimator and is calculated as follows:
Sen’s slope estimator, which expresses the trend and slope magnitude in the entire time series, is used in several studies for its robustness for estimating changes (Atta-ur-Rahman and Dawood Citation2017, Hui-Mean et al. Citation2018).
2.5 Drought indices
Two climatic indices were applied to study the variability of the rainfall regime in the Medjerda catchment: the SPI used for the study of droughts (Louvet et al. Citation2011) and the AI, used to characterize the complex phenomenon of aridity (Sahin Citation2012).
The SPI was presented first by McKee et al. (Citation1993) to characterize precipitation deficits. It reflects the effect of drought on the availability of water resources. The World Meteorological Organization recommends the SPI for dry weather monitoring as it only requires precipitation for calculations (Santos et al. Citation2017, Citation2019). This index is calculated as follows:
where SD is the standard deviation of annual precipitation; Pi is the annual precipitation of a given year i (mm/year); and Pm is the mean annual precipitation for a station (mm/year).
Many studies have used the SPI for the analysis of the spatio-temporal variability of drought (Caloiero and Veltri Citation2019, Dhurmea et al. Citation2019, Gara et al. Citation2019, Ouatiki et al. Citation2019). The SPI is often used as a key in drought classification schemes ().
Table 2. Standardized precipitation index (SPI) and aridity index (AI) classification.
The AI is defined as the ratio of precipitation to average temperatures according to the equation (Martonne Citation1926):
where P the annual average rainfall (mm/year) and T is the annual average temperature (°C).
The annual average temperature data for the observed period were provided by the National Institute of Meteorology (INM). The AI is also often used as a key in climate classification schemes ().
2.6 Spatial data treatment
Geostatisticss allow analysis of the spatial and temporal structure of hydrometeorological and climatic variables (Slimani et al. Citation2007). Geostatistics is built on the theory of random variables and is used to study the spatial variability of a quantitative variable defined at any point in space. Geostatistics proves to be very suitable for mapping natural phenomena (Webster and Oliver Citation2007, Tripathi et al. Citation2015). The semi-variogram is used with ordinary kriging (OK) to predict the random variable for unobserved locations (Varouchakis et al. Citation2018). In this study, a semi-variogram analysis and OK were used to study and map the annual mean precipitation.
The cross-validation method was used to evaluate the robustness of the spatial prediction model (Gerstmann et al. Citation2016). The cross-validation results allow the calculation of the following model’s goodness-of-fit parameters: the mean standardized error (MSE), which should be close to zero; and the root mean square standardized error (RMSSE), which should be close to one. These parameters were calculated as follows:
where are the measured values and
are the predicted values at time/place i.
2.7 Data reduction and station classification
Drought clustering was performed using the K-means clustering technique. This technique was introduced by MacQueen (Citation1967) and consists of a hierarchical classification approach commonly used to define climate divisions (Li et al. Citation2015).
To identify a station class with a similar rainfall pattern, the K-means clustering method was performed by considering the selected stations as quantitative variables and years as individuals.
To choose the number of clusters, the K-means was launched with different class values. The method allowed calculating the variance of the different clusters. The optimal number of classes was selected from the minimization of the intra-class distance. The classification that was used to obtain an intra-class variance minimization solution is the Wilks lambda criterion. This method is sensitive to scale effects.
Drought data were further analysed with principle component analysis (PCA). When the rainfall regime represents a large variability, the PCA can serve as a tool for analysing and understanding the influence of different factors.
A PCA based on a Spearman correlation matrix was performed by admitting the selected stations as individuals. The following attributes were considered as explicative variables: the latitude of the station (UTM coordinate), the longitude (UTM coordinate), the altitude (m a.s.l.), the distance to the sea (km), the average monthly precipitation (mm/month), the average annual precipitation (mm/year), the SPI average; and the AI average. The explicative variables were projected in the factorial plan allowing to highlight their correlations.
To determine the optimal number of factors to be retained for the interpretation of the results, the cumulative percentage of variability represented by the factorial axes is considered. The method further looks for the presence of an inflection point when representing the factorial axes with the accumulation of eigenvalues.
3 Results and discussion
3.1 Overview of the used data
The RVM was applied to correct and complete the original precipitation time series. The results of the Pettitt test on the corrected and completed precipitation time series show that the 41 series of annual rainfall are homogeneous. This indicates that the reconstructed series can be used to study the spatio-temporal variability of annual rainfall.
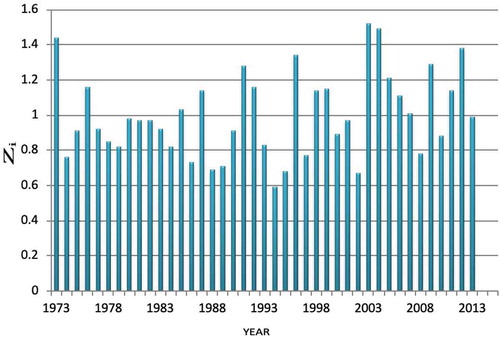
The series of the annual index Zi is shown in . This index illustrates the overall annual variability of rainfall in the Medjerda catchment. 2002/03 appears as a very rainy season, while 1993/94 is the driest season. This result is consistent with several previous studies for other Tunisian regions (Aouissi et al. Citation2018, Jemai et al. Citation2018).
Figure 3. Temporal variation of Zi (i.e. the ratio of the regional value of the annual rainfall to the average annual rainfall) of the precipitation in the Medjerda catchment.
The SD and CV of the annual rainfall events indicate high inter-annual variability of rainfall in the Medjerda catchment (). The SD is always larger than 72 mm/year and sometimes reaches more than 350 mm/year. The average annual rainfall of the Medjerda catchment over the selected period is 490 mm. The highest averages are observed at the stations located in the northwestern part of the study area. The CI of the annual rainfall is, on average, equal to 3. It ranges from 2.2 at Maktar PF to more than 4.1 at Oued Rmil. This reflects a spatial and temporal irregularity of the rainfall regime in this region. This result is consistent with other rainfall analysis studies carried out in catchments close to the Medjerda catchment (Ennajah et al. Citation2015, Jemai et al. Citation2018).
The analysis of the ratio of extreme values by the annual average for each station confirms the high temporal variability of annual precipitation. During wet years, these ratios can exceed 190%. On the other hand, this ratio may not exceed 50% for dry years. The ratio of the annual average precipitation at the level of each station to the annual average precipitation of all 41 stations illustrates the important spatial variability of annual rainfall. This ratio is 51% at Zouarine Gare and 256% at Ain Debba.
The box plots of the mean annual precipitation over the 41 raingauges for the period from 1972/73 to 2012/13 are given in . The box plot confirms the important spatial and temporal variability of the annual precipitation in the catchment. This important space-time variability of annual precipitation is consistent with observations in the Merguellil catchment in Tunisia (Chargui et al. Citation2018).
Figure 4. Boxplots of the annual precipitation in the Medjerda catchment from 1972/73 to 2012/13. The boxplots were created with sigmaplot 11.0. The upper and lower limits represent the 75th and 25th percentiles and the horizontal bars at the ends of the lines outside the boxes represent the 90th and 10th percentiles. The horizontal line in the box represents the median. Black circles represent measures that fall outside the 90th and 10th percentile boundaries.
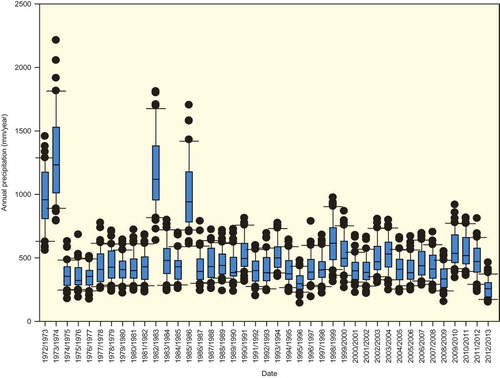
The time course of the mean annual precipitation displays exceptional humid seasons such as 1972/73, 1973/74, 1982/83 and 1985/86. During these seasons, annual precipitation exceeds 1000 mm/year.
3.2 Trend analysis
The Mann-Kendall test and Sen’s slope estimator test were applied to detect possible temporal trends in the annual rainfall series for all the 41 rainfall stations (). The null hypothesis H0 of the Mann-Kendall test (i.e. there is no trend) has been accepted if the p value exceeds the confidence level α = 0.05). Results show that there is no significant trend in annual rainfall for the majority of the selected stations. Significant trends are only observed at the Akouat Gare and Dehmani municipalite stations, with trend magnitudes of 3.2 and 2.8 mm/year, respectively. The absence of significant trends in annual rainfall is consistent with the conclusions drawn from many other studies showing that in Tunisia rainfall trends are not always detected (Chargui et al. Citation2018, Feki et al. Citation2018).
Table 3. Results of the MK test and the Sen slope estimator test of annual rainfall for the raingauges in the Medjerda catchment.
3.3 Geostatistical analysis
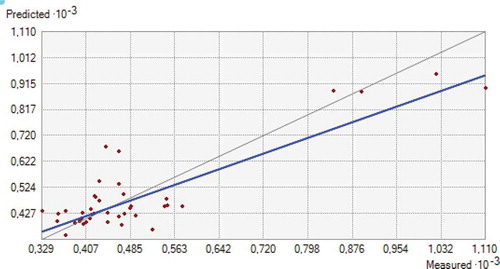
The variogram of annual rainfall in the Medjerda catchment is modeled employing a Gaussian model ( and ). The variogram model was used to predict rainfall using OK. The quality of the variogram model was thereby evaluated using a cross-validation goodness-of-fit of predicted annual precipitation. The RMSSE of predicted annual precipitation was close to one and the MSE was close to zero, suggesting that the variogram model is appropriate. The graphical representation of the observed versus predicted annual precipitation confirms this goodness-of-fit ().
Table 4. Omnidirectional variogram parameters of the annual precipitation applied to raingauges of the Medjerda catchment.
Figure 5. Omnidirectional variogram of inter-annual rainfall in the Medjerda catchment.
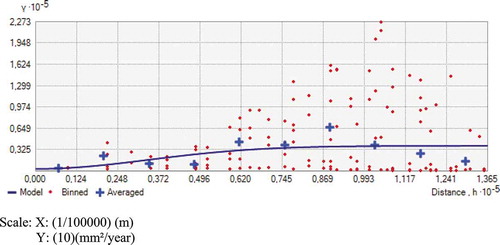
Figure 6. Graphical goodness-of-fit of the observed and predicted rainfall of the 41 raingauges in the Medjerda catchment.
Variographic analysis shows that the variance of rainfall increases to a certain distance. This spatial dependence may be due to the relief in the catchment. Indeed, the study catchment has an accentuated topography in the upper valley. This is consistent with several studies showing that the spatio-temporal variability of rainfall in Tunisia is influenced by the relief (Slimani et al. Citation2007, Gader et al. Citation2015). Yet, altitude is not the only factor that influences this variability (Feki et al. Citation2012).
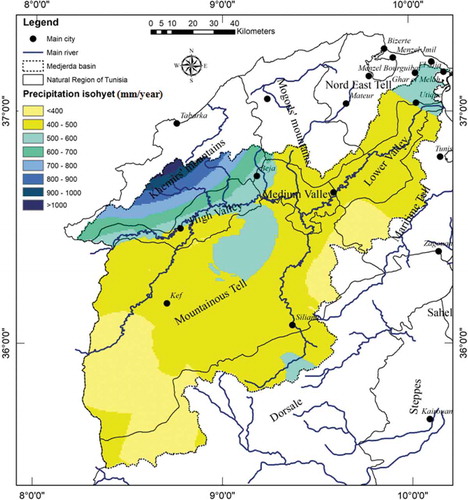
The results of the variography were used for rainfall mapping using OK (). The mean annual rainfall map confirms that the rainfall in the Medjerda catchment is characterized by high spatial variability, varying between 300 and 1200 mm/year. It is found that rainfalls are higher than 1000 mm/year in the northwest and gradually decrease when moving to the southeastern part of the catchment. This high spatial variability of precipitation is typical for the Mediterranean regions (Rodrigo Comino et al. Citation2016, Rysman et al. Citation2016, Cid et al. Citation2017).
Figure 7. Mean annual rainfall map of the Medjerda catchment.
3.4 Drought indices
Mapping of the mean inter-annual SPI, calculated per decade over the period 1973–2012, reflects the temporal dynamics of precipitation (). The 1973–1982 decade is characterized by high temporal variation of the rainfall regime varying from extreme humid to extreme dry. The 1983–1992 and 1993–2002 decades are characterized by a moderate drought over the majority of the catchment except in some locations in the southwest.
Figure 8. Spatial distribution of inter-annual SPI during four decades in the Medjerda catchment.
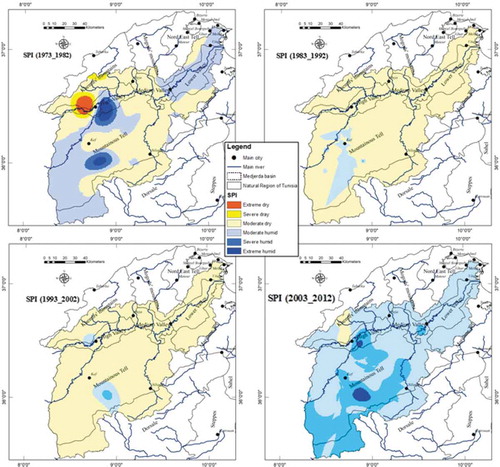
The regionalization of the average values of the SPI over different periods highlights the large spatio-temporal variability of the rainfall in the Medjerda catchment. During the last decade of 2003–2012, an increase in the rainfall occurred. The rainfall regime became humid all over the catchment. This decade is characterized by a succession of floods in the Medjerda catchment such as the floods of 2003, 2006, 2009, 2011 and 2012 (Ben Khalfallah and Saidi Citation2018). The period 2000–2007 presented four floods whereas the period 1960–2000 had an average flood frequency of 1.75 events per 10 years (Jebari et al. Citation2012). Hence, the hydrological regime is subjected to considerable temporal alteration at the decadal scale, even if no trends were observed at the multi-decadal scale. The observed hydrologic alteration could be explained by climate change, which is well described for Mediterranean catchments (Zielhofer et al. 2015).
Using the AI, we observe that the Medjerda catchment can be decomposed into three climate zones from north to south (Abid et al. Citation2018) (). The AI ranges from 7 to 49 and is lower in the southwest and higher in the north of the Medjerda catchment. The mapping of the AI over four decades shows that the majority of the catchment situates in the semi-arid bioclimatic stage. The northern part of the catchment belongs to the sub-humid and humid region. This part of the catchment exhibits a larger temporal variability.
Figure 9. Spatial distribution of inter-annual AI during four decades in the Medjerda catchment.
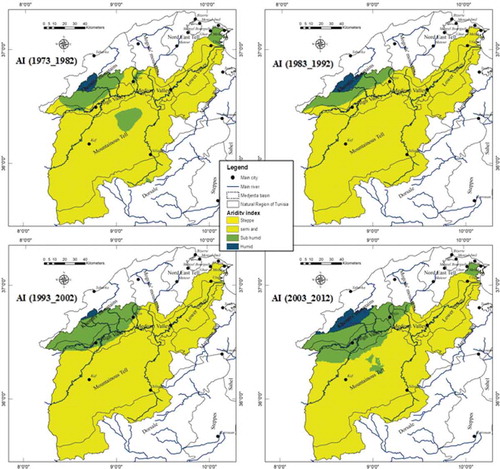
The bioclimatic stratification of the study area, as illustrated in the AI maps, is largely controlled by the topography. The catchment exhibits a transition between the northern region with high altitudes characterized by a humid and sub-humid climate to the southern region with medium and low altitudes characterized by a semi-arid to arid climate.
3.5 Multivariate statistical analysis
We further explored the spatial dynamics of the mean annual rainfall through the multivariate cluster and ACP analysis. The K-means method on the annual rainfall was carried out for different class numbers ranging from 3 to 6. The curve of the interclass distance according to the class number, showed an inflection point in class 4, corresponding to the optimal number of classes to be considered. The identified clusters are shown in . The clusters can be described as follows:
Figure 10. Clusters of rainfall stations differentiated by means of the K-means clustering method on the mean annual rainfall of the Medjerda catchment.
3.5.1 Moderate dry and humid stations
This class encompasses the following stations: Ain Debba, Jantoura, Ben Metir 2 SM, Ain Beya Oued Rhezalla and Porto Farina Ghar Meleh. These gauges are located in the northern part of the Medjerda catchment relatively close to the sea. They are characterized by a moderate drought to humid. This group is influenced by the north-west, north and north-eastern rainfall, which is reinforced by the presence of the sea.
3.5.2 Moderate dry and semi-arid stations
This group encompasses the following gauges: Dehmani municipality, Ksour Ecole, Ksar Tyr the Allobro, Medjez El Bab PF, Oued Rmil, Oued Tine, Sers Agricole, Sers Delegation, Slouguia, Sk El Arba (Jendouba) SE, and Bou Salem DRE. The behavior of these stations is close to that of the previous stations, but they exhibit less precipitation and are situated more southeast in the Medjerda catchment. This cluster is characterized by a large variation of altitude, decreasing from 720 m a.s.l. at Ksour Ecole to 65 m a.s.l. at the Slouguia stations.
3.5.3 Hilly and mountainous stations
The third cluster contains Ain Guesil 1, Ain Kerma 1, Ain S’koum, Ain Zeligua, Akouat Gare, Oued Mellegue K 13, Tajerouine Ferme d’Etat and Zouarine Gare. These stations are located in the hilly and mountainous region of the Tells Mountains. The altitudes of these stations exceed 400 m a.s.l. and they are influenced by continental characteristics. The precipitations range varies between 260 and 422 mm/year, respectively, at Zouarine Gare and Akouat Gare.
3.5.4 Stations in the Medjerda Valley
This cluster includes the following stations, located in the Medjerda Valley and within its main tributaries: Ain Tabia, Ain Tounga, Borj El Amri, Cherfech CRGR, Cite Mellegue SM, Gardimaou DRE, Kef BIRH, Kef CMA, Krib Ferme Cossem, Maktar PF, Sakiet Sidi Youssef, Sidi Bou Rouis SM, Sidi Hmada, SK El Arba (Jendouba) SM, Teboursouk SM, Tibar SM and Zaafrane UCP. This cluster encompasses the largest group of gauges with similar behaviour. The gauges of this cluster have an altitude varying between 55 and 900 m a.s.l. and are characterized by an average annual rainfall between 420 and 580 mm/year. Moreover, there has been a decrease in the rainfall of the north towards the south, which is explained by the presence of the Khemirs and Mogods chains bordering the Medjerda Valley in the north and the Tells Mountains in the south.
To explore the relationships between mean precipitation, drought indices, and possible other explaining factors, a PCA analysis was performed. The PCA allows summarizing the correlation between average monthly precipitation, mean inter-annual precipitation, climate indices, position in the catchment and altitude. Cluster analysis combined with PCA analysis has proven to be effective in analyzing rainfall distribution patterns according to topographic and other climatic parameters (Rau et al. Citation2017). The first two components of the PCA explain 70% of the total variance. The projection of the variables within the biplot composed of the first and second principal component (PC1 and PC2) is given in . It is observed that inter-annual rainfall is strongly influenced by the wet seasons (autumn and winter) and that it is strongly correlated with latitude but weakly with longitude. These results are in agreement with similar studies performed on Mediterranean catchments. It illustrates the important seasonality of rainfall (Deitch et al. Citation2017, Corona et al. Citation2018). The precipitation of the summer months is the most correlated with the altitude and the proximity of the sea. The first principal component, PC1, is mainly explained by monthly winter precipitations, SPI and the distance to the sea, while PC2 is determined by the monthly summer precipitation, AI, and latitude. A strong negative correlation is observed between the SPI and the rainy months, and between AI and the summer months. The SPI should decrease strongly during years characterized by winter precipitation shortage, however, it increases when precipitation is high during rainy months (Fischer et al. Citation2019); this could explain the negative correlation. The aridity index is related to high temperature, mainly in summer, and to less precipitation during dry years (Zhao et al. Citation2019).
Figure 11. Projection of the selected variables in the biplot composed of the first (PC1) and second principal components (PC2). XUTM, YUTM and Z (m): coordinates of the selected station in the Universal Transverse Mercator coordinate system, Zone 32 Carthage North; SPI: annual mean SPI; AI: annual mean AI; Pm: mean inter-annual rainfall (mm); Sea: distance to the sea (km); January, …, December: average monthly rainfall (mm).
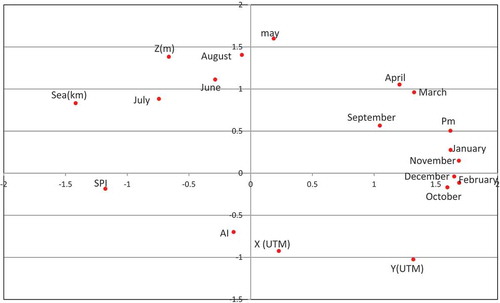
These results are consistent with those found by Ellouze et al. (Citation2009), who showed that the SPI is explained by annual rainfall variability, topography and seasonality in southern Tunisia.
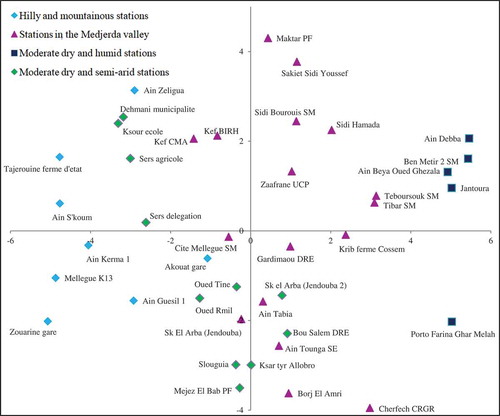
The representation of gauges in the factorial plan shows the dispersion of the stations around the two axes (). The stations are labelled according to the clusters identified by the K-means method. The stations belonging to the moderate dry and humid stations have the greatest inertia with the first axis while that of the hilly and mountainous stations have the lowest values of inertia with this axis.
Figure 12. Projection of the rainfall stations in the biplot composed of PC1 and PC2. The rainfall stations are labelled according to the clusters identified by the K-means clustering algorithm.
4 Conclusion
Drought trends and variability in precipitation patterns were identified for the Medjerda catchment in Tunisia. We used data from 41 ground-truth precipitation gauges collected for 41 years that were first pre-processed using the RVM method. We also explored factors controlling the spatio-temporal dynamics of drought and rainfall. The pre-processing of the precipitation data utilizing the RVM allowed generating homogeneous time series that could be further used to assess droughts, drought trends, and variability. The analysis of rainfall data and derived drought indices revealed remarkable spatio-temporal variability of drought. The analysis revealed also the occurrence of significant drought in major parts of the catchment. The variographic analysis showed that abounded Gaussian variogram model could be used to fit the annual rainfall semi-variogram. The variogram could subsequently be used to map the annual precipitation. A cluster analysis on the data of the 41 stations allowed identifying four distinct clusters that partially could be discriminated based on geographical attributes such as the geographical position, the altitude, and the distance to the sea. These results were also consistent with the results of the principal component analysis.
The obtained results make it possible to improve the knowledge of rainfall and drought variability in this specific catchment and the Mediterranean region more generally. The adopted methodology allows a better understanding of the space–time dynamics of rainfall and droughts and the factors that control this variability. Understanding the space–time dynamics is a prerequisite for hydrological risk management and mitigation in a climate-changing context.
Acknowledgements
The authors would like to thank the Tunisian General Directorate of Water Resources (DGRE) and the National Institute of Meteorology (INM) for providing the data. We gratefully acknowledge the editors and the anonymous reviewers of this paper, whose comments helped to improve it.
Disclosure statement
No potential conflict of interest was reported by the authors.
Additional information
Funding
References
- Abdulla, F.A. and Al-Qadami, A., 2019. Structural characteristics of precipitation in Jordan. In: Z. Zhang, N. Khélifi, A. Mezghani, and E. Heggy, eds. Patterns and mechanisms of climate, paleoclimate and paleoenvironmental changes from low-latitude regions. CAJG 2018. Advances in science, technology & innovation (IEREK Interdisciplinary Series for Sustainable Development). Cham: Springer, 103–105. doi:10.1007/978-3-030-01599-2_24.
- Abid, N., Bargaoui, Z., and Mannaerts, C.M., 2018. Remote-sensing estimation of the water stress coefficient and comparison with drought evidence. International Journal of Remote Sensing, 39 (14), 4616–4639. doi:10.1080/01431161.2018.1430917.
- Aouissi, J., et al., 2018. Valuing scarce observation of rainfall variability with flexible semi-distributed hydrological modelling – mountainous Mediterranean context. Science of the Total Environment, 643, 346–356. doi:10.1016/j.scitotenv.2018.06.086
- Atta-ur-Rahman, and Dawood, M., 2017. Spatio-statistical analysis of temperature fluctuation using Mann–Kendall and Sen’s slope approach. Climate Dynamics, 48 (3–4), 783–797. doi:10.1007/s00382-016-3110-y.
- Ben Khalfallah, C. and Saidi, S., 2018. Spatiotemporal floodplain mapping and prediction using HEC-RAS - GIS tools: case of the Mejerda river, Tunisia. Journal of African Earth Sciences, 142, 44–51. doi:10.1016/j.jafrearsci.2018.03.004
- Bento, V.A., et al., 2018. A climatological assessment of drought impact on vegetation health index. Agricultural and Forest Meteorology, 259, 286–295. doi:10.1016/j.agrformet.2018.05.014
- Bharadiya, N., Vallabhbhai, S., and Manekar, V., 2015. agro-climatic rice yield model for surat district view project experimental and numerical studies on bed level variations in alluvial channels view project sciencedirect sciencedirect. Aquatic Procedia, 4, 1243–1249.
- Bhuyan, U., Zang, C., and Menzel, A., 2017. Different responses of multispecies tree ring growth to various drought indices across Europe. Dendrochronologia, 44, 1–8. doi:10.1016/j.dendro.2017.02.002
- Blanchet, J., Molinié, G., and Touati, J., 2018. Spatial analysis of trend in extreme daily rainfall in southern France. Climate Dynamics, 51 (3), 799–812. doi:10.1007/s00382-016-3122-7.
- Brunet-Moret, Y., 1979. Homogénéisation des précipitations. Cahiers ORSTOM, Série Hydrologie, 16 (3,4), 147–170.
- Caloiero, T. and Veltri, S., 2019. Drought assessment in the Sardinia Region (Italy) during 1922–2011 using the standardized precipitation index. Pure and Applied Geophysics, 176 (2), 925–935. doi:10.1007/s00024-018-2008-5.
- Chargui, S., et al., 2018. Statistical detection and no-detection of rainfall change trends and breaks in semiarid Tunisia—50+ years over the Merguellil agro-hydro-climatic reference basin. Arabian Journal of Geosciences, 11 (21), 675. doi:10.1007/s12517-018-4001-9.
- Cid, N., et al., 2017. High variability is a defining component of Mediterranean-Climate Rivers and Their Biota. Water, 9 (1), 52. doi:10.3390/w9010052.
- Cook, B.I., et al., 2016. Spatiotemporal drought variability in the Mediterranean over the last 900 years. Journal of Geophysical Research: Atmospheres, 121 (5), 2060–2074.
- Corona, R., Montaldo, N., and Albertson, J.D., 2018. On the role of NAO-driven interannual variability in rainfall seasonality on water resources and hydrologic design in a typical Mediterranean Basin. Journal of Hydrometeorology, 19 (3), 485–498. doi:10.1175/JHM-D-17-0078.1.
- Deitch, M., Sapundjieff, M., and Feirer, S., 2017. Characterizing precipitation variability and trends in the world’s Mediterranean-climate areas. Water, 9 (4), 259. doi:10.3390/w9040259.
- Dhurmea, K.R., Boojhawon, R., and Rughooputh, S.D.D.V., 2019. A drought climatology for Mauritius using the standardized precipitation index. Hydrological Sciences Journal, 64 (2), 227–240. doi:10.1080/02626667.2019.1570209.
- Donnelly, C., et al., 2017. Impacts of climate change on European hydrology at 1.5, 2 and 3 degrees mean global warming above preindustrial level. Climatic Change, 143 (1–2), 13–26. doi:10.1007/s10584-017-1971-7.
- Ellouze, M., Azri, C., and Abida, H., 2009. Spatial variability of monthly and annual rainfall data over Southern Tunisia. Atmospheric Research, 93 (4), 832–839. doi:10.1016/j.atmosres.2009.04.005.
- Ennajah, A., et al., 2015. Variation of morphological and structural traits in natural cork oak populations along temperature and precipitation gradient in Northern Tunisia. Journal of Environment and Bio-sciences, 2015 (1), 15–30.
- Eyring, V., et al., 2016. ESMValTool (v1.0) – a community diagnostic and performance metrics tool for routine evaluation of Earth system models in CMIP. Geoscientific Model Development, 9 (5), 1747–1802. doi:10.5194/gmd-9-1747-2016.
- Feki, H., Hermassi, T., and Soualhia, N., 2018. Characterisation of mean monthly rainfall variability over mellegue catchment—Tunisia. In: A. Kallel, M. Ksibi, H. Ben Dhia, and N. Khélifi, eds. Recent advances in environmental science from the euro-mediterranean and surrounding regions. EMCEI 2017. Advances in science, technology & innovation (IEREK Interdisciplinary Series for Sustainable Development). Cham: Springer, 793–795. doi:10.1007/978-3-319-70548-4_232.
- Feki, H., Slimani, M., and Cudennec, C., 2012. Incorporating elevation in rainfall interpolation in Tunisia using geostatistical methods. Hydrological Sciences Journal, 57 (7), 1294–1314. doi:10.1080/02626667.2012.710334.
- Fischer, S., et al., 2019. Do we need more drought for better nutrition? The effect of precipitation on nutrient concentration in East African food crops. Science of the Total Environment, 658, 405–415. doi:10.1016/j.scitotenv.2018.12.181
- Frank, A., et al., 2017. Influence of mathematical and physical background of drought indices on their complementarity and drought recognition ability. Atmospheric Research, 194, 268–280. doi:10.1016/j.atmosres.2017.05.006
- Gader, K., et al., 2015. Study of spatio-temporal variability of the maximum daily rainfall. In: 2015 6th International Conference on Modeling, Simulation, and Applied Optimization (ICMSAO). Istanbul: IEEE, 1–6.
- Gara, A., et al., 2015. Assessment of the hydrological response of the watershed through a distributed physically-based modeling for extreme events: application in the Raghay catchment (Medjerda) (Northern Tunisia). In: 2015 6th International Conference on Modeling, Simulation, and Applied Optimization (ICMSAO). Istanbul: IEEE, 1–6.
- Gara, A., et al., 2019. The added value of spatially distributed meteorological data for simulating hydrological processes in a small Mediterranean catchment. Acta Geophysica, 68, 133–153. doi:10.1007/s11600-019-00379-y.
- Gerstmann, H., et al., 2016. PHASE: A geostatistical model for the Kriging-based spatial prediction of crop phenology using public phenological and climatological observations. Computers and Electronics in Agriculture, 127, 726–738. doi:10.1016/j.compag.2016.07.032
- Gupta, A., Kumari, M., and Rao, B.K., 2017. Spatial and temporal variability analysis using modelled precipitation data in upper catchment of Chambal Basin. Cham: Springer, 75–88.
- Hiez, G., 1977. L’homogénéité des données pluviométriques. Cahiers ORSTOM, Série Hydrologie, 14 (2), 29–173.
- Hsiang, S. and Kopp, R.E., 2018. An economist’s guide to climate change science. Journal of Economic Perspectives, 32 (4), 3–32. doi:10.1257/jep.32.4.3.
- Hui-Mean, F., Yusop, Z., and Yusof, F., 2018. Drought analysis and water resource availability using standardised precipitation evapotranspiration index. Atmospheric Research, 201, 102–115. doi:10.1016/j.atmosres.2017.10.014
- Ionita, M., Scholz, P., and Chelcea, S., 2016. Assessment of droughts in Romania using the standardized precipitation index. Natural Hazards, 81 (3), 1483–1498. doi:10.1007/s11069-015-2141-8.
- IPCC (Intergovernmental Panel on Climate Change), 2014. Climate change 2014: synthesis report. Contribution of working groups I, II and III to the fifth assessment report of the intergovernmental panel on climate change [Core Writing Team, R.K. Pachauri and L.A. Meyer (eds.). IPCC, Geneva, Switzerland, [online]. Available from: http://www.ipcc.ch/report/ar5/wg1/index_fr.shtml [Accessed 17 Aug 2018]
- Jebari, S., et al., 2012. Historical aspects of soil erosion in the Mejerda catchment, Tunisia. Hydrological Sciences Journal, 57 (5), 901–912. doi:10.1080/02626667.2012.685741.
- Jemai, H., et al., 2018. Spatial and temporal variability of rainfall: case of Bizerte-Ichkeul Basin (Northern Tunisia). Arabian Journal of Geosciences, 11 (8), 177. doi:10.1007/s12517-018-3482-x.
- Kendall, M.G., 1975. Rank correlation methods. 2nd impression. London, England: Charles Griffin and Company Ltd. London and High Wycombe.
- Kreibich, H., et al., 2019. How to improve attribution of changes in drought and flood impacts. Hydrological Sciences Journal, 64 (1), 1–18. doi:10.1080/02626667.2018.1558367.
- Kulkarni, P.P. and Pardeshi, S.D., 2019. Evaluation and interpolation of rainfall trends over the semi-arid upper Godavari basin. Meteorology and Atmospheric Physics, 131 (5), 1565–1576. doi:10.1007/s00703-018-0652-z.
- Kundu, S.K. and Mondal, T.K., 2019. Analysis of long-term rainfall trends and change point in West Bengal, India. Theoretical and Applied Climatology, 138 (3–4), 1647–1666. doi:10.1007/s00704-019-02916-7.
- Li, H., et al., 2019. Non-stationary frequency analysis of annual extreme rainfall volume and intensity using Archimedean copulas: A case study in eastern China. Journal of Hydrology, 571, 114–131. doi:10.1016/j.jhydrol.2019.01.054
- Li, X., Zhou, W., and Chen, Y.D., 2015. Assessment of regional drought trend and risk over China: a drought climate division perspective. Journal of Climate, 28 (18), 7025–7037. doi:10.1175/JCLI-D-14-00403.1.
- Liuzzo, L., et al., 2016. Analysis of spatial and temporal rainfall trends in Sicily during the 1921–2012 period. Theoretical and Applied Climatology, 126 (1–2), 113–129. doi:10.1007/s00704-015-1561-4.
- Louvet, S., et al., 2011. Variabilité spatio-temporelle passée et future de la pluie sur le basin du Bani en Afrique de l’Ouest. In: Hydro-climatology: Variability and Change (Proceedings of symposium J-H02 held during IUGG2011 in Melbourne, Australia, July 2011). Australia: IAHS, 125–130.
- MacQueen, J.B., 1967. Mathematical statistics and probability. Berkeley: University of California Press.
- Mann, H.B., 1945. Nonparametric tests against trend. Econometrica, 13 (3), 245. doi:10.2307/1907187.
- Martonne, D., 1926. Une nouvelle function climatologique : L’indice d’aridite. Meteorologie, 2, 449–459.
- Mathbout, S., et al., 2018. Spatial and temporal analysis of drought variability at several time scales in Syria during 1961–2012. Atmospheric Research, 200, 153–168. doi:10.1016/j.atmosres.2017.09.016
- McKee, T.B., Doesken, N.J., and Kleist, J., 1993. The relationship of drought frequency and duration to time scales. In: Eighth Conference on Applied Climatology. Anaheim, CA, 179–184.
- Moussa, T.B., et al., 2019. Progradation and retrogradation of the Medjerda delta during the 20th century (Tunisia, western Mediterranean). Comptes Rendus - Geoscience, 351 (4), 340–350. doi:10.1016/j.crte.2018.10.004.
- Mukherjee, S., Mishra, A., and Trenberth, K.E., 2018. Climate change and drought: a perspective on drought indices. Current Climate Change Reports, 4 (2), 145–163. doi:10.1007/s40641-018-0098-x.
- Nasri, B., et al., 2016. Atmospheric predictors for annual maximum precipitation in North Africa. Journal of Applied Meteorology and Climatology, 55 (4), 1063–1076. doi:10.1175/JAMC-D-14-0122.1.
- Ouatiki, H., et al., 2019. Trend analysis of rainfall and drought over the Oum Er-Rbia River Basin in Morocco during 1970–2010. Arabian Journal of Geosciences, 12 (4), 4. doi:10.1007/s12517-019-4300-9.
- Panda, A. and Sahu, N., 2019. Trend analysis of seasonal rainfall and temperature pattern in Kalahandi, Bolangir and Koraput districts of Odisha, India. Atmospheric Science Letters, 20 (10), 10. doi:10.1002/asl2.v20.10.
- Pettitt, A.N., 1979. A non-parametric approach to the change-point problem. Applied Statistics, 28 (2), 126. doi:10.2307/2346729.
- Rau, P., et al., 2017. Regionalization of rainfall over the Peruvian Pacific slope and coast. International Journal of Climatology, 37 (1), 143–158. doi:10.1002/joc.2017.37.issue-1.
- Rodrigo Comino, J., et al., 2016. High variability of soil erosion and hydrological processes in Mediterranean hillslope vineyards (Montes de Málaga, Spain). CATENA, 145, 274–284. doi:10.1016/j.catena.2016.06.012
- Rysman, J.-F., Lemaître, Y., and Moreau, E., 2016. Spatial and temporal variability of rainfall in the Alps–Mediterranean Euroregion. Journal of Applied Meteorology and Climatology, 55 (3), 655–671. doi:10.1175/JAMC-D-15-0095.1.
- Sahany, S., et al., 2018. Spatio-temporal variability of seasonality of rainfall over India. Geophysical Research Letters, 45 (14), 7140–7147. doi:10.1029/2018GL077932
- Sahin, S., 2012. An aridity index defined by precipitation and specific humidity. Journal of Hydrology, 444-445, 199–208. doi:10.1016/j.jhydrol.2012.04.019
- Sambou, S., Dacosta, H., and Paturel, J.-E., 2018. Variabilité spatio-temporelle des pluies de 1932 à 2014 dans le bassin versant du fleuve Kayanga/Gêba (République de Guinée, Sénégal, Guinée-Bissau). Physio-Géo, (Volume, 12), 61–78. doi:10.4000/physio-geo.5798
- Santos, C.A.G., et al., 2019. Innovative approach for geospatial drought severity classification: a case study of Paraíba state, Brazil. Stochastic Environmental Research and Risk Assessment, 33 (2), 545–562. doi:10.1007/s00477-018-1619-9.
- Santos, C.A.G., et al., 2017. Drought assessment using a TRMM-derived standardized precipitation index for the upper São Francisco River basin, Brazil. Environmental Monitoring and Assessment, 189, 6. doi:10.1007/s10661-017-5948-9
- Sen, P.K., 1968. Estimates of the regression coefficient based on Kendall’s Tau. Journal of the American Statistical Association, 63 (324), 1379–1389. doi:10.1080/01621459.1968.10480934.
- Slimani, M., Cudennec, C., and Feki, H., 2007. Structure du gradient pluviométrique de la transition Méditerranée–Sahara en Tunisie: déterminants géographiques et saisonnalité [Structure of the rainfall gradient transition Mediterranean-Sahara in Tunisia: geographical determinants and seasonality]. Hydrological Sciences Journal, 52 (6), 1088–1102. doi:10.1623/hysj.52.6.1088.
- Sunde, M.G., et al., 2017. Integrating downscaled CMIP5 data with a physically based hydrologic model to estimate potential climate change impacts on streamflow processes in a mixed-use watershed. Hydrological Processes, 31 (9), 1790–1803. doi:10.1002/hyp.v31.9.
- Svoboda, M., Hayes, M., and Wood, D., 2012. Standardized precipitation index user guide. Geneva, Switzerland: World Meteorological Organization.
- Taibi, S., et al., 2017. Relationships between atmospheric circulation indices and rainfall in Northern Algeria and comparison of observed and RCM-generated rainfall. Theoretical and Applied Climatology, 127 (1–2), 241–257. doi:10.1007/s00704-015-1626-4.
- Tramblay, Y. and Hertig, E., 2018. Modelling extreme dry spells in the Mediterranean region in connection with atmospheric circulation. Atmospheric Research, 202, 40–48. doi:10.1016/j.atmosres.2017.11.015
- Tripathi, R., et al., 2015. Characterizing spatial variability of soil properties in salt affected coastal India using geostatistics and kriging. Arabian Journal of Geosciences, 8 (12), 10693–10703. doi:10.1007/s12517-015-2003-4.
- Varouchakis, E.A., et al., 2018. Spatio-temporal analysis of annual rainfall in Crete, Greece. Acta Geophysica, 66 (3), 319–328. doi:10.1007/s11600-018-0128-z.
- Vauchel, P., 2005. Hydraccess/Software/SO HYBAM - the environmental research observatory on the Rivers of the Amazon, Orinoco and Congo Basins. Available from: http://www.mpl.ird.fr/hybam/outils/hydraccess
- Waha, K., et al., 2017. Climate change impacts in the Middle East and Northern Africa (MENA) region and their implications for vulnerable population groups. Regional Environmental Change, 17 (6), 1623–1638. doi:10.1007/s10113-017-1144-2.
- Webster, R. and Oliver, M.A., 2007. Geostatistics for environmental scientists. England: John Wiley & Sons.
- WMO, 2006. Drought monitoring and early warning: concepts, progress and future challenges. Geneva, Switzerland: World Meteorological Organization, 1006.
- Yihdego, Y., Vaheddoost, B., and Al-Weshah, R.A., 2019. Drought indices and indicators revisited. Arabian Journal of Geosciences, 12 (3), 69. doi:10.1007/s12517-019-4237-z.
- Zhao, H., et al., 2019. What were the changing trends of the seasonal and annual aridity indexes in northwestern China during 1961–2015? Atmospheric Research, 222, 154–162. doi:10.1016/j.atmosres.2019.02.012