?Mathematical formulae have been encoded as MathML and are displayed in this HTML version using MathJax in order to improve their display. Uncheck the box to turn MathJax off. This feature requires Javascript. Click on a formula to zoom.
ABSTRACT
In this study, a GIS-based integration of multi-criteria analysis and the Height Above Nearest Drainage (HAND) terrain model was adopted to delineate potential flood hazard zones and vulnerability of the Ogun River Basin, Nigeria. Flood causative factors were used as input for multi-criteria analysis using an analytical hierarchy process (AHP) and weighted overlay in ArcGIS 10.5 to generate potential flood hazard zones. The flood hazard map was overlaid with demographic population data to identify areas where vulnerable people and assets are located. The results show the varying degree of people’s susceptibility to flood hazards. Flood hazard zones were classified into Very High, High, Moderate, Low and Very Low, with area coverage of 1269.40, 14139.50, 7188.40, 17.41 and 0.85 km2, respectively (occupied by 466 290, 355 542, 69 554, 231 and 54 people, respectively). This study serves as a preliminary guide for early warning and policy decision-making for flood disaster risk reduction.
Editor A. CastellarinAssociate editor A. Petroselli
1 Introduction
Flood is one of the most devastating natural hazards, with a high rate of occurrence affecting many countries worldwide and causing huge economic and great human loss annually (Thilagavathi et al. Citation2011; Willby and Keenan Citation2012). Floods are the outcome of complex hydrological, geological and geomorphological conditions, deforestation and urbanization, producing substantial social, economic and environmental damages (Mukherjee and Singh Citation2019, Skilodimou et al. Citation2019). Flood occurrence has increased significantly worldwide in the last three decades (Rozalis et al. Citation2010). Flood disasters are the third most harmful form of geophysical or hydrological disasters when considering the number of deaths recorded (Parker and Cannon Citation2002, Komolafe et al. Citation2019) and it is estimated they have generated more than 30% of all disasters globally between 1945 and 1986 (Glickman et al. Citation1992). The situation is now exacerbated by the changes in the amount, seasonality and event-size distribution of rainfall. As such, there have been increases in the contribution of floods to global natural disasters. Between 1985 and 2009, floods accounted for 40% of the total number of natural disasters, resulting in excessive destruction in terms of economic loss and persons affected (Komolafe et al. Citation2018). Floods are evident in the loss of human life and negative effects on populations, infrastructural damages, damage to crops and animals and loss of ecosystem services, the spread of diseases and water supply contamination (Rincón et al. Citation2018).
In Nigeria, floods account for the most common natural hazards, with severe consequences on life and property (Aderogba Citation2012). Between 1985 and 2018, there were more flood events in Nigeria relative to other West African countries, with six events in 2000 alone, five in 2004 and four in 2011. Nigeria’s deadliest flood in 2012 was reported to have caused the death of 363 people, while two flood events in 2018 resulted in 301 deaths, the second highest since 1985. The flood event of 2012 proved to be most severe, with an estimated 7 million people requiring immediate assistance during the flooding period, the highest number of people affected by any flood event in Nigeria since 1985. The highest estimated economic losses of any flood event in the country were recorded for the 2012 flood event, with a total cost of 500 USD million. This was closely followed by the flood event of 2018, with net damages of 275 USD million (EM-DAT, CREDFootnote1 ).
Overall, since 1985, floods have claimed the lives of 1803 people in Nigeria, the highest in the whole West African region. The total number of people affected by flood disasters in Nigeria between 1985 and 2018 was approximately 10 million, while approx. 0.9 million people were rendered homeless. Overall, between 1985 and 2018 the total number of people affected (including homeless) was 10 429 801 and approx. 922 USD million worth of damages were recorded (EM-DAT CRED).
The Ogun River Basin in southwest Nigeria is subjected to annual flooding. Its proximity to the southern coast and floodplains makes it prone to flooding. The basin is also very vulnerable and at high risk of flood due to the high level of deforestation in the region, which reduces the amount of rainfall intercepted and thereby increases runoff. Likewise, the presence of impervious surfaces as a result of urbanization has led to higher rates of surface runoff (Rincón et al. 2018). Saturated soils, large amounts of suspended matter and inadequate infrastructure for the control of floods and blockage of watercourses are prevalent in the study area and have also increased the susceptibility of the basin to flooding.
The integration of geographic information system (GIS)-based multi-criteria analysis (MCA) in modelling flood-prone areas has become a central feature of flood hazard and vulnerability assessment and management. This is because of the uncertainty and complexity in the decision-making process associated with flood-risk management (de Brito and Evers Citation2016). Such complexity and uncertainty in flood management are due to the interaction of numerous climatic, hydrological, environmental and socio-economic factors, comprising various stakeholders, competing alternatives and different tradeoffs (Schröter et al. Citation2014, Ahmadisharaf et al. Citation2017). Thus, the use of MCA techniques, which can transform multi-criteria problems into a simple measurable format (Ahmadisharaf et al. Citation2016), is vital in flood-risk management. This study, therefore, develops maps of potential flood-hazard zones in the study area using a GIS-based MCA technique.
The use of a GIS-based MCA technique in flood hazard assessment and management has increased considerably in recent decades due to its numerous advantages. Multi-criteria analysis tools deal with the provision of targeted decisions for multiple criteria and objectives, in addition to the knowledge derived from the participation of several actors (Yan et al. Citation2011; Zagonari and Rossi Citation2013). Over the last few decades, successful attempts by many researchers (e.g. Scheuer et al. Citation2015; Shivaprasad Sharma et al. Citation2018) have led to significant improvements in the understanding of flood hazard and exposure; however, only a few studies have attempted flood vulnerability analysis and this greatly hinders flood risk assessment (Jongman et al. Citation2015; Koks et al. Citation2015). Vulnerability is a set of conditions and processes resulting from physical and other factors that increase the susceptibility of a community to the effects of hazards. In this research, combining MCA with GIS allows the integration of the main components of flood-risk assessment and management (hazard, exposure and vulnerability) considering social, economic and environmental dimensions, as well as vulnerability to flooding. This is highly necessary for providing reliable information about the consequences of extreme flood events, particularly in the densely populated and highly urbanized Lagos State.
Numerous studies on floods and water resources in general (Kazakis et al. Citation2015; Chen et al. Citation2015, Vanolya and Jelokhani-Niaraki Citation2019) have employed the analytic hierarchy process (AHP) approach (Saaty Citation1980, Citation1990), which is one of the best-known MCA methods, for solving decision-making problems (Yahaya et al. Citation2010, Majumer Citation2015). The AHP develops a linear additive model from the assumption of complete aggregation among numerous criteria. The weights and scores for each criterion considered are calculated basically by a pairwise comparison matrix between the indicators (Pourghasemi et al. Citation2014). The AHP is considered an optimal method for integrating multiple criteria for special decision-making to generate maps for flood-risk areas with good accuracy (Danumah et al. Citation2016). Although considerable attention has been paid to AHP in recent times for flood risk assessment and management, it is based on the experience, opinions and theoretical knowledge of experts (Pourghasemi et al. Citation2014, Papaioannou et al. Citation2015) and, therefore, may lead to perceptive limitations with ambiguity and bias (Pourghasemi et al. Citation2014).
The Height Above The Nearest Drainage (HAND) terrain model is effective for predicting flood potential distribution (Nobre et al. Citation2015). The HAND model computes the differences in elevation between grid cells and the elevations of the flow paths connected to downslope grid cells through which the flow enters the channel (Nobre et al. Citation2011). The model has been successfully applied in mapping hydrological hazards in the São Paulo metropolitan zone, Brazil, where the relative vertical proximity to rivers functioned as a proxy for flood hazards (Nobre et al. Citation2010). In another study, Cuartas et al. (Citation2012) utilized the model to parameterize areas of soil water saturation in a physically based, distributed hydrological model using topographic data acquired through remote sensing. In our study, in addition to the AHP techniques for MCA flood hazard mapping, the HAND model is employed to provide an objective method for flood hazard assessment. The ensemble of models is expected to produce a more up-to-date and accurate flood-risk map for the study area.
The objective of this study is to delineate potential flood hazard zones and vulnerability of the Ogun River Basin using GIS-based integration of MCA and the HAND model. The AHP approach is employed to evaluate the flood conditioning factors, and the data processing is performed in a GIS environment. The HAND model and its integration with the AHP approach for MCA has not been previously employed in modelling flooding in the study area, which is the major difference between the current research and other flood studies in the region. Finally, the results of the integrated models (a new approach) is validated against historical flood records to obtain a reasonable evaluation of the proposed approach.
2 Study area
The Ogun River Basin, located in southwestern Nigeria, is bordered geographically by latitudes 6°26′–9°10′N and longitudes 2°28′4°8′E (). The Ogun River takes its source from the Igaran hills at an elevation of about 530 m a.m.s.l. and flows directly southwards over a distance of about 480 km before it discharges into the Lagos Lagoon. The major tributaries of the Ogun River are the Ofiki and Opeki rivers. Two seasons are distinguishable in the Ogun River Basin: a dry season from November to March and a wet season between April and October. The two major vegetation zones that can be identified within the watershed are high forest vegetation in the northern and central parts, and swamp/mangrove forests that cover the southern coastal are and flood plains, close to the lagoon. The various land-use classes of the catchment include vegetation, bare soil, rock outcrops, settlements and water bodies.
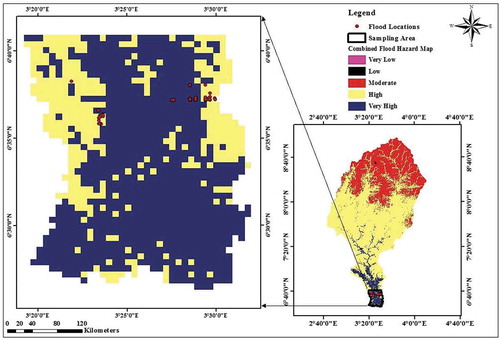
Figure 1. Location of the study area.
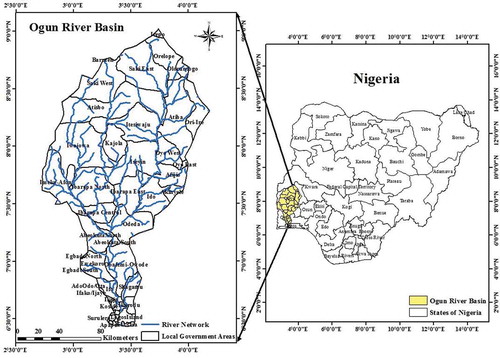
The mean annual precipitation of the study area falls within the interval 1200–1700 mm. The basin falls within the humid sub-tropical region of Nigeria, with an annual temperature ranging between 22 and 36ºC. The Ogun River Basin has an area of about 23 688.98 km2 (2.58% of Nigeria). As a result of high levels of industrialization and urbanization, the population of the basin has increased significantly in recent decades. A significant part of this population occupies the lowland area of Lagos State in the western part of the basin. The Ogun River Basin has been selected due to the severe flood events and losses that have occurred in the basin.
3 Materials and methods
3.1 Data sources and collection
In this study, a wide range of data from various sources are employed in creating spatial criterion layers using geospatial techniques for flood susceptibility mapping (). The detailed characteristics of the datasets used in the study are presented in . Rainfall data are sourced from the Tropical Rainfall Measuring Mission (TRMM) for the period 1998–2017. The Landsat Enhanced Thematic Mapper Plus (ETM+) at a resolution of 30 m is used for land use and land cover (LULC) classification based on the adaptation of level I schema provided by the US Geological Survey (USGS). Data from the Shuttle Radar Topography Mission (SRTM) 30-m digital elevation model (DEM) were downloaded.Footnote2 Population data were sourced from the website of the Center for International Earth Science Information Network (CIESIN), a repository for gridded global demography and socio-economic data (CIESIN Citation2016. Geological formation data were sourced through the USGS. Satellite data are also used for delineating the flood hazard zone by using a geospatial technique (geographical information system, GIS, and remote sensing). Global positioning system data were collected within the flood-prone area for validation of the flood hazard maps.
Table 1. Data used for the analysis of the study area.
Figure 2. Methodological flow chart for the study.
3.2 Flood hazard mapping
We used two methods: a GIS-based decision-making technique and a topo-hydrologic modelling approach (HAND) in generating the flood hazard map of the study area (). In flood hazard mapping and vulnerability analysis, a very important step is the outlining of a series of conditioning and controlling factors. In the first method, a GIS-based MCA technique is applied in flood hazard mapping of the study area. In the second method, the HAND index is used to classify the hydrological response zones of the study area. These are then integrated to produce the final flood hazard zones for the study area. The natural breaks (Jenks) classification method was used to classify the classes of the flood hazard and vulnerability maps.
3.2.1 Flood hazard potential mapping using MCA
Each location has exact features contributing to flood hazard (Tehrany et al. Citation2013) and, as such, researchers should apply factors that have high impacts on flood hazard in their study area for flood vulnerability assessment (Tehrany et al. Citation2014). A review of previous studies relevant to the study area and researchers’ personal experience and physiographical knowledge of the study area from reconnaissance formed the basis of the selected criteria for flood hazard mapping. Flood causative factors such as geology, land use and land cover, slope, 30-m spatial resolution DEM, rainfall, flow accumulation and flow direction are used as input for the MCA using the analytical hierarchy process (AHP) and weighted overlay ArcGIS 10.5 to generate potential flood hazard zones. Weighted overlay analysis entails the development and attachment of weights to criteria used through the use of ArcGIS 10.5. The data are converted into appropriate layers for use within the specified environmental modelling. The raster data format is used as the principal spatial data model for the entire modelling of the environmental parameters. All the flood causative factors are processed in ArcGIS 10.5 using the WGS 1984 UTM ZONE 31 N coordinate system. All the causative factors are reclassified into five susceptibility classes (5: Very High, 4: High, 3: Moderate, 2: Low and 1: Very Low) based on their contribution to the probability of flood occurrence (). Conversion of the factors to five susceptibility class/comparable units is necessary, as the causative factor scales of measurement are different.
Table 2. Classes of the flood vulnerability factors, their ratings and relative importance. LULC: land use/land cover.
3.2.1.1 Factors influencing flood potential in the study area
3.2.1.1.1 Elevation
Elevation analysis is based on the outcome of the development of the DEM. The DEM dataset, of spatial resolution 30 m, is generated from the SRTM using RS techniques (Farr et al. Citation2007). Elevation is an important factor affecting the vulnerability of an area to flooding (Pradhan Citation2009). There is an inverse relationship between elevation and flooding, i.e. the incidence of floods increases with decreasing elevation (Choubin et al. Citation2019). Low-lying areas (gentlest slope regions) have the highest potential flood frequency (see Appendix, ). Elevation has a substantial influence on the spread of floods, in particular on the control of overflow direction movement and the depth of flood (Stieglitz et al. Citation1997). In this study, analysis of elevation reclassification is based on the influence of elevation on the flood.
3.2.1.1.2 Flow direction
The direction of overland flow is influenced by elevation and slope. Water flows from upstream areas to downstream areas. The analysis scoring system shows that the direction of flow toward the downstream area in the study area contributes to high flood events ().
3.2.1.1.3 Flow accumulation
The flow direction raster of the river basin is used as an input in the derivation of flow accumulation. The most critical parameter in delineating flood-risk zones is potential accumulation of flow (Kazakis et al. Citation2015). The flow accumulation is a raster of accumulated flow to each cell, as determined by accumulating the weight for all cells that flow into each downslope cell, which means each cell has an equal discharge profile. As such, greater accumulated flow will result in greater flood susceptibility (Lehner et al. Citation2006). The accumulation of flow at the downstream has a direct event on flood events in the study area ().
3.2.1.1.4 Slope
Slope (%) is generated from the SRTM DEM of the Ogun River Basin. The spatial analysis sub-suite of ArcToolbox in ArcGIS 10.5 is used to extract elevation data of the study area which are used as the main data input for slope generation. Mostly, low lying areas are more susceptible to flooding, as overland flow from mountainous or hilly areas accumulates in low-lying areas during rainfall events. The analysis shows that areas within the lower part of the basin are more prone to flood hazard ().
3.2.1.1.5 Soil type
The soil map of the basin is generated from the FAO Digital Soil Map of the World (DSMW) (FAO Citation2003); this is done by using the basin shapefile to clip extract the soil map of the study area from global soil map. The soil map of the basin shows that six soil types can be identified (). The infiltration rate and water holding capacity of the various soil types determine their susceptibility to flooding. For instance, loamy sand has somewhat coarse texture containing 70–90% sand and has high infiltration rate and low water holding capacity, thus permitting moderate surface runoff and somewhat high susceptibility to flooding. Clay soils have high water holding capacity and low infiltration rate and so have high surface runoff and high flood susceptibility. Therefore, the reclassification of the soil type in the study area is based on the influence of the water holding and infiltration capacity ().
3.2.1.1.6 Rainfall
The mean monthly rainfall data acquired from TRMM are used to produce the rainfall distribution map for the study area. Rainfall is the most important factor responsible for flood occurrence. Overland flow occurs when the rainfall amount exceeds the soil infiltration capacity. The duration and intensity of rainfall play a critical role in the creation of surface runoff and, consequently, flooding. Likewise, the topography, slope, drainage network, soil type and land use have significant influence on surface runoff. The annual rainfall in the Ogun River Basin ranges from 2000 to 3500 mm/year, which has a very high potential to cause flooding and, thus, leads to high flood vulnerability. The scoring analysis for mean rainfall is based on the quantum of rainfall which, is directly proportional to flood hazard within the basin ().
3.2.1.1.7 Land use/land cover
This study employs Operational Land Imager (OLI) satellite data for the land use/land cover classification of the basin. Cloud-free Landsat images covering the basin (path 191, rows 054 and 055 with a spatial resolution of 30 m × 30 m) were obtained from the archives of the US Geological Survey (USGS) (). The two image scenes fall within the path/row: 191/054 and 191/055 of the worldwide reference system from which the data for the study location are extracted using the shapefile of the basin. Supervised classification of the images into different LULC categories was performed in ArcMap 10.5. Five land use/cover types are identified and used in this study, namely (1) bare soil (2) rock (3) settlement (4) vegetation and (5) water bodies. Settlement and rock outcrops contribute the highest to flooding incidence due to their impermeable surface and thus are assigned a relatively large weight compared with other land-use types, such as bare soil and vegetation which can generate lower surface runoff. The classification of LULC of the basin and the subsequent ranking and reclassification of the LULC are based on the inherent capacity to simulate a flood ().
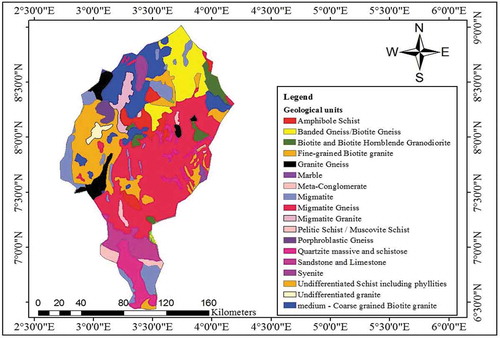
3.2.1.1.8 Geology
The geological map of the basin was extracted from the geological map of Nigeria (1:2 000 000) using the basin shapefile to clip the geological map of Nigeria using the Extract by Mask tool in ArcMap. Eighteen geological units are identified in the study area. The geology of the basin has a significant impact on the origin of surface runoff because it controls the rate at which water infiltrates. Amphibole schist constitutes a large percentage of the basin. Observations from the map show that the geological formations are structurally controlled with respect to water bodies; hence, the potential of flood occurrence within the basin. The reclassification is done according to the characteristics of these geological formations ().
3.2.1.2 Analytical hierarchy process (AHP)
In this study, the AHP developed by Saaty (Citation1990) was employed in assigning weights for the different criteria in the context of MCA. The technique has been widely applied in estimating natural hazard (Fernandez and Lutz Citation2010). In implementing the AHP, pairwise comparison of the flood causative factors () is used to derive the values of criteria weights in terms of their importance in mapping the flood hazard of the basin. In this study, pairwise comparison of the flood causative factors by the authors is based on the best available information from experts coupled with opinions and theoretical knowledge from recent studies. The AHP technique uses a 9-point standard comparison scale, proposed by Saaty (Citation1980), to express individual judgements with respect to the criteria. The 9-point continuous scale comprises of integer numbers 1–9, where 1 denotes Equal importance, 3: Moderate importance, 5: Strong importance, 7: Very strong importance and 9: Extreme importance (with the values 2, 4, 6 and 8 falling in-between) (Saaty Citation1987). In this study, the weights of the various flood causative factors are derived from the construction of an 8 × 8 pairwise comparison matrix. If the factor placed in the column is more important than the other factors placed in the rows, then the value assigned to this factor ranges from 1 to 9. On the other hand, if the parameter in the column is less significant than the parameters in the rows, the value assigned value to this factor varies from 1:2 and 1:9 (Kazakis et al. Citation2015). The diagonal parameters are equal to 1 since the value of each factor is compared to its own value (Kazakis et al. Citation2015, Souissi et al. Citation2019). In this study, the relative importance of the selected factors ranges from 1 (least importance) to 5 (highest importance), as shown in . Linear normalization of the matrix for the pairwise comparison is carried out by summing up all the values from each column and then dividing each component of the matrix by its total. Ultimately, the weights are obtained by calculating the average of the normalized matrix values for each row ().
Table 3. Pairwise comparison matrix for the eight parameters by analytical hierarchy process (AHP).
Table 4. Normalized pairwise comparison matrix for the eight parameters by AHP.
Thereafter, the consistency ratio (CR) is calculated to show whether the evaluations/judgements are sufficiently consistent. The CR is calculated as the ratio of the consistency index (CI) of the pairwise comparison and the CI of a random-like matrix (RI), which depends on the number of causative factors used in the pairwise matrix (Saaty Citation1990, Mahmoud and Gan Citation2018):
where CI is calculated by:
where is the average of the consistency vector and n is the number of causative factors.
The CR of the weights generated (0.016) is less than 0.1 which shows that it falls within the acceptable limit and is sufficient to detect the impact of each criterion on the flood, thus validating the procedure.
Based on the software-derived CR and its associated acceptability, weights are derived from each of the eight criteria for weighted overlay analysis. The weights generated are used in the overlay process to generate the flood hazard zones. presents the weight values of all criteria used in ArcGIS 10.5 to generate the flood hazard map showing varying degrees of intensity. With a weight value of 0.262 (26.2%), rainfall is the criterion with the highest potential to simulate flood in the area. The weights of elevation and flow accumulation, with values of 0.172 and 0.171 (17.2% and 17.1%), respectively, are also important and, therefore, have high potential to simulate flood in the area.
Table 5. Resulting weights of all criteria based on pairwise comparison.
Weighted overlay analysis entails the development and attachment of weights to all the criteria in ArcMap 10.5, in which the influence of each criterion is defined based on the level of impact in the simulation of flood occurrence. Each criterion is reclassified from 1 to 5 using the Reclassify Tool in ArcMap. The class of each criterion that has the highest contribution in support of flooding is rated 5 and decreasingly to 1. After the reclassification, the weighted overlay tool in ArcMap is used to perform the spatial overlay of the reclassified maps using their corresponding weights to generate the flood hazard zone.
3.2.2 Flood modelling using the HAND model
The HAND model represents the hydrological behaviour of the catchment and hillslope. The HAND terrain model normalizes the altitude of a basin based on the relative height along the drainage network and determines the gravitational and the relative drainage potential of an area through two sets of procedures (Nobre et al. 2011). The DEM of the study area and the drainage contributing area serve as input for the HAND index calculation.
The drainage contributing area threshold used in the HAND model flood hazard analysis is determined using the Terrain Analysis Using Digital Elevation Models (TauDEM) (Tarboton et al. Citation2015), which is a set of DEM tools for extracting and analysing hydrologic information from topography as represented by a DEM. The first operation in TauDEM is the Pit Remove tool which is used in creating a hydrologically correct DEM; it identifies all pits in the DEM and raises their elevation to the point where they overflow their confining pour point and drain to edge of the domain. The next step involves the creation of D8 flow direction and slopes for each grid cell. This is performed using the D8 flow direction tool, which uses the hydrological correct elevation grid as input. The next function to run is the D8 Contributing Area; this calculates a grid of contributing areas using the number of grid cells draining through each grid cell based on D8 flow directions. The contributing area outputs inform the threshold value which is used as input in the HAND model flood hazard analysis.
The first procedure in the HAND model involves the creation of a hydrologically coherent DEM, definition of flowpaths and delineation of the drainage channels (see Nobre et al. 2011 for full details). Channel initiation is key to the HAND procedure and is established by an accumulated area threshold (Nobre et al. Citation2016). The second set of procedures in the HAND model is the generation of a nearest drainage map using local drain directions and the stream network (Nobre et al. 2011; Nobre et al. Citation2016). This will eventually guide the HAND operator spatially in the production of the normalized topology of the HAND model.
3.3 Integration of the HAND model and MCA in the development of the Ogun River Basin flood hazard map
A composite map is created by integrating the HAND model flood hazard map and the MCA map. In this integration, the varying degrees of flood hazard are designated as Very High, High, Moderate, Low and Very Low on the output map depicting the area coverage and the exposed population in varying degrees. The percentage of each zone of flood vulnerability is also calculated.
3.4 Flood vulnerability assessment
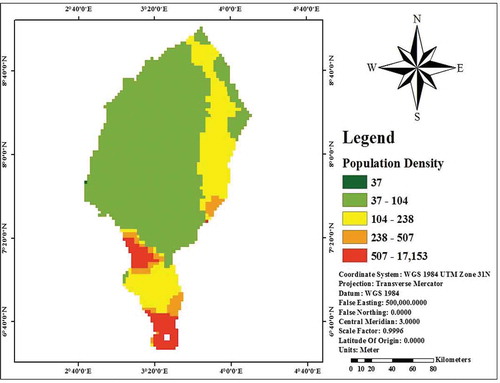
Flood vulnerability assessment is the process of identifying, quantifying and prioritizing (or ranking) the degree of susceptibility to flooding in the study area. As a product of Hazards and Exposure (elements of risk), the degree of flood vulnerability is quantified by combining the final integrated flood hazard map with the population of the study area. Population density is the principal factor used for flood vulnerability and risk mapping. The population count and population density map of the basin were extracted from the population count and population density datasets of the fourth version of Gridded Population of the World (GPWv4; CIESIN Citation2016). The population count grids consist of estimates of the number of persons per 30 arcs (~1 km) grid cell consistent with national censuses and population registers (CIESIN Citation2016). The population density grids are derived by dividing the population count grid for a given target year by the land area grid. The grids represent persons per square kilometre (CIESIN Citation2016). The population data layer () of the basin is overlaid on the integrated flood hazard zone layer to produce the population vulnerability map. The population exposed to varying degrees of flood hazard is obtained and the percentage of exposed population derived.
Figure 3. Population density map of the study area.
4 Results
4.1 Flood causative factors
Various factors considered in the MCA contribute greatly to flooding in the study area. All of the criteria considered for the modelling of flood hazard zones in the Ogun River Basin (Appendix, –) are potentially underlying factors that can trigger flooding in an area. Elevation and slope play important roles in governing the stability of the terrain. Elevation helps in identifying areas that are prone to flooding. For the study area, the elevation map is categorized into five susceptibility classes as follows (see ). Regarding the individual classes (% of area covered), the Very High and High flood susceptibility classes, which are areas with low elevation, occupied 14% and 23% of the study area, respectively. The elevation classes of 197–281 m, 281–363 m and 363–614 m occupied 21, 24 and 17% of the basin, respectively.
Slope has a dominant effect on the contribution of rainfall to streamflow. The slope influences the velocity of water flow and also the direction and amount of surface runoff or subsurface drainage reaching a site. The slope map is divided into five susceptibility classes (see ). The Very High, High, Moderate, Low and Very Low classes occupied 30.9%, 60.9%, 7.0%, 0.93% and 0.23%, respectively. The 0–2.5% and 2.5–6.0% slope classes occupied a total of approximately 92% of the basin, which means that the majority of the basin is highly susceptible to flood hazards. This is due to the fact that steeper slopes are more susceptible to surface runoff while flat terrains are susceptible to waterlogging. Low gradient slopes are vulnerable to flooding occurrence compared to high gradient slopes.
The DEM map () shows that low elevation indicates high water accumulation, which reveals the potential of the area to flooding and the same is applicable to flow accumulation and flow direction. The flow accumulation derived from the flow direction raster is divided into five vulnerability classes ranging from Very Low (0–124980.8 pixels) to Very High (1249808.5–2655843.0 pixels). High flow accumulation regions, due to the buildings and structures situated in such regions, are more prone to flooding as such areas act as convergent points for surface runoff (Mahmoud and Gan Citation2018).
Soil type classifications in the basin are sandy loam, loamy sand, sandy clay loam, loam, clay loam and clay (light) (), with the percentage of area covered 5.0%, 0.9%, 73.7%, 17.7%, 1.3% and 1.3%, respectively. Loamy sand has high infiltration capacity and, thus, is less prone to flooding; however, light clay has a fine texture, high water holding capacity, low infiltration rate and, therefore, is susceptible to flooding. Sandy clay loam, which constitutes the largest proportion of the basin, is moderately susceptible to flooding. Loam, the second largest proportion of the study area, is actually a combination soil, normally equal parts of clay, silt and sand, with moderate to slightly low permeability.
Heavy rainfall is one of the major causes of floods in the study area. The spatiotemporal distribution map of the annual rainfall of the study area was obtained using the inverse distance weighting (IDW) technique. The rainfall map is spatially distributed from the areas proximate to Lagos and Ogun State showing a northward decrease in rainfall amount from 3128.5 to 2084.8 mm. Heavy rainfall is clearly observed in areas such as Ogun and Lagos (Coastal state), making them more vulnerable to flooding. These contribute to extreme flooding as a result of the high mean rainfall experienced in the area. Furthermore, increased urbanization and the presence of more impermeable surfaces is another factor causing more overland flow and flooding incidences in these areas. Generally, almost every part of the basin is susceptible to flooding due to the prevalence of high intensity rainfall which could induce flooding. The annual rainfall in the basin is categorized into five classes on the basis of their contribution to flood occurrence (). For instance, annual rainfall in the range 2084.7–2360.5 m is considered as Very Low, while 3188.0–3463.8 m is considered as Very High on a relative scale of flood contribution in the basin.
Land use/land cover (LULC) is another equally important factor in flood generation. Vegetation is the least flood prone LULC class covering 26.6% of the total area. Bare soil, which predominates in the northern part of the basin, constitutes 63% of the total area and is generally less susceptible to flooding; this is therefore assigned a lower weight. Settlements (3.7%) and rocks (5.8%), due to their impermeable surfaces, can generate more overland flow than vegetation and bare soil; these are therefore assigned relatively large weights. Water bodies (1% of the total area) are obviously the most susceptible land cover class to flooding.
Geology significantly overlaps other earth sciences, including hydrology. The variation in the geological bed formation describes the features of the area in terms of icontribution to flooding. Characteristics of the underlying geology will determine the water percolation and retention and can significantly influence the water balance cycle. The study area comprises Phyllites, Synite, Sandstone and limestone, Quartzite massive and Schistose, Palmitic Schist/Muscovite Schist, which can aid flooding.
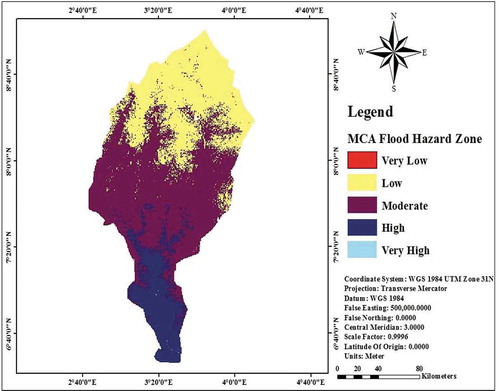
4.2 Flood hazard map based on MCA
The multi-criteria flood hazard map () shows the potential flood hazard zones in the study area. The map was classified in to five classes, namely: Very Low, Low, Moderate, High and Very High flooding zones. presents the calculated area of flood hazard zones and the percentage proportion of each zone in the study area. The MCA flood hazard zones map shows that the moderate hazard zone has the largest area (51.81%) followed by the low hazard zone (34.69%). The high flood hazard zone covers an area of 13.4%, while the very low and very high classes show the least area coverage (0.07% and 0.02%, respectively). The flood hazard map shows a higher exposure to floods in the downstream, while the low flooding areas are in the upstream part of the study area. The areas with high flooding risk are dominated by low slope, low elevation, tertiary sand, large water bodies and high rainfall incidence. The areas include: papa, Eti-Osa, Surulere, Lagos Island, Kosofe, Ikorodu, Ikeja, Ifo, Shagamu, Yewa South, Ewekoro, Obafemi-Owode, Yewa North, Abeokuta South and Abeokuta North. Proximity to the southern coastal area and floodplains, and being next to the lagoon exposes the region to the potential path of floods. The closer areas are to streams, the more susceptible they are to flooding. Eti-Osa, Surulere, Lagos Island, Kosofe, Ikorodu and Ikeja are particularly vulnerable and at high risk of flooding due to the high rate of deforestation which the reduces amount of water intercepted and thereby increases runoff. Likewise, the presence of impervious surfaces as a result of urbanization has led to higher rates of surface runoff (Rincón et al. 2018).
Table 6. Relative distribution of flood hazard classes in the basin using MCA and HAND modelling.
Figure 4. Multi criteria flood hazard map.
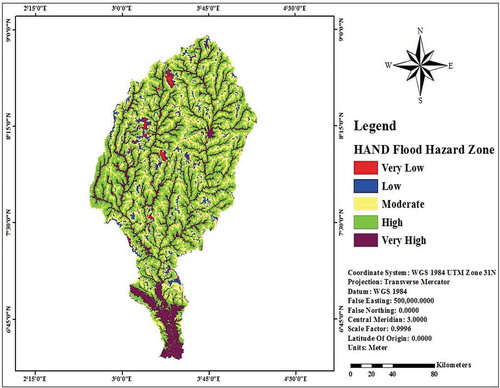
4.3 Flood hazard map generated with the HAND index
shows the hazard intensities in the hierarchical order of impact as regards flood occurrence based on the HAND model. With respect to the HAND flood hazard zones, the smallest area was recorded in the Very Low zone (1.29%). As shown in , 45.99% and 28.51% of the Ogun River Basin belong to the High and Moderate flood hazard classes. The Very High class covers an area of 18.76%, while the Low hazard class has a proportion of 5.45%. The HAND model explains more about the hierarchical order of the impact of floods in the study area because of its greater transparency in classifying hydrological response. It shows the areas that are susceptible to very high flood hazard across the three states: Lagos, Oyo and Ogun. The area with Very High flood hazard intensity includes Apapa, Lagos Island, Kosofe, Ikorodu, Ikeja, Ifo, Shagamu, Yewa South, Ewekoro, Abeokuta South, Itesiwaju and Abeokuta North. Ibarapa Central, Ibarapa North, Ibarapa East, Kosofe Ota, part of Shagamu and Ikeja are shown to be exposed to High flood hazard. The areas exposed to Moderately Low and Very Low flood hazard are few based on the results of the HAND model. Significantly, the Hand index reveals more clearly the river networks and areas that are closed them as potentially Very High hazard zones. These results are close to those expected from a typical flood model. In comparison with the MCA, areas designated as Very High are in agreement with HAND model.
Figure 5. HAND model flood hazard map.
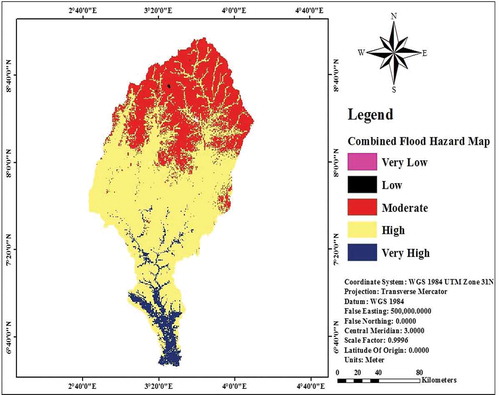
4.4 Integrated MCA and HAND model flood hazard zones
An integrated flood hazard map is generated as a spatial overlay between the MCA flood hazard map and the HAND model generated flood hazard map. The combined flood hazard map (), which produced a better delineation of the flood hazard zones, shows the proportions of areas subjected to varying degrees of flood risk using the Likert Scale of Very Low, Low, Moderate, High and Very High flooding zones. The integrated flood hazard map () shows the overall nature of the are as regards flood occurrence and also presents the hazard intensities in their hierarchical order of impact. As shown in , the whole study area is susceptible to different degrees of flooding. Areas with Very Low, Low and Moderate risk of flooding occupy 31.86% of the total study area (). This is low compared to the areas subjected to High and Very High risk of flooding, which amount to 68.13% of the study area and are basically floodplains (). The areas with high flood hazard intensity include: papa, Eti-Osa, Surulere, Lagos Island, Kosofe, Ikorodu, Ikeja, Ifo, Shagamu, Yewa South, Ewekoro, Obafemi-Owode, Yewa North, Abeokuta South, Abeokuta North and Ibarapa Central (14,139.50 km2). Areas with moderate flood hazard are Ibarapa North, Ibarapa East, Ido, Akinyele, Afijio, Iseyin, Oyo East, Iwajowa, Kajola Oyo West, Itesiwaju and Atiba (7188.40 km2) and those with low flood hazard are Saki West, Saki East, Olorunsogo, Orelope and Irepo (18.26 km2) (). It is worthy of note that the potentially hazardous areas in terms of flooding (Very High and High flood hazard zones) are close to the sea and have well developed infrastructure, which makes them more vulnerable to extreme flood events. These areas have significant effects on the socio-economic activities of the area. Such areas therefore need proactive policy measures for adaptation and flood risk reduction.
Table 7. Integrated MCA and HAND model flood hazard zone, area coverage and exposed population.
Figure 6. Combined multi-criteria and HAND model flood hazard map.
4.5 Flood vulnerability assessment
The population density distribution in the study area shows that the most densely populated areas (507–17 153 persons per km2) fall in the Very High flood hazard zone, 238–507 persons per km2 are within the High flood zone and 104–238 persons per km2 within the Moderate zone. Much smaller numbers (37–104 and 37 persons per km2, respectively) are within the Low and Very Low flood zones (). The percentage of the population exposed to High and Very High flood hazard are 39.87% and 52.29%, respectively, indicating a considerable number of people are prone to displacement from flood (). However, the areas with Very Low hazard have low population with less exposures to flood hazards.Based on the flood hazard map, area coverage and exposed population, our study shows an increase in the susceptibility to flooding, with 5.61% of the area of the Ogun River Basin lying within the Very High risk flood intensity zone and 52.29% of the population being susceptible to Very High flood hazard ().
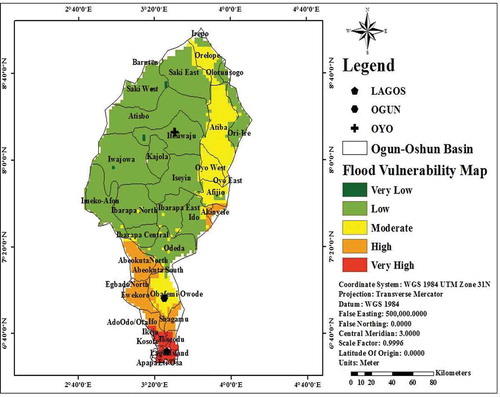
shows the map of the vulnerability assessment in the Ogun River Basin. Overall, the vulnerability to flood disasters in the Ogun River Basin is low. The areas falling within the Very Low and Low vulnerability zones account for 42.8 km2 (0.2%) and 16,082.7 km2 (71.1%) of the basin, respectively. The Moderate vulnerability zone accounts for 3922.6 km2 (17.3%) and the High and Very High vulnerability zones constitute 2068.3 km2 (9.1%) and 499.2 km2 (2.2%) of the study area, respectively. The areas lying adjacent to the Lagos Lagoon are very highly vulnerable to flood hazards; these include Ikeja, Kosofe, Ikorodu Lagos Island and Apapa (). Areas that are highly vulnerable to flood hazard are Abeokuta North, Abeokuta South, Egbado North, Ado Odo, Shagamu and Akinyele, while those that are moderately affected are Oyo West, Atiba, Oyo East, Orelope, and Obafemi Owode in Ogun State. Low and very low vulnerable areas are Kajola, Saki West, Saki East, Iwajowa, Iseyin, Ibarapa East, Ido, Afijio, Ibarapa North Ibarapa East, Ibarapa Central, Odeda and Itesiwaju ().
Figure 7. Flood vulnerability map.
The most vulnerable groups are those who live in the Very High and High flood hazard zones of the study area, which are the highly developed and densely populated areas of the basin. Therefore, flooding events affect more people resulting in casualties, and greater infrastructure damages are recorded. The socio-economic impacts are felt as soon as floods occur, most especially in Lagos and its environs, as floods usually disrupt day-to-day business and activities, with severe economic losses. Climate change and global warming result in an increase in rainfall intensity, which leads to the release of water from Oyan Dam and, consequently, flood occurrence. The flood modelling using the HAND model and multi-criteria analysis described herein indicates that all the criteria used are important model parameters; however, the model is sensitive in terms of varying degree of flood hazard zone to capture the extent of flooding in the area.
5 Discussion
A comparison between the potential flood hazard area in the MCA and HAND index flood hazard map shows that there is a difference in the flood hazard zones obtained in the study area between the two methods. The flood hazard map generated by MCA technique presents a greater amount of area in the low and moderate flood hazard classes, while the HAND index flood hazard map presents a larger amount of area in the moderate and high flood hazard classes. In this study, the MCA technique applied shows that rainfall, elevation and flow accumulation have greater influence on flood occurrence in the basin. This is not surprising as flood occurrences are mostly due to excessive water and the topographical features of the study area. Findings by Mahmoud and Gan (Citation2018) showed runoff and flow accumulation to be the dominant factors. Kazakis et al. (Citation2015) and Souissi et al. (Citation2019) revealed elevation to be of bigger impact. In other research studies, Vojtek and Vojteková (Citation2019) showed slope and river density as the dominant factors, while in the study conducted by Al-Abadi (Citation2016), stream power index (SPI) is the central factor. Studies have shown that AHP is appropriate for regional studies (Souissi et al. Citation2019) but it is dependent on the characteristics of the locality. It is a simple, cost effective and optimal method with a high degree of accuracy for integrating several factors for decision making to create a flood hazard map (Danumah et al. Citation2016). However, this technique may have some elements of ambiguity and bias as it depends on the experience, opinions and knowledge of experts (Pourghasemi et al. Citation2014). Furthermore, large number of data are required to obtain rational results.
The HAND index technique is a suitable model for depicting the likelihood of flooding in an area considering the physical parameters (the upstream area and the height and distance from the drainage system) of the basin only (Rennó et al. Citation2008; Nobre et al. 2011). This model has been successfully used in other studies to map the potential extent of floods (Nobre et al. 2011; Nobre et al. Citation2015) and to parameterize areas of soil water saturation in a physically based, distributed hydrological model (Cuartas et al. Citation2012). Similarly, in the study by Pérez-Mesa (Citation2014) in the Magdalena River, Colombia using the HAND index model, the author discovered that when the drainage channel shape was “burned” into the HAND model, of which analysis was based on the flood wave conveying channel, it gave a very accurate prediction of the inundation extent without any observable overestimation. Nevertheless, other features such as rainfall, reservoir spills, surface type and small drainage systems that are not included in the HAND system may also affect the risk of flooding and should therefore also be taken into consideration. In this study, the use of MCA AHP has taken into account some of these characteristics.
In order to improve the mapping of flood hazard occurrence in the basin, the two maps are combined to generate an integrated flood hazard map. The performance and accuracy of the integrated flood hazard map (), produced by spatial overlay of the MCA and HAND flood hazard maps, was evaluated against inventory flood incidences in the basin. The flood inventory, obtained from a previous flood survey carried out in the downstream part of the basin, was overlaid on the integrated flood hazard map () and flood incidences within each zone summarized and evaluated. Due to the lack of data, 71 flood samples were obtained from in the study area in places with flood depth of 0.5 m. These were employed in validating the integrated flood hazard map of the basin, i.e. to study and authenticate the consistency of the result obtained from the integration of the MCA and HAND models. The High flood hazard zone accounted for approximately 65% of the total number of flood samples, while the remaining 35% was found to be in the Very High flood hazard zone. This demonstrates the practicality of the flood map generated from the integration of the two models.
Figure 8. Validation of flood hazard map.
6 Conclusion
In this study, the development of flood hazard zones in varying degrees of intensity, for the Ogun River Basin area, Nigeria, was carried out based on multi-criteria evaluation (MCA), the HAND model and the integration of the HAND model and MCA using a geospatial technique. The selected criteria cover aspects of natural and anthropogenic criteria; thus they are suitable to model flood hazard in the study area. The results presented provide a medium for proper flood disaster management, flood prediction, mitigation and vulnerability assessment of the flood-related areas to losses and damage. More appropriately, the study reveals that elevation, rainfall, flow accumulation and slope are the most germane criteria for flood modelling. Therefore, in flood disaster management for urban planning, these criteria should be considered paramount in delineating potential flood hazard zones and the varying degrees of flooding intensity they might be subject to.
From the delineated flood hazard map, just over 52% of the area of Ogun River Basin area is exposed to Very High flood hazard, about 40% to High flood hazard, and about 8% to Moderate flood hazard; just 0.03% and 0.01% of the population are considered to be vulnerable to Low and Very Low flood hazard, respectively. The vulnerability map of the study area shows that parts of Lagos State are in zones of Very High vulnerability to flood hazard due to the Ogun River; part of Ogun State and a small portion of Oyo State are in Highly vulnerable flood hazard zones, while those that are Moderately vulnerable include small portions of Ogun State and Oyo State. A large portion of Ogun State is in the Low vulnerability zone. The integrated flood hazard map was compared against the flood survey points to ascertain the performance and accuracy of the approach; 65% of the sampled points overlapped with the High hazard zones, while the remaining 35% fell under the Very High hazard zones, thus affirming the efficacy of the procedure adopted. For decision making, it is recommended that a warning system is introduced to alert those within the affected areas of imminent flood events. These areas, most especially Lagos, which the modelling indicates is in the Very High flood hazard zone, and Ogun state, in the High flood hazard zone, are to be given greater priority in terms of notice and preventive measures.
Disclosure statement
No potential conflict of interest was reported by the authors.
Notes
1 EM-DAT, Centre for Research on the Epidemiology of Disasters: Emergency events database, Université catholique de Louvain, Belgium: www.emdat.be [Accessed 21 April 2020].
References
- Aderogba, K.A., 2012. Qualitative studies of recent floods and sustainable growth and development of cities and towns in Nigeria. Int. J. Basic Applied Sci., 1, 200–216.
- Ahmadisharaf, E., Kalyanapu, A.J., and Chung, E.-S., 2016. Spatial probabilistic multi criteria decision making for assessment of flood management alternatives. Journal of Hydrology, 533, 365–378. doi:10.1016/j.jhydrol.2015.12.031
- Ahmadisharaf, E., Kalyanapu, A.J., and Chung, E.-S., 2017. Sustainability based flood hazard mapping of the Swannanoa River watershed. Sustainability, 9, 1735. doi:10.3390/su9101735
- Al-Abadi, A.M., Shahid, S., and Al-Ali, A.K., 2016. A GIS-based integration of catastrophe theory and analytical hierarchy process for mapping flood susceptibility: a case study of teeb area, southern iraq. Environmental Earth Sciences, 75, 687. doi:10.1007/s12665-016-5523-7
- Chen, H., et al., 2015. Flood hazard assessment in the kujukuri plain of chiba prefecture, japan, based on gis and multicriteria decision analysis. Nat. Hazards, 78 (1), 105–120. doi:10.1007/s11069-015-1699-5
- Choubin, B., et al., 2019. An ensemble prediction of flood susceptibility using multivariate discriminant analysis, classification and regression trees, and support vector machines. The Science of the Total Environment, 651, 2087–2096. doi:10.1016/j.scitotenv.2018.10.064
- CIESIN (Center for International Earth Science Information Network), 2016. Documentation for the Gridded Population of the World, Version 4 (GPWv4). Palisades, NY: NASA Socioeconomic Data and Applications Center (SEDAC). doi:10.7927/H4D50JX4
- Cuartas, L.A., et al., 2012. Distributed hydrological modeling of a micro-scale rainforest watershed in Amazonia: model evaluation and advances in calibration using the new HAND terrain model. Journal of Hydrology, 462 (463), 15–27. doi:10.1016/j.jhydrol.2011.12.047
- Danumah, J.H., et al., 2016. Flood risk assessment and mapping in abidjan district using multi-criteria analysis (AHP) model and geoinformation techniques, (cote d’ivoire). Geoenvironmental Disasters, 3, 10. doi:10.1186/s40677-016-0044-y
- de Brito, M.M., and Evers, M., 2016. Multi-criteria decision-making for flood risk management: a survey of the current state of the art. Nat. Hazards Earth Syst. Sci., 16, 1019–1033. doi:10.5194/nhess-16-1019-2016
- FAO (Food and Agriculture Organization of UNESCO), 2003. The digitized soil map of the world and derived soil properties. (version 3.5) FAO Land and Water Digital Media Series 1. Rome, Italy: FAO.
- Farr, T.G., et al., 2007. The shuttle radar topography mission. Reviews of Geophysics, 45, 1–33. doi:10.1029/2005RG000183
- Fernandez, D.S. and Lutz, M.A., 2010. Urban flood hazard zoning in Tucum an Province, Argentina, using GIS and multicriteria decision analysis. Engineering Geology, 111, 9098. doi:10.1016/j.enggeo.2009.12.006
- Glickman, T. S., Golding, D., and Silverman, E. D., 1992. Acts of god and acts of man: re‑ cent trends in natural disasters and major industrial accidents. Washington, DC: Resources for the Future, Center for Risk Management, Discussion Paper 92–02.
- Jongman, B., et al. 2015. Declining vulnerability to river floods and the global benefits of adaptation. Proc. Natl. Acad. Sci., 201414439. doi:10.1073/pnas.1414439112
- Kazakis, N., Kougias, I., and Patsialis, T., 2015. Assessment of flood hazard areas at a regional scale using an index-based approach and analytical hierarchy process: application in Rhodopee Evros region, Greece. The Science of the Total Environment, 538, 555–563. doi:10.1016/j.scitotenv.2015.08.055
- Koks, E. E., et al., 2015. Combining hazard, exposure and social vulnerability to provide lessons for flood risk management. Environ. Sci. Policy, 47, 42–52. doi:10.1016/j.envsci.2014.10.013
- Komolafe, A.A., et al., 2019. Comparative analyses of flood damage models in three Asian countries: towards a regional flood risk modelling. Environment Systems and Decisions, 39, 229–246. doi:10.1007/s10669-0189716-3
- Komolafe, A.A., Herath, S., and Avtar, R., 2018. Methodology to assess potential flood damages in urban areas under the influence of climate change. Natural Hazards Review, 19 (2), 05018001. doi:10.1061/(ASCE)NH.1527-6996.0000278
- Lehner, B., Verdin, K., and Jarvis, A., 2006. Hydro sheds technical documentation. Washington, DC: World Wildlife Fund US. Available from: http://hydrosheds.cr.usgs.gov
- Mahmoud, S.H. and Gan, T.Y., 2018. Multi-criteria approach to develop flood susceptibility maps in arid regions of Middle East. Journal of Cleaner Production, 196, 216–229. doi:10.1016/j.jclepro.2018.06.047
- Majumer, M., 2015. Multi criteria decision making. In: Impact of urbanization on water shortage in face of climatic aberrations. New York, NY: Springer, 35–48. ISSN 2194-7244. Available from: https://www.springer.com/gp/book/9789814560726?utm_campaign=bookpage_about_buyonpublisherssite&utm_medium=referral&utm_source=springerlink#otherversion=9789814560733
- Mukherjee, F. and Singh, D., 2019. Detecting flood prone areas in Harris County: a GIS based analysis. GeoJournal. doi:10.1007/s10708-019-09984-2
- Nobre, A. D., et al., 2011. Height above the nearest drainage – a hydrologically relevant new terrain model. Journal of Hydrology, 404, 13–29. doi:10.1016/j.jhydrol.2011.03.051
- Nobre, A.D., et al., 2015. HAND contour: a new proxy predictor of inundation extent. Hydrological Processes. doi:10.1002/hyp.10581
- Nobre, A.D., et al., 2016. Height above the nearest drainage – a hydrologically relevant new terrain model. Journal of Hydrology, 404 (2011), 13–29. doi:10.1016/j.jhydrol.2011.03.051
- Nobre, C.A., et al., 2010. Vulnerabilidades das Megacidades Brasileiras às Mudanças Climáticas: região Metropolitana de São Paulo. São Paulo. Inpe; Unicamp; Usp; Ipt; Unesp- Rio Claro. Available from:https://cetesb.sp.gov.br/proclima/wp-content/uploads/sites/36/2014/05/1_megacidades.pdf
- Papaioannou, G., Vasiliades, L., and Loukas, A., 2015. Multi-criteria analysis framework for potential flood prone areas mapping. Water Resource Management, 29, 399–418. doi:10.1007/s11269-014-0817-6
- Parker, D.J. and Cannon, T., 2002. Vulnerability analysis and disasters, floods. Vol. I. London and New York: Routledge, 45–55.
- Pérez, M., and Gabriel, J., 2014. Propuesta metodológica para la estimación de zonas de inundación con información escasa por medio de descriptores geomorfométricos derivados de modelos digitales de elevación. Maestría thesis. Universidad Nacional de Colombia - Sede Medellín.
- Pourghasemi, H.R., Beheshtirad, M., and Pradhan, B., 2014. A comparative assessment of prediction capabilities of modified analytical hierarchy process (M-AHP) and Mamdani fuzzy logic models using Netcad-GIS for forest fire susceptibility mapping. Geomatics, Natural Hazards and Risk, 7 (2), 861–885. doi:10.1080/19475705.2014.984247
- Pradhan, B., 2009. Flood susceptible mapping and risk area delineation using logistic regression, GIS and remote sensing. Journal of Spatial Hydrology, 9, 1–18.
- Rennó, C.D., et al., 2008. HAND, a new terrain descriptor using SRTM-DEM; mapping terra-firme rainforest environments in Amazonia. Remote Sensing of Environment, 112 (3469), 3481. doi:10.1016/j.rse.2008.03.018
- Rincón, D., Khan, U.T., and Armenakis, C., 2018. Flood risk mapping using gis and multi-criteria analysis: a greater toronto area case study. Geosciences, 8, 275.
- Rozalis, S., et al., 2010. Flash flood prediction using an uncalibrated hydrological model and radar rainfall data in a Mediterranean watershed under changing hydrological conditions. Journal of Hydrology, 394 (1), 245–255. doi:10.1016/j.jhydrol.2010.03.021
- Saaty, T.L., 1980. The analytic hierarchy process: planning, priority setting, resource allocation. New York: McGraw-Hill.
- Saaty, T.L., 1987. The analytic hierarchy process: what it is and how it is used, Math. Model, 9, 161–176. doi:10.1016/0270-0255(87)90473-8
- Saaty, T.L., 1990. How to make a decision: the analytic hierarchy process. European Journal of Operational Research, 48, 9–26. doi:10.1016/0377-2217(90)90057-I
- Scheuer, S., Haase, D., and Meyer, V., 2015. Exploring multicriteria flood vulnerability by integrating economic, social and ecological dimensions of flood risk and coping capacity: from a starting point view towards an end point view of vulnerability. Nat. Hazards, 58 (2), 731–751. doi:10.1007/s11069-010-9666-7
- Schröter, K., et al., 2014. How useful are complex flood damage models? Water Resources Research, 50, 3378–3395. doi:10.1002/2013WR014396
- Shivaprasad Sharma, S.V., et al., 2018. Flood risk assessment using multi-criteria analysis: a case study from Kopili River Basin, Assam, India. Geomatics, Natural Hazards and Risk, 9 (1), 79–93. doi:10.1080/19475705.2017.1408705
- Skilodimou, H.D., et al., 2019. Multi-hazard assessment modeling via multi-criteria analysis and GIS: a case study. Environmental Earth Sciences, 78 (2), 47. doi:10.1007/s12665-018-8003-4
- Souissi, D., et al., 2019. GIS based MCDM - AHP modeling for flood susceptibility mapping of arid areas, southeastern Tunisia. Geocarto International, 1–27. doi:10.1080/10106049.2019.1566405
- Stieglitz, M., et al., 1997. An efficient approach to modelling the topographic control of surface hydrology for regional and global climate modeling. Journal of Climate, 10, 118–137. doi:10.1175/1520-0442(1997)010<0118:AEATMT>2.0.CO;2
- Tarboton, D.G., Sazib, N., and Dash, P., 2015. TauDEM 5.3 Quick start guide to using the Taudem Arcgis toolbox. Available from: http://hydrology.usu.edu/taudem/taudem5/TauDEM53GettingStartedGuide.pdf [Accessed 23 January 2019].
- Tehrany, M.S., et al., 2014. Flood susceptibility mapping using integrated bivariate and multivariate statistical models. Environmental Earth Sciences, 72, 4001–4015. doi:10.1007/s12665-014-3289-3
- Tehrany, M.S., Pradhan, B., and Jebur, M.N., 2013. Spatial prediction of flood susceptible areas using rule-based decision tree (DT) and a novel ensemble bivariate and multivariate statistical models in GIS. Journal of Hydrology, 504, 69–79. doi:10.1016/j.jhydrol.2013.09.034
- Thilagavathi, G., et al., 2011. Application of gis in flood hazard zonation studies in papanasam taluk, thanjavur district, tamilnadu. Advances in Applied Science Research, 2 (3), 574–585.
- Vanolya, N.M., and Jelokhani-Niaraki, M., 2019. The use of subjective–objective weights in GIS-based multi-criteria decision analysis for flood hazard assessment: a case study in Mazandaran, Iran. GeoJournal. doi:10.1007/s10708-019-10075-5
- Vojtek, M. and Vojteková, J., 2019. Flood susceptibility mapping on a national scale in Slovakia using the analytical hierarchy process. Water, 11, 364. doi:10.3390/w11020364
- Wilby, R., and Keenan, R., 2012. Adapting to flood risk under climate change. Progress in Physical Geography, 36 (3), 348–378.
- Yahaya, S., Ahmad, N., and Abdalla, R.F., 2010. Multi-criteria analysis for flood vulnerable areas in Hadejia-Jama’are River basin, Nigeria. European Journal of Scientific Research, 42 (1), 71–83.
- Yan, H.B., Huynh, V.N., and Nakamori, Y., 2011. A probabilistic model for linguistic multiexpert decision making involving semantic overlapping. Expert Syst. Appl., 38 (7), 8901–8912. doi:10.1016/j.eswa.2011.01.105
- Zagonari, F., and Rossi, C., 2013. A heterogeneous multi-criteria multi-expert decision support system for scoring combinations of flood mitigation and recovery options. Environ. Model. Softw., 49, 152–165. doi:10.1016/j.envsoft.2013.08.004
Appendix
Figure A1. Flood hazard criteria: DEM.
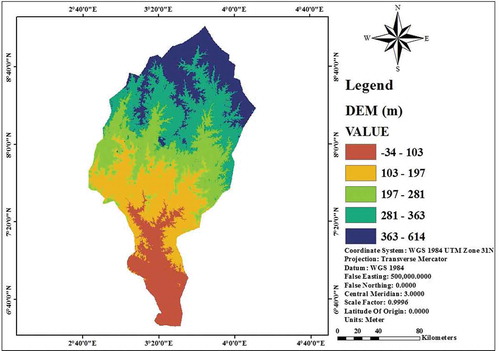
Figure A2. Flood hazard criteria: flow direction.
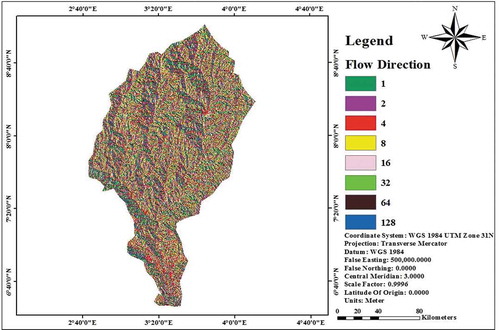
Figure A3. Flood hazard criteria: flow accumulation. Yellow: low flow accumulation areas; blue and green: high flow accumulation.
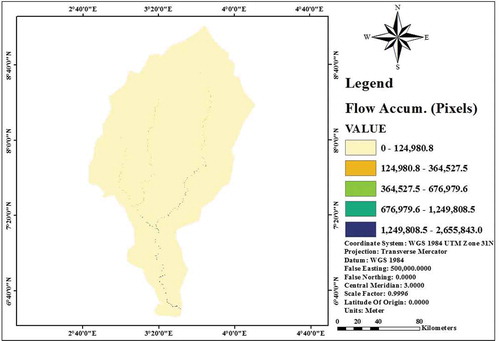
Figure A4. Flood hazard criteria: slope.
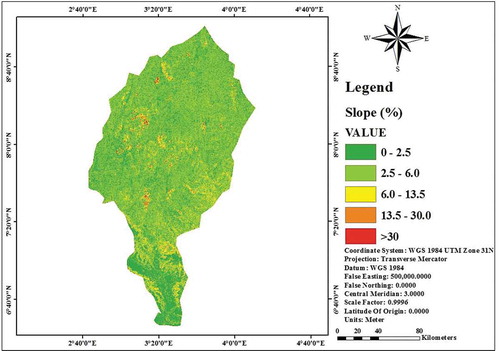
Figure A5. Flood hazard criteria: soil type.
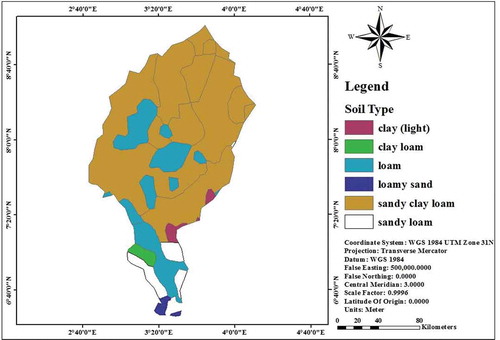
Figure A6. Flood hazard criteria: mean rainfall (mm).
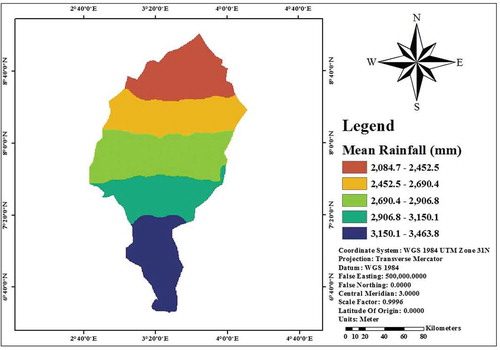
Figure A7. Flood hazard criteria: land-use type.
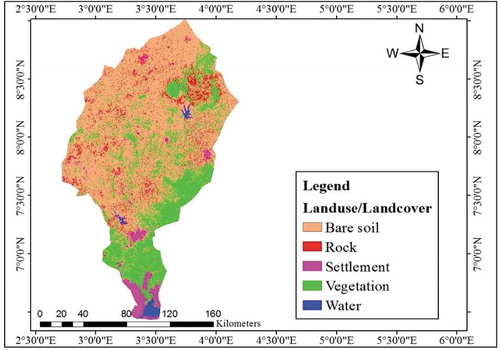
Figure A8. Flood hazard criteria: geology.