
 ?Mathematical formulae have been encoded as MathML and are displayed in this HTML version using MathJax in order to improve their display. Uncheck the box to turn MathJax off. This feature requires Javascript. Click on a formula to zoom.
ABSTRACT
A rainfall–runoff model was employed to identify four major flood-generating processes corresponding to flood events identified from daily discharge data from 614 stations across Europe in the period 1961–2010: long-rain, short-rain, snowmelt, and rain-on-dry-soil flood events. Trend analyses were performed on the frequency of occurrence of each of the flood types continentally and in five geographical regions of Europe. Continentally, the annual frequency of flood events did not show a significant change over the investigation period. However, the frequency of both winter and summer long-rain events increased significantly, while that of summer snowmelt events decreased significantly. Regionally, the frequency of winter short and long-rain events increased significantly in Western Europe, while the frequency of summer snowmelt and short-rain events decreased in Northern Europe. The frequency of summer snowmelt events in Eastern Europe and winter short-rain events in Southern Europe showed a declining trend.
Editor S. Archfield Associate editor K. Ryberg
1 Introduction
The occurrence of devastating floods in different parts of Europe in the past decades has raised interest in scrutinizing and understanding their underlying causes (e.g. Ulbrich et al. Citation2003a, Citation2003b; Marsh Citation2008, Blöschl et al. Citation2013, Citation2016, Citation2017, Schröter et al. Citation2015). While these studies analysed the meteorological and hydrological conditions that caused specific events, another group of studies focused on assessing whether there has been an increase in the frequency and magnitude of flooding in Europe over the past decades (Hall et al. Citation2014, Mediero et al. Citation2015, Mangini et al. Citation2018, Blöschl et al. Citation2019). Many of the studies detected significant changes in the flood regime in different parts of Europe, although the pattern of changes was found to be regionally different (Hall et al. Citation2014, Blöschl et al. Citation2015, Citation2017, Citation2019).
It is worthwhile to identify the process controls of flooding and attribute detected changes in flooding to possible changes in their process controls. Understanding the process controls of flooding and their changes is a key to flood-risk management since the flood mitigation measures that need to be taken as part of the flood management depend on the processes involved in the flood generation (Kundzewicz et al. Citation2014, Blöschl et al. Citation2015, Berghuijs et al. Citation2019). The reliability of flood prediction and risk assessment can also be enhanced if information on process controls is incorporated into the analyses (Loukas et al. Citation2000, Merz and Blöschl Citation2008, Rogger et al. Citation2012).
Attribution of changes in flooding to their process controls has mainly been done by performing a parallel trend analysis on certain statistical characteristics of the process controls that might have undergone a change over a similar time period and hypothesizing that the changes in the controls are responsible for the detected changes in flooding (Merz et al. Citation2012). Several studies have tried to attribute changes in flooding using such an approach to changes in precipitation (Pinter et al. Citation2006, Hattermann et al. Citation2013, Blöschl et al. Citation2019), temperature (Hattermann et al. Citation2013, Blöschl et al. Citation2019), flood prone large scale circulation patterns (Hattermann et al. Citation2013), and land use (van der Ploeg and Schweigert Citation2001, Pinter et al. Citation2006, Prosdocimi et al. Citation2015).
While the above approach of attribution offers useful information on the potential causes of the detected changes in flooding, the attribution exercise would be more enlightening if it were performed by identifying the process controls of the individual flood events and carrying out assessment of changes in the identified process controls. There are several studies that investigated the meteorological and hydrological process controls of flood generation at different spatial scales. Nied et al. (Citation2013) and Rogger et al. (Citation2013), for instance, investigated the role of catchment soil moisture in the generation of floods. Sui and Koehler (Citation2001) assessed the importance of snowmelt and rain-on-snow in the generation of peak flows. Similarly, McCabe et al. (Citation2007) investigated the importance of rain-on-snow on flooding. The role of synoptic atmospheric processes was studied by Parajka et al. (Citation2010) and Prudhomme and Genevier (Citation2011), among others.
The above studies were limited to assessing the importance of a single flood-generating process. However, several flood-generating processes may occur within a catchment and identifying the relative importance of each of the processes and their evolution in time can help to understand the dynamics of the flood change for a given region. There are, nevertheless, studies that investigated the importance of more than a single process through classification of flood events using their driving hydro-meteorological inputs and catchment states such as soil moisture and snow/glacier cover (Merz and Blöschl Citation2003, Sikorska et al. Citation2015, Berghuijs et al. Citation2016, Citation2019, Turkington et al. Citation2016, Keller et al. Citation2018, Tarasova et al. Citation2019). Most of these studies tried to assess the importance of the different flood-generating processes for the study areas they focused on. One needs, however, to investigate the changes in the frequency of occurrence of the different processes when attributing changes in flooding.
Many of the European studies on changes in flooding were performed at catchment or national scales. A large-scale assessment, on the other hand, would offer valuable information on a regional pattern of flood risk, which could potentially facilitate coordination of regional flood-risk management, as is emphasized by the European Flood Directive (EU Citation2007). Constructing a larger picture at a continental scale from local studies is often difficult since the approaches followed and the database used in the different local studies are often different (Hall et al. Citation2014). There is, therefore, an increasing importance placed on a regional research effort. Although continental scale studies on past changes in the frequency and magnitude of potentially flood causing extremes are available for Europe (e.g. Mediero et al. Citation2015, Mangini et al. Citation2018, Blöschl et al. Citation2019), studies that characterized flood events in terms of their generating mechanisms and investigated how the different mechanisms have evolved in time are not available at the continental scale.
The aim of this study is to investigate whether there have been changes in the frequency of flood events across Europe over the past five decades and whether the changes can be attributed to changes in the underlying flood-generating mechanisms. We identify flood events from daily discharge data from selected observation stations across Europe and describe them in terms of their main generating mechanisms by analysing their underlying hydro-meteorological and hydrological catchment states. By making use of consistent datasets and analysis approach, we explore the relative role of rainfall processes, snow melting and river basin state of soil moisture to identify the flood-generation mechanisms. We employ a regional hydrological model forced by reanalysis data to estimate state variables, such as soil moisture deficit, snow water equivalent and snowmelt, which we use to characterize the identified flood events. We investigate the regional pattern of the dominant flood-generating mechanisms and assess their temporal evolution over the past five decades. We finally try to compare our results with previous local and regional studies carried out on the assessment and attribution of changes in flooding.
2 Data and method
2.1 Data
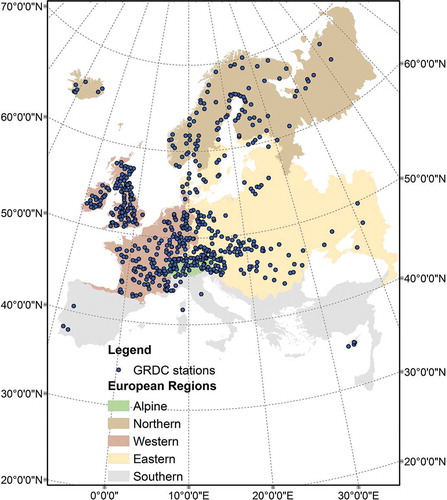
Pan-European open datasets of discharge, meteorological forcing, and physiographic characteristics were employed in the study (). Daily discharge time series from 747 GRDC (Global Runoff Data Centre) stations with drainage areas ranging between 7 and 807 000 km2 were used. The length of datasets at the stations is variable, with an average length of 54 years. After screening stations that have data for at least 90% of the investigation period (1961–2010), 614 stations were kept for further analysis (see ). As shown in , the study area is divided into five regions: Alps, Northern, Western, Eastern, and Southern Europe (see Section 2.5 for details).
Table 1. List of open data used in the study and their sources.
Figure 1. Hydro-climatological regions of Europe and location of 614 GRDC stations used in the study.
A hydrological model was employed for the simulation of hydrological state variables that are used for flood type classification (see Section 2.3). Different open datasets were used to set up the hydrological model (Hundecha et al. Citation2016). Hydrological response units (HRUs) within each sub-catchment were derived from land-use and soil data obtained from different sources (). It is to be noted that land-use data were derived from the CORINE land-use data and GlobCover data were used where CORINE does not have coverage. Furthermore, the WFDEI meteorological forcing dataset covers the period starting from 1979 and the WATCH forcing dataset was used for the period before 1979. The concatenated dataset was evaluated for possible inhomogeneities at each sub-catchment and no significant inhomogeneity was detected.
2.2 Selection of flood events
Flood events were selected in two stages. In the first stage, independent peak flows were identified at each gauging station. In the second stage, events that are potentially associated with flooding were selected from the identified independent peaks based on thresholds defined using flow recurrence intervals. The independence of events selected at different stations was assessed based on a set of criteria and dependent events were grouped into a single spatially coherent flood event. The procedure is detailed in the following sub-sections.
2.2.1 Independent peak-flow events at stations
Independent peak flows at each gauging station were identified from the daily discharge time series by employing a baseflow separation technique. We applied the Chapman digital filter (Chapman Citation1999), which estimates baseflow as a simple weighted average of the direct runoff and the baseflow at the previous time interval, i.e.
where Qb(i) and Qd(i) are the baseflow and direct runoff, respectively, at time step i and the parameter k is the recession constant during periods of no direct runoff. If a given discharge Q(i) represents the sum of baseflow Qb(i) and direct runoff Qd(i), then Qb(i) can be estimated as:
Estimation of the recession constant k for each catchment follows the approach of Vogel and Kroll (Citation1996) (see also Thomas et al. Citation2013). The approach consists of the following steps:
Identify the start of discharge recession when a 3-day moving average begins to decrease and the end of recession when a 3-day moving average begins to increase.
Select recessions with length larger than or equal to 10 days.
Remove the first three points of the recession to eliminate effects of averaging;
Fit the model ln(Q) = ln(Q0) + ln(k)*t + error, for each recession using the ordinary-least-squares method, i.e., estimate k for individual events.
Estimate the mean recession constant k of all the analysed recessions.
Once the recession constant is estimated, timeseries of Qb(i) and Qd(i) are computed and independent peak-flow events are separated as follows. Discharge blocks separated by intervals in which the direct runoff is lower than the baseflow or the mean annual direct runoff (the latter criterion being introduced to eliminate cases where discharge or baseflow equals zero) are considered as independent events. The start and end dates of these discharge blocks are used as the start and end dates of the peak-flow event. The maximum discharge value within each event is then selected as an independent peak flow.
2.2.2 Spatially grouped flood events
Peaks identified at different gauging stations may not be independent. The same hydro-meteorological event may be behind the peaks identified at a number of stations and the peaks may essentially be part of the same flood event. As the aim of the study was to assess the regional frequency of occurrence of flood events and their process controls, flood events that occurred at different stations and were caused by the same hydro-meteorological events were grouped into a single spatially coherent flood event. This was performed by analysing the dates of potentially flood causing peaks at the individual stations and the distance between the centroids of the contributing catchments of the stations. If peaks at two stations occur within a short time interval and their contributing catchments are close to one another, it is likely that the peaks at the two stations belong to the same event. The maximum time interval between the peaks and the corresponding maximum distance between the basins for peaks to be of the same event depends on a number of factors, such as the topological configuration of the catchments, the characteristics of the storms or meteorological conditions that caused the events, as well as the magnitude of the flood. Therefore, some subjectivity is ultimately involved in spatially grouping events in this way. For instance, Merz and Blöschl (Citation2003) assumed annual maximum flows occurring within a time lag of 1 day to be of the same event if the centroids of the contributing catchments are within 50 km.
In this work, a flood event was defined as an event where a gauge records a potentially impact causing peak flow. This is defined as a 5-year flow or larger. All the gauges that are grouped into the same event should record at least a 5-year flood. Catchments whose centroids lie within 50 km of one another while their peaks lag by a maximum of one day are assumed to be of the same event. Furthermore, if a gauging station is located downstream of another one, a peak that occurs at the downstream gauge within 3 days of the peak at the upstream gauging station is considered to belong to the same event. Depending on the basin size and the distance between the gauges, this might be longer or shorter. For instance, Uhlemann et al. (Citation2010) found a time lag of 8–10 days in the Elbe River Basin from Dresden to Neu Darchau. In this work, there are several intermediate gauging stations between the most upstream and downstream gauges within large basins and the definition of a 3-day lag is considered reasonable. The effect of the choice of both the distance between the centroids of the catchments and the time lag between the peaks between the upstream and downstream stations on the results of this work was investigated through a sensitivity study by varying the chosen values. We tested all possible pairs of time lags of between 1 and 7 days and distances between the catchment centroids of between 10 km and 100 km, with 10-km increments.
Based on the time of year of their occurrence, the identified flood events were grouped seasonally into winter (October–March) and summer (April–September) events.
2.3 Hydrological and hydro-meteorological event characteristics
Hydrological and hydro-meteorological characteristics () corresponding to each of the identified flood events were derived. These were used as the basis of identification of the process controls of the events. A semi-distributed continuous daily rainfall–runoff model that was set up for the whole of Europe, E-HYPE (Donnelly et al. Citation2016, Hundecha et al. Citation2016), and its meteorological forcings were used to estimate the hydrological and hydro-meteorological event characteristics.
Table 2. Hydrological and hydro-meteorological state variables used for characterizing and classifying flood events.
The E-HYPE model domain covers an area of 8.8 × 10⁶ km2 and is subdivided into 35 408 sub-catchments with an average size of 248 km2. Each sub-catchment is further subdivided into hydrological response units (HRUs) based on a combination of different land-use classes and soil types. The model has conceptual routines for the major land surface and subsurface processes. The snow accumulation and snowmelt processes are modelled using the degree-day method. Rainfall and/or snowmelt are apportioned into surface and subsurface flow components using different soil- and land-use-dependent thresholds and parameters. Potential evapotranspiration (PET) is estimated using the modified Jensen-Haise model (Oudin et al. Citation2005). PET is achieved only if the actual soil moisture exceeds a certain threshold and the actual evapotranspiration decreases linearly from the PET value at this threshold to zero at the wilting point. The generated runoff is routed through each sub-catchment and between sub-catchments using a simple river routing routine that simulates attenuation and delay within the river system. A simple routing procedure for flows out of lakes and reservoirs is also employed. The model is driven by the WATCH and WFDEI forcing datasets. These datasets provide daily gridded precipitation and air temperature with an approximate grid size of 50 km × 50 km. The data are interpolated to the centroid of each sub-catchment in the model domain. Details of the model set up, database, as well as calibration and validation procedures are presented in Hundecha et al. (Citation2016). Despite the known uncertainty in model-simulated variables, based on the results of the rigorous model validation discussed in Hundecha et al. (Citation2016), we assume that the model-simulated variables can reasonably be used for this work at the spatial scale the work focuses on.
The hydrological and hydro-meteorological event characteristics were computed first for each of the stations that were grouped into a spatially coherent flood event. Total precipitation amount was computed as the total catchment average value between the event start and peak dates from the meteorological forcing data. If the corresponding daily mean temperature is above 0°C, precipitation is assumed to be in the form of rainfall and snowfall otherwise. The duration of precipitation was estimated as the area weighted average of the duration within each of the sub-catchments making up the contributing catchment of the station. This was done since precipitation may not be evenly distributed within the drainage area due to the possible movement of the atmospheric system causing the precipitation. Furthermore, antecedent precipitation index corresponding to different lengths of days before the event start date was computed using the catchment average daily precipitation. Hydrological state variables at the onset and during each event were estimated as catchment average values from the E-HYPE model simulation (see for definitions). The event characteristics for the spatially grouped events were then estimated as the sum of the event characteristics at the contributing stations weighted by their respective drainage areas. The duration of the flood event was estimated as the time between the earliest event start date and the last event end date at the contributing stations.
2.4 Classification of flood events based on their generating mechanisms
Flood type classification was performed by employing cluster analysis to the event hydrological and hydro-meteorological variables estimated for each of the identified flood events as detailed in Section 2.3 (see also ). Not all variables were used for the classification. Since soil moisture deficit is an indicator of the antecedent precipitation index, API, was not used in the classification. Also, instead of total precipitation, the rainfall and snowfall components were used. Some of the remaining variables could still be correlated. We employed principal component analysis (PCA) to derive descriptors that are independent and have a lower dimensionality before we applied the clustering algorithm. PCA was performed on the standardized variables since the scale of the different variables is different. Principal components that account for 75% of the variance of all the variables were retained for further clustering. We employed the k-means algorithm (Hartigan and Wong Citation1979) by starting with a large number of groups (20 groups as a starting point) and hierarchically merged groups using Ward’s minimum variance method (Ward Citation1963). Two groups were merged in such a way that the increase in the sum of the within group variance of the descriptors weighted by the respective group size across all groups is the minimum. After each merging step, the k-means algorithm was applied to the reduced number of groups. The procedure was repeated until all events were merged into one group. The optimum number of groups was then established by evaluating the change in the total weighted variance of the descriptors across all groups between successive merging steps. The point where the rate of change becomes steeper was set as the optimum number of groups. The distributions of the hydrological and hydro-meteorological variables within the identified group members were used as a basis of establishing the dominant flood generation mechanism for the events within a given group.
2.5 Regional changes in flood types and their hydro-meteorological forcing
Since a 5-year flow was used as a threshold for defining a flood event, the number of flood events a station is involved in could be too few to enable estimating a trend in the frequency of occurrence of a flood event at a station over the investigation period (1961–2010). Therefore, the identified spatially coherent flood events were grouped into different regions and assessment of the regional distribution of the different flood-generating mechanisms and the temporal change in their frequency of occurrence was performed on the annual and seasonal regional counts of the events.
Five regions were defined that are geographically coherent and have distinct climate characteristics. The updated Köppen-Geiger climate classification (Peel et al. Citation2007) was employed for defining the regions, with some adjustments of the boundaries so that sub-catchments delineated in the hydrological model employed in the study are not cut into different regions. The defined regions are Alps, Northern, Western, Eastern, and Southern Europe (see ). Although the regions were defined based on their climate characteristics, we named them by their geographic position in Europe for ease of presenting the results of the study. The climate region described mainly as cold without dry season with cold summer in Peel et al. (Citation2007) that covers much of the northern part of Europe is defined as Northern Europe, while the vast region of central and eastern Europe as well as southern Scandinavia described as cold without dry season with warm or hot summer is defined as Eastern Europe. The climate region described as temperate without dry season and warm summer that distinctly covers the western part of Europe including the British Isles is defined as Western Europe. The regions in the southern part of Europe that are classified as temperate with dry summer and arid steppe are defined as Southern Europe. The area in the Alps classified as polar tundra is defined as the Alps. Note that there could be small pockets of other climate classes in each of our zoning, but they were merged in the major climate class that defines each of the regions. Due to the way the flood events are spatially grouped, some of the flood events may belong to more than one region. Such events contribute to the number of events in all the regions they belong to.
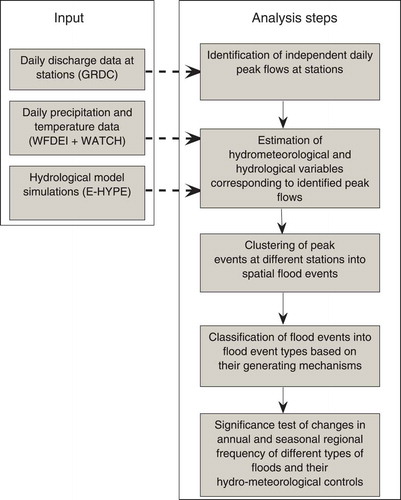
For the assessment of changes in the frequency of flooding, we employed the Mann-Kendall trend test (Kendall Citation1975) on the annual and seasonal regional counts of flood events. This was performed on both the total number of flood events and the numbers of different types of flood events. We also performed a similar analysis at a continental scale by pooling all the events in all regions. A change was deemed significant at a 5% significance level. A similar trend analysis was performed on the hydro-meteorological controls associated with the flood events. The assessment was done for event precipitation, and additionally initial snow water equivalent and amount of snowmelt, for snowmelt events. Trend analysis was performed on the regional mean annual and seasonal values of the variables associated with the annual or seasonal regional flood events. This was also performed for each type of flood event. The entire work procedure, together with the input used at each step, is schematized in .
Figure 2. Schematic representation of the analysis procedure and the input data used in the study.
3 Results
3.1 Regional distribution of spatially grouped flood events
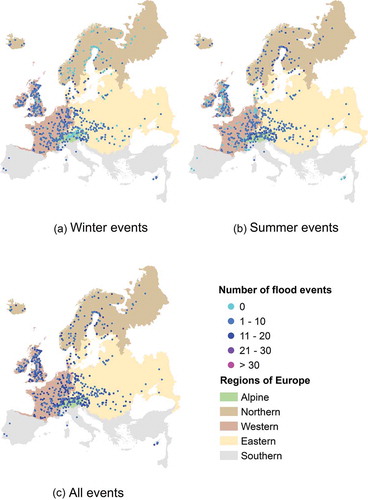
Based on the analysis discussed above (Section 2.2.2), 3891 spatially coherent flood events were identified across Europe over the period 1961–2010 from the stations used in the study. The number of flood events each of the stations is grouped into is shown in . Although there is no clear regional variation in the total number of flood events at each station, a clear regional pattern is observed in the seasonality of the occurrence of flood events. Most of the flood events in Western and Southern Europe occurred in winter (October–March), while the majority of the flood events in Northern Europe and the Alps occurred in summer (April–September). In Eastern Europe, many flood events occurred in both seasons, although more events occurred in summer at many of the stations. Continentally, there were more events in winter than in summer (2165 versus 1726). This could, however, be because of the higher station density in Western Europe, which predominantly has a winter flood regime.
Figure 3. Total seasonal and overall counts of spatially grouped flood events at each station in the period 1961–2010.
3.2 Flood event types and their characteristics
The employed cluster analysis on the hydrological and hydro-meteorological descriptors of the identified flood events resulted in four groups of events (see ). The characteristics of the flood events in each of these groups can be discerned from the distributions of the hydrological and hydro-meteorological descriptors shown in :
Group 1 is characterized by a short duration rainfall with a median duration of 2 days and very little snowfall and snowmelt. The catchment is saturated at the onset of the event with very little soil moisture deficit. The event duration is also short. Events in this group are designated as short-rain (SR) flood events.
Group 2 is characterized by a large amount of rainfall over a longer duration. There can be little snowfall during the event and the amount of snowmelt is negligible. Like events in Group 1, the initial catchment state is saturated with little soil moisture deficit. Events in this group are designated as long-rain (LR) flood events.
Group 3 is characterized by a large amount of accumulated snow at the onset of the event with possible rainfall and snowfall during the event. The event is characterized by a large amount of snowmelt that exceeds the amount of precipitation falling during the event. The event has a long duration and the initial catchment sate is saturated with little soil moisture deficit. However, the antecedent precipitation is the lowest among all the four groups. Events in this group are designated snowmelt (SM) events.
Group 4 is characterized by rainfall with relatively shorter duration, with no snowfall and a high soil moisture deficit at the onset of the event, which suggests a drier initial catchment state. No snowmelt takes place during the event and the event duration is relatively short. Events in this group are designated as rain-on-dry-soil (RoDS) events.
Figure 4. Weighted sum of within group variance of the retained principal components of event descriptors at each stage of hierarchical lustering of flood events.
Figure 5. Distributions of different meteorological and hydrological state variables corresponding to the different types of flood events (See also Table 2 for description of the variables).
3.3 Seasonal and regional distribution of flood event types
As shown in , short-rain flood events are predominant at the continental scale, both annually and seasonally. Annually, these account for 62% of the total number of events, while snowmelt events are the second most dominant type, with 20% of the total number of events. Rain-on-dry-soil events are the least frequent, accounting only for 6% of the total number of annual events. In winter, following an SR event, which accounts for 73% of the total winter events, LR events are the next dominant type of event (18%), while RoDS events are the least frequent (3%). In summer, the most frequent event type next to SR events (47% of the total number of summer events) is SM (37% of events). Long-rain events are the least frequent in summer (6% of the total number of summer events).
Figure 6. Annual and seasonal proportions of different types of flood events across Europe over 1961–2010. Bars on top of each bar show the ranges of proportions of the flood types for all tested configurations of grouping peak events at different stations into a flood event.
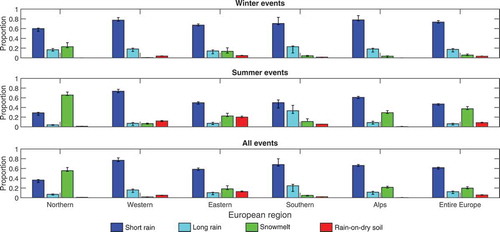
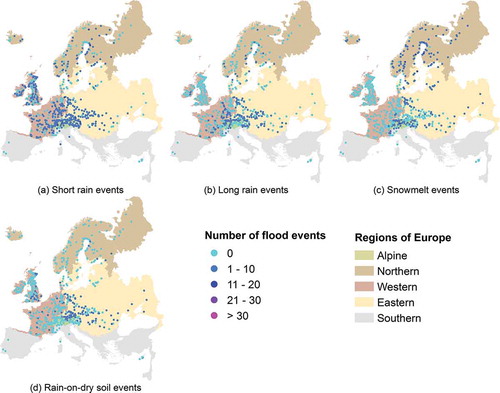
Generally, SR events are the dominant flood type regionally too. However, the majority of flood events in Northern Europe, which occurred in summer, are predominantly generated by snowmelt (–). Snowmelt events are rare in Western and Southern Europe over the investigation period. The few SM events in Western Europe occurred around the eastern border of the region (see –). Stations with the highest number of SM events were concentrated in Northern Europe, followed by the Alps and Eastern Europe. The majority of SM events occurred in summer, especially in Northern Europe and the Alps. Winter snowmelt events were more concentrated in Eastern Europe (). Rain-on-dry-soil events mainly occurred in Eastern and Western Europe. In Eastern Europe, they mainly occurred in summer, while they occurred in both seasons in Western Europe.
Figure 7. Total numbers of different types of flood events at each station in the period 1961–2010.
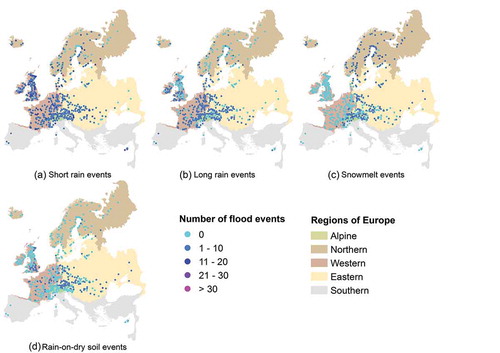
Figure 8. Numbers of different types of winter flood events at each station in the period 1961–2010.
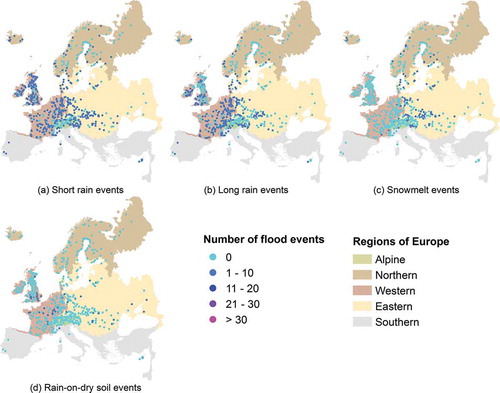
Figure 9. Numbers of different types of summer flood events at each station in the period 1961–2010.
The effect of choice of the maximum distance between nearby catchments and the time lag between peaks at stations located along a river for grouping peak events at several stations into the same flood event can also be seen in . The error bars at the top of each bar show the ranges of the proportions of the different types of floods for all the tested pairs of distances and time lags (70 pairs). The effect on the proportions of the different types of flood-generating processes is not significant at the continental scale and in most of the regions. The effect is significant in Southern Europe, where only a few stations were used and the identified events were not that many. Although SR events were always the dominant types, the absolute proportion of SR and LR events varied by up to 20% in this region. Note that the absolute number of flood events can vary more strongly. However, as the objective of this study is to assess the dominant flood-generating mechanisms and their time evolution, we investigated here only the effect on the relative proportions of the different flood-generating mechanisms.
3.4 Regional changes in the occurrence of different flood types
As shown in , no significant trend was detected in both the annual and seasonal number of occurrence of flood events continentally. However, when the events were grouped based on their generating mechanisms, one can see that there was a decline in the occurrence of summer snowmelt events, which was compensated by a rise in the occurrence of LR flood events throughout the year.
Table 3. Mann-Kendall trend test P values for the frequency of different types of flooding in different regions of Europe. Signs in the top row show the direction of change; bold figures are significant at the 5% significance level, and the figures in parentheses show the percentage of all configurations of grouping stations into a flood event tested in the sensitivity study that showed significant trend at the 5% level. SR: short-rain events; LR: long-rain events; SM: snowmelt events; RoDS: rain-on-dry-soil events; All: all events.
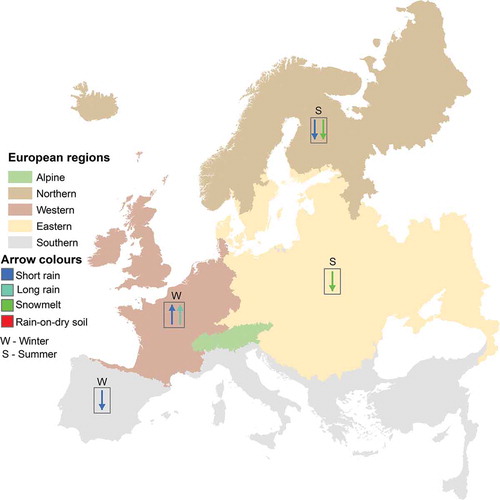
When the changes are looked at regionally, it can be seen that there was a significant rise in the occurrence of flood events in Western Europe that is compensated by a decline in Northern and Southern Europe (, ). The increase in the occurrence of flood events in Western Europe occurred in winter due to the rise in both short- and long-rain flood events. The decline in the occurrence of flood events in Northern Europe was caused by a significant decrease in the number of occurrence of summer snowmelt and short-rain events. In Southern Europe, it is the occurrence of winter short-rain events that went down. It should be noted, however, that due to a few number of events in southern Europe as a result of very few stations, assessment of changes in the occurrence of flood events could only be done for winter short-rain events, to which most of the identified events belong. No significant change was detected in the annual number of occurrence of flood events in Eastern Europe. However, the number of occurrence of summer snowmelt events showed a significant decreasing trend. No significant change was detected in the number of occurrence of any type of flooding in the Alps.
Figure 10. Regional distribution of significant seasonal changes in the frequency of different types of flood events across Europe (upwards arrows show significant positive trends and downward arrows show significant negative trends). Changes are shown only for seasons and flood types to which significant changes were detected in each region.
The effect of the way flood events at different stations were grouped into a spatially coherent flood event on the changes in the occurrence of the different types of floods can be seen in . The figures in the parentheses below the p-values show the percentage of all the tested pairs of maximum distances between nearby catchments and maximum lag between peaks between stations for which a significant trend was detected. Most of the significant changes discussed above were also significant for all the tested grouping of stations. There were some where not all grouping of stations yielded a significant change. However, at least 79% of the tested groupings showed a significant change where a significant change was detected for the grouping outlined in Section 2.2.2 (). There are also instances where some of the tested groupings showed a significant change where the grouping used in this work did not show a significant change. For instance, the annual number of occurrence of LR and SM events showed a significant increasing and decreasing trend for 8% and 13%, respectively, of the tested groupings in Eastern Europe.
As shown in , the amount of precipitation associated with winter SR and LR events increased significantly, while the initial SWE and amount of snowmelt associated with summer SM events showed a significant decreasing trend continentally. This shows that, continentally, the increase in the occurrence of winter LR flood events is accompanied by an increase in the amount of precipitation driving the events, while the decline in the frequency of occurrence of summer SM flood events is accompanied by a corresponding decline in the available amount of snow. Regionally, the increase in the amount of precipitation associated with winter LR flood events occurred in Western Europe. Additionally, the amount of precipitation associated with SR flood events showed an increasing trend in Western Europe, which is balanced by the corresponding decline in Southern Europe (see ). In Northern Europe, where summer SR and SM flood events declined in their occurrence, neither the amount of precipitation nor snowmelt showed any significant change. The decreasing trend in the amount of snow and snowmelt associated with summer SM flood events occurred in Eastern Europe.
Table 4. Mann-Kendall trend test P values for the flood event-related hydro-meteorological drivers in different regions of Europe. Signs in the top row show the direction of change; bold figures are significant at the 5% significance level, and the figures in parentheses show the percentage of all configurations of grouping stations into a flood event tested in the sensitivity study that showed significant trend at the 5% level. SR: short-rain events; LR: long-rain events; SM: snowmelt events; RoDS: rain-on-dry-soil events; All: all events.
4 Discussion
4.1 Regional differences in the frequency of flooding and dominant flood types
The regional distribution of the number of flood events and frequency of the different types of flooding can be put in perspective based on the hydro-meteorological features of each region. Most of the identified winter flood events in Western Europe were mainly rainfall events. Several studies in the past had associated winter flooding in this part of Europe to extreme and often persistent precipitation events triggered by the westerly winds bringing ample moisture from the Atlantic (Bárdossy and Caspary Citation1990; Beurton and Thieken Citation2009). Air temperature in the region is milder and snow processes are not important in the generation of major winter flooding, as can be seen in and , by the few number of snowmelt events in Western Europe. As one moves towards the east, however, the air temperature may stay below freezing point due to a shift into a continental climate, leading to accumulation of snow. Snowmelt events become important event types in addition to purely rainfall events in Eastern Europe ().
The summer events, which were mainly concentrated in the Alps, Northern and Eastern Europe, have a more complex genesis, which are regionally variable. Although heavy rainfall is still an important mechanism, snow processes also become a significant contributor to the flood generation in many parts of these regions. In the central eastern part of Europe, the majority of summer flood events are often caused by heavy rainfall events that last for several days and are associated with moisture transport from the Adriatic Sea to central Europe over eastern Alps, which are often enhanced by orographic lifting (Ulbrich et al. Citation2003b, Mudelsee et al. Citation2004, Jacobeit et al. Citation2006, Jeneiová et al. Citation2016). The results are shown in , where summer LR events appear to be concentrated in this region, confirm this. In addition, the colder winter leads to a longer retention of snow, which starts to melt in early or late spring, depending on the topographic feature (Beurton and Thieken 2009). This can be seen in ). In Northern Europe, the summer flood regime is mainly controlled by melting of snow accumulated during the cold winter in the mountainous areas and regions further to the north (Arheimer and Lindström Citation2015, Vormoor et al. Citation2015), which is in line with the finding of this work (see and ). Different generating mechanisms are associated with the flood regime in the Alps, which vary depending on the topographic elevation and exposure. In the northern part of the Alps, a similar weather situation associated with heavy rainfall, which triggers most of the summer flooding in central Europe, defines the flood regime (Böhm and Wetzel Citation2006). A similar mechanism leads to flooding in the higher mountain ranges, but it can be accompanied by glacier and snowmelt, which enhance the antecedent catchment wetness (Merz and Blöschl Citation2003, Parajka et al. Citation2010, Peña et al. Citation2015). Our study confirms this, as shown in .
4.2 Regional changes in the frequency of flooding and flood-generating mechanisms
The increasing trend in the occurrence of winter rainfall flood events in Western Europe is in line with studies conducted in the UK and Germany. Most studies reviewed by Hannaford (Citation2015) suggest increasing frequency of winter flooding in the UK after the 1960s that were mainly attributed to changes in climate-related forcing, especially to the increasing frequency of the westerlies that are linked to heavy precipitation events in most parts of Western Europe. Similarly, Petrow and Merz (Citation2009) detected an increasing trend in the frequency of winter flooding in the western, central and southern parts of Germany in the second half of the 20th century, which they speculated to be attributable to climate-related forcing due to the spatial coherence of the change pattern they detected. Hattermann et al. (Citation2013) confirmed this through assessment of the corresponding changes in temperature, occurrence of heavy precipitation, and atmospheric circulation patterns related to heavy precipitation. The increasing trend in the flood associated winter precipitation we found is consistent with the finding of a European wide study of Blöschl et al. (Citation2019), which showed an increasing trend in flood causing winter extreme precipitation and a corresponding increase in the extreme river flow over a similar period as in our study.
In contrast to our finding, past studies did not show a clear and consistent pattern of change in the occurrence of flooding in Northern Europe (Lindström and Bergström Citation2004, Wilson et al. Citation2010). However, Wilson et al. (Citation2010) found that there is a clear tendency for an early occurrence of spring floods, which is likely due to an earlier snowmelt triggered by the rise in temperature.
For Eastern Europe, results from different previous studies showed different patterns of change. Mudelsee et al. (Citation2003), for instance, found a decreasing trend in the occurrence of winter flooding in the Oder and Elbe rivers, with a concurrent declining trend in the occurrence of extreme precipitation over the past 80 to 150 years. They found no significant trend in the occurrence of summer flooding over the same period. Petrow and Merz (Citation2009), on the other hand, did not find any significant trend in the occurrence of extreme flow in the Elbe river in both seasons over the second half of the 20th century. Kundzewicz et al. (Citation2013) found an increasing trend in the number of occurrences of large flood events over 1985–2009 in large parts of Europe, including Central and Eastern Europe. Although the time periods considered in these studies are different to enable comparison of their results, no clear picture in the tendency of the change could be discerned. The decreasing trend in the summer snowmelt flooding and the corresponding decline in the amount of snowmelt found in our work is, however, consistent with the finding of a European wide study of Blöschl et al. (Citation2019).
In the Alps, Schmocker-Fackel and Naef (Citation2010) and Peña et al. (Citation2015) found that the frequency of summer flooding in Switzerland had been on the rise in the last four decades and attributed the change to patterns of low-frequency atmospheric variability and the corresponding changes in the frequency of heavy precipitation. Similar results were presented by Pekárová et al. (Citation2016), who identified increasing frequency of large floods along the Danube river. Mediero et al. (Citation2015), on the other hand, detected a decreasing trend in the frequency of flooding in the Alps over the last four decades of the 20th century through a European wide study.
Although it is difficult to obtain a bigger picture of the changes in the flood regime in Southern Europe due to a lack of good coverage of stations, the result we obtained at the few stations is in agreement with the findings of Mediero et al. (Citation2014), who found decreasing trends in the occurrence of flood events in Spain for three different periods ending in 2009 and notably over the period 1959–2009. Silva et al. (Citation2012) also suggested a decline in the frequency of flooding in Portugal in recent decades, which they found to have a similar trend pattern with rainfall. Blöschl et al. (Citation2019) also found a decreasing trend in the extreme winter precipitation associated with flooding in Southern Europe, which is consistent with our result.
While the regional distribution of the dominant flood-generating mechanisms we found is generally consistent with the findings of most of the previous studies, there is a lack of agreement in the changes in the frequency of regional flood occurrence detected in our work and some of the previous regional studies. This can be attributed to a number of factors. Flood events were defined in many of the studies, including ours, based on the peaks-over-threshold approach. Different studies employed different thresholds and the choice of the threshold obviously affects the resulting trend (Mangini et al. Citation2018). The time periods used for the assessment were also different in the different studies and this may lead to different trend patterns as there could be a high variability in the flood occurrence time series, which may be enhanced by temporal clustering of flood occurrence (Hall et al. Citation2014). One advantage of the present study is that by employing a consistent method of analysis over the same time period across the continent, a coherent large scale picture of a change pattern can be discerned.
4.3 Uncertainties and limitations
The approach we employed enables characterizing floods on event-by-event basis, which makes assessment of the relative contribution of different flood-generating mechanisms and attribution of possible changes in the frequency of flooding in time easier. Attribution of the change in flooding through a parallel assessment of a change in the potential driver may not reveal the actual connection between the change in flooding and that of the investigated driver, as the change in flooding could be the result of a confounding effect of other factors (Merz et al. Citation2012). A change in the annual extreme flow, for instance, may not directly be attributed to a corresponding change in the annual extreme rainfall since the annual extreme flow may be a result of other processes (e.g. Hundecha and Merz Citation2012). Despite the obvious advantage of our approach, however, it has its own limitations and uncertainties as it is based on some simplifications and results from a hydrological model whose uncertainties can be propagated to the results.
Flood events were defined as spatially coherent peak-flow events by grouping stations that are affected by the same hydro-meteorological events causing the flood events. The procedure we employed for identifying the start and end dates of the peak-flow events is simple, while the reality is often more complex (Blume et al. Citation2007), but robust for different hydrograph shapes and repeatable. Although grouping of the stations was guided by suggestions from the literature, subjective decisions were made that could introduce uncertainties in the results. The effect of such decisions was assessed through a sensitivity study (Sections 3.3 and 3.4), and the results are generally stable. There are, however, some uncertainties in some of the results that are visible in some regions.
Employing a hydrological model for the estimation of some of the hydrological variables used for the description of flood processes also introduces additional uncertainty in the results. A model is often calibrated to reproduce observed aggregated catchment response, often river discharge, at one or more locations within a basin and model parameters pertaining to different processes may not be estimated uniquely and estimation of the resulting state variables may be uncertain. Furthermore, the hydrological variables estimated by the model would be dependent on the discharge data from which flood events are derived if the model was calibrated against the same discharge data, potentially biasing characterization of the flood events using the model-simulated variables.
The above problems may partly be addressed by employing additional catchment response or earth observation data of state variables to constrain some of the model parameters. The snow and evapotranspiration parameters of the E-HYPE model employed in this work were constrained against earth observation data of snow cover and potential evapotranspiration, respectively (Hundecha et al. Citation2016). The model was calibrated for a few number of representative meso-scale catchments that have unique physiographic features and the estimated parameters were regionalized for the entire Europe based on catchment physiographic attributes. None of the stations used for model calibration were used in this study. This can potentially reduce biasing characterization of the flood events based on the model-simulated hydrological variables. On the other hand, regionalization of model parameters may not lead to optimal model performance everywhere in the model domain as the parameters are not locally tuned at all stations, potentially introducing additional uncertainty due to poor model performance at some stations. However, calibrating a model locally at all stations at a continental scale can be a daunting task. Performing model uncertainty analysis would also be prohibitively expensive at the scale our study was performed.
5 Conclusions
Consistent datasets and method were employed to identify historical flood events across Europe and their generating mechanisms were identified by clustering the events using their hydrological and meteorological characteristics. Four flood-generating mechanisms were identified: short-rain, long-rain, snowmelt, and rain-on-dry-soil. The flood events were grouped into five different regions of Europe delineated based on the climate features of the regions and their geographic locations. Annual and seasonal changes in the frequency of occurrence of the different types of flooding were assessed for each region for the period 1961–2010.
Regional and seasonal differences were apparent in the dominant flood-generating mechanisms. Winter events were more frequent at stations in the western and central parts of Europe, which were mainly short- and long-rain events while the majority of summer events were concentrated at stations in the northern and eastern parts of Europe as well as the Alps, where snowmelt and short-rain events are dominant.
At a continental scale, the frequency of both winter and summer LR events increased significantly together with the amount of event-related precipitation while the frequency of summer SM events deceased significantly accompanied by a decline in the amount of accumulated snow and snowmelt. However, no significant change was detected in the frequency of occurrence of flooding in general. Regionally, a significant decreasing trend was detected in northern Europe resulting from a decline in the frequency of occurrence of summer short-rain and snowmelt events. The frequency of flooding increased significantly in Western Europe due to increasing frequency of winter SR and LR events accompanied by an increase in event-related precipitation amount. Summer snowmelt events and the corresponding amount of snowmelt decreased significantly in Eastern Europe. Overall, however, no significant change was detected in the frequency of flood occurrence in Eastern Europe. No significant change in the frequency of flooding was detected in the Alps. The frequency of flooding in southern Europe decreased significantly due to a decline in the occurrence of winter SR events and the amount of event rainfall.
Acknowledgements
All data, scripts and protocols used in the analyses are available in the SWITCH-ON Virtual Water-Science Laboratory at www.water-switch-on.eu.
Disclosure statement
No potential conflict of interest was reported by the authors.
Additional information
Funding
References
- Arheimer, B. and Lindström, G., 2015. Climate impact on floods: changes in high flows in Sweden in the past and the future (1911–2100). Hydrology and Earth System Sciences, 19, 771–784. doi:10.5194/hess-19-771-2015
- Arino, O., et al., 2008. GLOBCOVER The most detailed portrait of Earth. ESA Bulletin, 136, 24–31.
- Bárdossy, A. and Caspary, H.J., 1990. Detection of climate change in Europe by analyzing European atmospheric circulation patterns from 1881 to 1989. Theoretical and Applied Climatology, 42,155–167. doi:10.1007/BF00866871.
- Berghuijs, W.R., et al., 2016. Dominant flood generating mechanisms across the United States. Geophysical Research Letters, 43, 4382–4390. doi:10.1002/2016GL068070
- Berghuijs, W.R., et al., 2019. The relative importance of different flood‐generating mechanisms across Europe. Water Resources Research, 55. doi:10.1029/2019WR024841.
- Beurton, S., and Thieken, A.H., 2009. Seasonality of floods in Germany. Hydrological Sciences Journal, 54 (1), 62–76. doi:10.1623/hysj.54.1.62
- Blöschl, G., et al., 2013. The june 2013 flood in the upper Danube Basin, and comparisons with the 2002, 1954 and 1899 floods. Hydrology and Earth System Sciences, 17, 5197–5212. doi:10.5194/hess-17-5197-2013
- Blöschl, G., et al., 2015. Increasing river floods: fiction or reality? Water, 2, 329–344. doi:10.1002/wat2.1079
- Blöschl, G., et al., 2016. Thematic issue on floods in the Danube basin – processes, patterns, predictions. Journal of Hydrology and Hydromechanics, 64 (4), 301–303. doi:10.1515/johh-2016-0043.
- Blöschl, G., et al., 2017. Changing climate shifts timing of European floods. Science, 357 (6351), 588–590. doi:10.1126/science.aan2506.
- Blöschl, G., et al., 2019. Changing climate both increases and decreases European river floods. Nature, 573 (7772), 108–111. doi:10.1038/s41586-019-1495-6.
- Blume, T., Zehe, E., and Bronstert, A., 2007. Rainfall–runoff response, event-based runoff coefficients and hydrograph separation. Hydrological Sciences Journal, 52 (5), 843–862. doi:10.1623/hysj.52.5.843.
- Böhm, O. and Wetzel, K.-F., 2006. Flood history of the Danube tributaries Lech and Isar in the Alpine foreland of Germany. Hydrological Sciences Journal, 51 (5), 784–798. doi:10.1623/hysj.51.5.784.
- Chapman, T., 1999. A comparison of algorithms for stream flow recession and baseflow separation. Hydrological Processes, 13 (5), 701–714. doi:10.1002/(SICI)1099-1085(19990415)13:5<701::AID-HYP774>3.0.CO;2-2.
- Donnelly, C., Andersson, J.C.M., and Arheimer, B., 2016. Using flow signatures and catchment similarities to evaluate the E-HYPE multi-basin model across Europe. Hydrological Sciences Journal, 61 (2), 255–273. doi:10.1080/02626667.2015.1027710.
- EU, 2007. Directive 2007/60/EC of the European parliament and of the council of 23 October 2007 on the assessment and management of flood risks. Official Journal of the European Union, L288, 27–34.
- Hall, J., et al., 2014. Understanding flood regime changes in Europe: a state-of-the-art assessment. Hydrology and Earth System Sciences, 18, 2735–2772. doi:10.5194/hess-18-2735-2014.
- Hannaford, J., 2015. Climate-driven changes in UK river flows: A review of the evidence. Progress in Physical Geography, 39 (1), 29–48. doi:10.1177/0309133314536755.
- Hartigan, J.A. and Wong, M.A., 1979. Algorithm AS 136: A K-means clustering algorithm. Journal of the Royal Statistical Society, C, 28 (1), 100–108.
- Hattermann, F.F., et al., 2013. Climatological drivers of changes in flood hazard in Germany. Acta Geophysica, 61 (2), 463–477. doi:10.2478/s11600-012-0070-4.
- Hundecha, Y., et al., 2016. A regional parameter estimation scheme for a pan-European multi-basin model. Journal of Hydrollogy: Regional Studies, 6, 90–111. doi:10.1016/j.ejrh.2016.04.002
- Hundecha, Y. and Merz, B., 2012. Exploring the relationship between changes in climate and floods using a model-based analysis. Water Resources Research, 48, W04512. doi:10.1029/2011WR010527
- Jacobeit, J., Philipp, A., and Nonnenmacher, M., 2006. Atmospheric dynamic circulation linked with prominent discharge events in central Europe. Hydrological Sciences Journal, 51 (5), 946–965. doi:10.1623/hysj.51.5.946.
- Jeneiová, K., et al., 2016. Variability of seasonal floods in the upper Danube River basin. Journal of Hydrology and Hydromechanics, 64 (4), 357–366. doi:10.1515/johh-2016-0037.
- Keller, L., et al., 2018. Delineation of flood generating processes and their hydrological response. Hydrological Processes, 32 (2), 228–240. doi:10.1002/hyp.11407.
- Kendall, M.G., 1975. Rank correlation methods. 4th. London: Griffin, 202.
- Kundzewicz, Z.W., et al., 2014. Flood risk and climate change: global and regional perspectives. Hydrological Sciences Journal, 59 (1), 1–28. doi:10.1080/02626667.2013.857411.
- Kundzewicz, Z.W., Pinskwar, I., and Brakenridge, G.R., 2013. Large floods in Europe, 1985–2009. Hydrological Sciences Journal, 58 (1), 1–7. doi:10.1080/02626667.2012.745082.
- Lehner, B., et al., 2011. High resolution mapping of the world’s reservoirs and dams for sustainable river flow management. Frontiers in Ecology and the Environment, 9 (9), 494–502. doi:10.1890/100125.
- Lehner, B. and Döll, P., 2004. Development and validation of a global database of lakes, reservoirs and wetlands. Journal of Hydrology, 296, 1–22. doi:10.1016/j.jhydrol.2004.03.028
- Lehner, B., Verdin, K., and Jarvis, A., 2008. New global hydrography derived from spaceborne elevation data. Eos, 89, 93. doi:200810.1029/2008EO100001
- Lindström, G. and Bergström, S., 2004. Runoff trends in Sweden 1807–2002. Hydrological Sciences Journal, 49 (1), 69–83. doi:10.1623/hysj.49.1.69.54000.
- Loukas, A., Vasiliades, L., and Dalezios, N.R., 2000. Flood producing mechanisms identification in southern British Columbia, Canada. Journal of Hydrology, 227, 218–235. doi:10.1016/S0022-1694(99)00182-1
- Mangini, W., et al., 2018. Detection of trends in magnitude and frequency of flood peaks across Europe. Hydrological Sciences Journal, 63 (4), 493–512. doi:10.1080/02626667.2018.1444766.
- Marsh, T., 2008. A hydrological overview of the summer 2007 floods in England and Wales. Weather, 63, 274–279. doi:10.1002/wea.305
- McCabe, G.J., Hay, L.E., and Clark, M.P., 2007. Rain-on-snow events in the western United States. Bulletin of the American Meteorological Society, 88 (3), 319–328. doi:10.1175/BAMS-88-3-319.
- Mediero, L., et al., 2014. Detection and attribution of trends in magnitude, frequency and timing of floods in Spain. Journal of Hydrology, 517, 1072–1088. doi:10.1016/j.jhydrol.2014.06.040
- Mediero, L., et al., 2015. Identification of coherent flood regions across Europe by using the longest streamflow records. Journal of Hydrology, 528, 341–360. doi:10.1016/j.jhydrol.2015.06.016.
- Merz, B., et al., 2012. HESS opinions “more efforts and scientific rigour are needed to attribute trends in flood time series,”. Hydrology and Earth System Sciences, 16, 1379–1387. doi:10.5194/hess-16-1379-2012
- Merz, R. and Blöschl, G., 2003. A process typology of regional floods. Water Resources Research, 39 (12), 1340. doi:10.1029/2002WR001952.
- Merz, R. and Blöschl, G., 2008. Flood frequency hydrology 1: temporal, spatial and causal expansion of information. Water Resources Research, 44, W08432. doi:10.1029/2007WR006744
- Mu, Q., Zhao, M., and Running, S.W., 2011. Improvements to a MODIS global terrestrial evapotranspiration algorithm. Remote Sensing of Environment, 115 (8), 1781–1800. doi:10.1016/j.rse.2011.02.019.
- Mudelsee, M., et al., 2003. No upward trends in the occurrence of extreme floods in central Europe. Nature, 425, 166–169. doi:10.1038/nature01928
- Mudelsee, M., et al., 2004. Extreme floods in central Europe over the past 500 years: role of cyclone pathway “Zugstrasse Vb”. Journal of Geophysical Research, 109, D23101. doi:10.1029/2004JD005034
- Nied, M., Hundecha, Y., and Merz, B., 2013. Flood-initiating catchment conditions: a spatio-temporal analysis of large-scale soil moisture patterns in the Elbe River basin. Hydrology and Earth System Sciences, 17, 1401–1414. doi:10.5194/hess-17-1401-2013
- Oudin, L., et al., 2005. Which potential evapotranspiration input for a lumped rainfall–runoff model? Part 2 - Towards a simple and efficient potential evapotranspiration model for rainfall–runoff modelling. Journal of Hydrology, 303 (1–4), 290–306. doi:10.1016/j.jhydrol.2004.08.026.
- Panagos, P., 2006. The European soil database (2006). GEO: Connexion, 5 (7), 32–33.
- Parajka, J., et al., 2010. Seasonal characteristics of flood regimes across the Alpine–Carpathian range. Journal of Hydrology, 394 (1–2), 78–89. doi:10.1016/j.jhydrol.2010.05.015.
- Peel, M.C., Finlayson, B.L., and McMahon, T.A., 2007. Updated world map of the Köppen-Geiger climate classification. Hydrology and Earth System Sciences, 11, 1633–1644. doi:10.5194/hess-11-1633-2007
- Pekárová, P., et al., 2016. Identification of long-term high-flow regime changes in selected stations along the Danube River. Journal of Hydrology and Hydromechanics, 64 (4), 393–403. doi:10.1515/johh-2016-0045.
- Peña, J.C., et al., 2015. Influence of solar forcing, climate variability and modes of low-frequency atmospheric variability on summer floods in Switzerland. Hydrology and Earth System Sciences, 19, 3807–3827. doi:10.5194/hess-19-3807-2015
- Petrow, T. and Merz, B., 2009. Trends in flood magnitude, frequency and seasonality in Germany in the period 1951–2002. Journal of Hydrology, 371, 129–141. doi:10.1016/j.jhydrol.2009.03.024
- Pinter, N., et al., 2006. Flood magnification on the River Rhine. Hydrological Processes, 20 (1), 147–164. doi:10.1002/hyp.5908.
- Portmann, F.T., Siebert, S., and Döll, P., 2010. MIRCA2000 – global monthly irrigated and rainfed crop areas around the year 2000: A new high-resolution data set for agricultural and hydrological modelling. Global Biogeochemical Cycles, 24, GB 1011. doi:10.1029/2008GB003435
- Prosdocimi, I., Kjeldsen, T.R., and Miller, J.D., 2015. Detection and attribution of urbanization effect on flood extremes using nonstationary flood-frequency models. Water Resources Research, 51, 4244–4262. doi:10.1002/2015WR017065
- Prudhomme, C. and Genevier, M., 2011. Can atmospheric circulation be linked to flooding in Europe? Hydrological Processes, 25, 1180–1190. doi:10.1002/hyp.7879
- Rogger, M., et al., 2012. Step changes in the flood frequency curve – process controls. Water Resources Research, 48, W05544. doi:10.1029/2011WR011187
- Rogger, M., et al., 2013. Quantifying effects of catchments storage thresholds on step changes in the flood frequency curve. Water Resources Research, 49, 6946–6958. doi:10.1002/wrcr.20553
- Schmocker-Fackel, P. and Naef, F., 2010. More frequent flooding? Changes in flood frequency in Switzerland since 1850. Journal of Hydrology, 381, 1–8. doi:10.1016/j.jhydrol.2009.09.022
- Schröter, K., et al., 2015. What made the June 2013 flood in Germany an exceptional event? A hydro-meteorological evaluation. Hydrology and Earth System Sciences, 19, 309–327. doi:10.5194/hess-19-309-2015
- Siebert, S., et al., 2010. Groundwater use for irrigation – a global inventory. Hydrology and Earth System Sciences, 14, 1863–1880. doi:10.5194/hess-14-1863-2010
- Sikorska, A.E., Viviroli, D., and Seibert, J., 2015. Flood-type classification in mountainous catchments using crisp and fuzzy decision trees. Water Resources Research, 51, 7959–7976. doi:10.1002/2015WR017326
- Silva, A.T., Portela, M.M., and Naghettini, M., 2012. Nonstationarities in the occurrence rates of flood events in Portuguese watersheds. Hydrology and Earth System Sciences, 16, 241–254. doi:10.5194/hess-16-241-2012
- Sui, J. and Koehler, G., 2001. Rain-on-snow induced flood events in Southern Germany. Journal of Hydrology, 252, 205–220. doi:10.1016/S0022-1694(01)00460-7
- Tarasova, L., et al., 2019. Causative classification of river flood events. Water, 6(4. doi:10.1002/wat2.1353.
- Thomas, B.F., et al., 2013. Estimation of the baseflow recession constant under human interference. Water Resources Research, 49, 7366–7379. doi:10.1002/wrcr.20532
- Turkington, T., et al., 2016. A new flood type classification method for use in climate change impact studies. Weather and Climate Extremes, 14, 1–16. doi:10.1016/j.wace.2016.10.001
- Uhlemann, S., Thieken, A.H., and Merz, B., 2010. A consistent set of trans-basin floods in Germany between 1952–2002. Hydrology and Earth System Sciences, 14, 1277–1295. doi:10.5194/hess-14-1277-2010
- Ulbrich, U., et al., 2003a. The central European floods of August 2002: part 1 – rainfall periods and flood development. Weather, 58, 371–377. doi:10.1256/wea.61.03A
- Ulbrich, U., et al., 2003b. The central European floods of August 2002: part II – synoptic causes and considerations with respect to climate change. Weather, 58, 434–442. doi:10.1256/wea.61.03B
- van der Ploeg, R.R. and Schweigert, P., 2001. Elbe river flood peaks and postwar agricultural land use in East Germany. Naturwissenschaften, 88 (12), 522–525. doi:10.1007/s00114-001-0271-1.
- Verdin, K.L., 1997. A system for topologically coding global drainage basins and stream networks. In: Proceedings, 17th Annual ESRI Users Conference, San Diego, California, July 1997.
- Vogel, R.M. and Kroll, C.N., 1996. Estimation of baseflow recession constants. Water Resources Management, 10 (4), 303–320. doi:10.1007/BF00508898.
- Vormoor, K., et al., 2015. Climate change impacts on the seasonality and generation processes of floods – projections and uncertainties for catchments with mixed snowmelt/rainfall regimes. Hydrology and Earth System Sciences, 19, 913–931. doi:10.5194/hess-19-913-2015
- Ward, J.H., Jr., 1963. Hierarchical grouping to optimize an objective function. Journal of the American Statistical Association, 58, 236–244. doi:10.1080/01621459.1963.10500845
- Weedon, G.P., et al., 2014. The WFDEI meteorological forcing data set: WATCH Forcing Data methodology applied to ERA-Interim reanalysis data. Water Resources Research, 50, 7505–7514. doi:10.1002/2014WR015638
- Wilson, D., Hisdal, H., and Lawrence, D., 2010. Has streamflow changed in the Nordic countries? – recent trends and comparisons to hydrological projections. Journal of Hydrology, 394, 334–346. doi:10.1016/j.jhydrol.2010.09.010