
ABSTRACT
This study investigates changes in seasonal runoff and low flows related to changes in snow and climate variables in mountainous catchments in Central Europe. The period 1966–2012 was used to assess trends in climate and streamflow characteristics using a modified Mann–Kendall test. Droughts were classified into nine classes according to key snow and climate drivers. The results showed an increase in air temperature, decrease in snowfall fraction and snow depth, and changes in precipitation. This resulted in increased winter runoff and decreased late spring runoff due to earlier snowmelt, especially at elevations from 1000 to 1500 m a.s.l. Most of the hydrological droughts were connected to either low air temperatures and precipitation during winter or high winter air temperatures which caused below-average snow storages. Our findings show that, besides precipitation and air temperature, snow plays an important role in summer streamflow and drought occurrence in selected mountainous catchments.
Editor A. Castellarin; Associate editor O. Makarieva
1 Introduction
Central Europe, located in the temperate zone, typically experiences seasonal changes in hydroclimatic variables. In the cold season, low air temperatures and snow accumulation occur in mountainous areas. These factors are very important for water storage in catchments not only during winter but also throughout the rest of the year, because snowmelt in mountain catchments feeds rivers in lowlands in spring and summer, which is important during periods with little precipitation (Van Loon Citation2015, Staudinger et al. Citation2017). However, a decrease in seasonal snowpack has been observed in mountainous areas of Europe and North America in the past several decades (Pellicciotti et al. Citation2010, Blahusiakova and Matouskova Citation2015, Knowles Citation2015, Jenicek et al. Citation2016, Citation2018, Marke et al. Citation2018).
Changes in snowfall fraction, a ratio of snowfall to annual precipitation, influence the timing of spring runoff, river ice jams, and late winter snow density (Huntington et al. Citation2004). According to Knowles (Citation2015), air temperature, especially in combination with precipitation amounts and their trends, has the largest effect on snow cover trends. In areas where the air temperature is often close to the melting point, little changes in air temperature might result in a large loss of snowpack. With an increase in air temperature by 1°C, the snowline rises by about 150 m in temperate mountain regions (Beniston Citation2003).
Several studies have assessed the influence of snowfall fraction on snow storages and total runoff (Huntington et al. Citation2004, Feng and Hu Citation2007, Sawicz et al. Citation2011, Jenicek et al. Citation2016). Future decrease in snowfall fraction could render catchments at middle and high elevations more susceptible to the occurrence of hydrological drought (Jenicek et al. Citation2016), which is often defined as a period of streamflow deficit below selected threshold. Elevation plays a major role in snow accumulation and snowmelt in large catchments (Kucerova and Jenicek Citation2014). Vojtek et al. (Citation2003) have demonstrated more pronounced decreasing trends in snow cover duration and solid precipitation at elevations from 1000 to 1500 m a.s.l. compared to other elevations, due to increasing mixed and liquid precipitation at the expense of snowfall. Similar findings have also been made by Martin and Durand (Citation1998). At high elevations, only slight or even no changes in snow cover have been observed, because air temperature remains below the freezing point despite ongoing warming (Giorgi et al. Citation1997, Vojtek et al. Citation2003, Knowles et al. Citation2006). Snow cover is expected to dramatically decrease in the future at elevations of 1500–2000 m (Gobiet et al. Citation2014).
Changes in snowpack significantly affect runoff, as Berghuijs et al. (Citation2014) have observed in the United States. In catchments with high snowfall fraction, the runoff is generally higher compared to catchments with the same amount of precipitation, but with lower snowfall fraction. The results by Jenicek et al. (Citation2016) indicated that snow water equivalent (SWE) influenced summer low flow mostly at elevations above 2000 m a.s.l. A reduction in SWE resulted in earlier low-flow occurrence in some cases in years with below-average SWE. Changes in air temperature and precipitation affect low-flow trends (Dierauer et al. Citation2018). In climates with seasonally below-zero air temperatures and snow accumulation in winter, snow-related processes play a role in drought occurrence and intensity (Van Loon Citation2015). Therefore, it is important to separate winter and summer low flows and droughts since both types are controlled by a different mechanism (Floriancic et al. Citation2019). Winter low flows occur because most of the water is stored in the snowpack and thus the runoff is low. In contrast, summer low flows emerge during long-term persistent dry periods when evapotranspiration exceeds precipitation. This leads to a slow depletion of the soil reservoir, which results in low streamflow values (Laaha Citation2002).
The above studies show that there is still limited knowledge of how changes in different snow-related signatures interplay with summer low flows and how sensitive catchments are in different regions at different elevations. Therefore, the aim of this study was 1) to analyse inter-annual variations and trends in selected snow, climate, and low streamflow characteristics in the last 50 years, 2) to relate the runoff changes to trends in climatic variables including changes in snow depth and 3) to explore the low-flow sensitivity of study catchments with respect to their different elevation and climate regime.
As Kreibich et al. (Citation2019) pointed out, there is a lack of reliable, consistent drought impact and vulnerability data, and our current knowledge of drivers relative to drought impacts and causes of drought vulnerability is still very limited. Our study adds to earlier studies by focusing on the combined effect of winter snow storages and precipitation in warm season and its varying importance for low streamflow values in individual catchments. Exploring this combined effect is particularly important in humid regions where annual precipitation is almost uniformly distributed over the year. In our study, we benefit from long-term daily data which represent a variety of climate conditions across Central Europe, such as relatively warmer and wet winters in the west compared to relatively colder and dry winters in the east of our study area.
2 Study areas
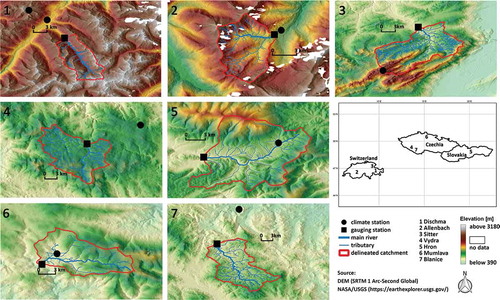
Seven catchments in Central Europe were selected for this study. Three of them (Allenbach, Dischma, and Sitter catchments) are located in the Swiss Alps, two catchments (Blanice and Vydra catchments) are located in the Šumava Mountains (Bohemian Forest, Czechia), one (Mumlava catchment) is located in the Krkonoše Mountains (Giant Mountains, Czechia) and the last one (Hron catchment) is situated in the Nízke Tatry (Low Tatras, Slovakia) (; ). Two criteria were important for catchment selection: 1) near-natural conditions with no major human impact on runoff and 2) availability of long-term hydroclimatic data series. Since changes in snow storages are apparently closely related to elevation, the selected climate stations were divided into three elevation classes: lower elevations below 1000 m a.s.l. (Harrachov and Husinec stations), middle elevations from 1000 to 1500 m a.s.l. (Adelboden, Davos, Churáňov, and Telgárt stations), and higher elevations above 1500 m a.s.l. (Säntis and Weissfluhjoch stations).
Table 1. Selected characteristics of the study catchments and climate stations.
Figure 1. Location of the study catchments. Catchment number 1 is used for the highest catchment (mean catchment elevation) and 7 refers to the lowest catchment.
3 Data and methods
3.1 Data
Data were obtained from the Slovak Hydrometeorological Institute (SHMI), from the Czech Hydrometeorological Institute (CHMI), the Federal Office of Meteorology and Climatology (MeteoSwiss) and from the Federal Office for the Environment (FOEN). The data included mean daily discharge, mean daily air temperature, daily precipitation, and daily snow depth (). Although gridded air temperature and precipitation products are available for Switzerland, we used only station data since gridded products are not available for study areas located in Czechia and Slovakia. Data were controlled for quality and homogeneity.
Table 2. Climate and hydrological variables.
Data from 1966 to 2012 from each station were analysed in this study. To analyse temporal changes, the period was split into two time series of nearly equal length, 1966–1988 and 1989–2012. The found changes were analysed using three different timescales: annual, seasonal and monthly. The analysis using different timescales enabled to explore potential trends in different temporal resolutions. For example, a trend of a specific variable was not detected at an annual level, although some change occurred only in a specific month. The annual timescale was defined for a hydrological year, starting on 1 November and ending on 31 October. The seasonal timescale covered the November to April season (1 November – 30 April, hereafter referred also to as XI–IV). For all three timescales, discharge (m3 s−1), air temperature (°C), precipitation (mm), and snow cover depth (cm) were calculated as mean values (sums for precipitation). Additionally, long-term (1966–2012) mean annual discharge, air temperature, precipitation amount, and snow cover depth were calculated.
3.2 Methods
3.2.1 Snow-related variables
The mean snow depth (Sd) was calculated for days with snow cover higher than or equal to 1 cm which was not interrupted for more than five consecutive days. The snow cover duration (Sddur) was defined as a duration between the first and the last day with snow cover. Depending on the elevation of the individual meteorological station, the snow cover lasted from November to April at the Husinec, Telgárt, and Harrachov stations, from October to May at Adelboden, Davos, and Churáňov, and from September to August at Weissfluhjoch and Säntis. The maximum depth of snow cover (Sdmax) for each month and year and the day of the year of its occurrence (Sdmaxd) were also evaluated (). In case of more days with the same value of Sdmax occurred in 1 year, we used the latest one to capture the late winter maximum before spring snowmelt.
Two different variables describing the proportion of solid and liquid precipitation were used in this study. The first variable, the snowfall fraction (Sf), is the ratio of snowfall to total precipitation (annual, seasonal, monthly). Snowfall fraction values close to 1 indicate a larger amount of precipitation falling as snow (Jenicek et al. Citation2016). The second variable, the snowfall day fraction (Rsd), was defined as the number of days with snowfall divided by the total number of days with precipitation (wet days).
Since the precipitation time series do not usually include the information on whether the precipitation falls as snow or rain, we used a threshold air temperature 1°C to separate between snow and rain. The selected threshold air temperature is widely used by other studies (Dai Citation2008, Berghuijs et al. Citation2014, Jenicek et al. Citation2016). We tested thresholds of 0°C and 0.5°C next to 1°C and analysed their impact on resulting trends.
The use of one air temperature threshold is an acceptable simplification to distinguish between snow and rain which provides comparable results in more complex approaches, such as the application of two threshold air temperatures together with using some transition function for snow and rain between these two thresholds (Dai Citation2008).
3.2.2 Streamflow variables
Several variables were selected to describe streamflow conditions in our study areas. The minimum monthly and annual discharges (Qmin) represent an extreme low flow. The level at which the streamflow is exceeded 90% of the time (Q90, which was derived from the flow duration curve) represents general low flow ().
A hydrological drought was defined as a streamflow deficit event during which discharges are below a given threshold, which was Q90 in this analysis. By using this threshold, the following parameters were calculated: 1) the duration of the drought event in days, 2) the deficit volume of the drought event in m3, 3) days below threshold, 4) minimum discharge, and 5) the date of minimum discharge. The “find_droughts” function implemented in the R package “lfstat” (Koffler et al. Citation2016) was used when deriving the drought variables from the monitored time series (see also Gustard and Demuth Citation2009). Dry periods below the selected threshold (Q90) that lasted for more than 40 days were then selected. This 40-day threshold was selected to capture a variety of drought situations covering both those caused by high air temperatures and low precipitation in summer and those caused by lack of snow storages due to high air temperatures and/or low precipitation during winter.
The observed drought periods were divided into nine types with respect to air temperature and precipitation (based on Van Loon Citation2015; here a slightly modified version of this classification was adopted). Nine periods with the greatest deficit volume were selected. We determined mainly 1) elevations at which most of these hydrological droughts occurred and 2) the extent to which snow affected drought deficit. We determined the correlation between climatic and hydrological parameters on a sample of 10 dry periods for each drought type. Hydrological parameters of the Swiss catchments (Allenbach, Dischma, and Sitter catchments) were assessed for the V–VIII (1 May to 31 August) period, and the parameters of the Czech and Slovak catchments (Blanice, Mumlava, Vydra, and Hron catchments) were assessed for the III–V (1 March to 31 May) period. The reasons for different periods were mainly different catchment elevations and thus different seasonalities of spring runoff caused by snowmelt.
3.2.3 Statistical analysis
The Pearson correlation coefficient was used to evaluate the correlation between hydrological and climate characteristics and between Sf and Rsd. A modified Mann–Kendall trend test (MK test) was used to analyse the data for the presence of consistently increasing or decreasing trends (Mann Citation1945, Kendall and Gibbons Citation1990, Yue et al. Citation2002a). Specifically, monotonic trends were searched using the trend-free pre-whitening technique which employs Sen’s slope estimator determines the strength of autocorrelation (AR(1) process) and applies the Kendall test for significance to the pre-whitened series (Yue et al. Citation2002b). A trend significance level of 0.05 was set for all statistical analyses. In this study, the modified MK test p value was calculated based on the 47-year-long time series (1966–2012) to determine the statistical significance of trends. The magnitude of changes in hydroclimatic parameters and snowfall fraction was expressed by Sen’s slope over the whole period. Two sub-periods (i.e. 1966–1988 and 1989–2012) were selected to determine differences in individual indicators calculated for these two sub-periods.
4 Results
4.1 Changes in snow conditions
4.1.1 Long-term changes in snow cover
Significant declines in Sd occurred mainly at middle elevations (). Specifically, mean annual Sd significantly decreased at the Adelboden station, mostly due to the decrease from January to March and partly in April. January was the month with the largest decrease for the Telgárt station, April for the Davos and Churáňov stations and June and July for the Weissfluhjoch station. At lower elevations (Husinec station), the snow depth declined mostly in April.
Figure 2. Annual, seasonal and monthly Mann-Kendall trends for discharge, air temperature, precipitation and selected snow variables for the study period 1966–2012; monthly, seasonal (XI–IV), and annual values; white used for no significant trends or no snow cover (in case of snow variables). Positive values indicate an increasing trend and negative values indicate a decreasing trend. Catchments are sorted by elevation from highest to lowest.
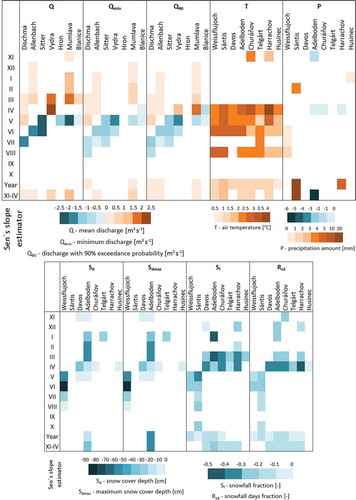
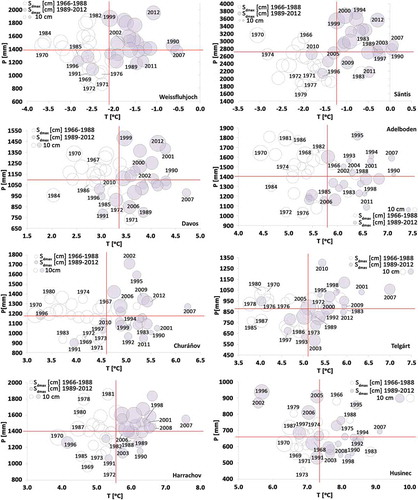
Trends similar to those in Sd were found also for Sdmax, which decreased mostly at middle elevations ( and ). On annual and seasonal timescales, Sdmax declined significantly at the Adelboden station. This decrease was detected in almost all winter and spring months (January to May). At the Telgárt station, the largest decrease in Sdmax was detected in January and at the Churáňov and Davos stations in April and May. At the Davos and Adelboden stations, the trends in Sdmax were also detected in November. For Weissfluhjoch, Sdmax decreased mostly from May to August.
Figure 3. Relationship between air temperature, T, precipitation amount, P, and maximum snow cover depth, Sdmax, in the periods 1966–88 and 1989–2012.
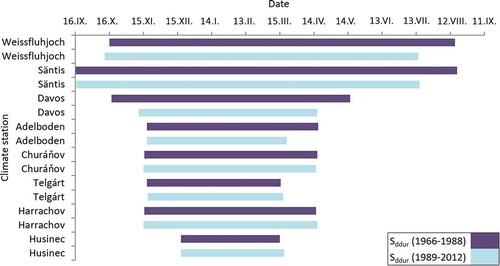
The shortening of the Sddur is also an important factor affecting Sd trends (). At middle and higher elevations (Adelboden, Davos, Säntis, and Weissfluhjoch stations), continuous snow cover was shortened by 1 month during our study period. At the Davos station, the onset of continuous snow cover has shifted forward by a month. We did not detect any significant changes at lower elevations. Sdmaxd occurred earlier in most of the stations in the period 1989–2012 compared to the period 1966–1988. The shift was largest at the Husinec (20 days) and Adelboden (19 days) stations, and smallest at the Weissfluhjoch (4 days) and Churáňov (7 days) stations. In contrast, Sdmaxd occurred a few days later at the Telgárt, Harrachov, and Säntis stations (up to 9 days in Säntis). The reason for this later maximum was not investigated in this study. For Säntis, it might be connected to an increase in precipitation in February (as indicated in ).
Figure 4. Shifts in the beginning and end of snow cover (Sddur) in the periods 1966–1988 and 1989–2012. Climate stations are sorted by elevation from highest to lowest.
4.1.2 Changes in snowfall fraction and snowfall day fraction
The trend analysis confirmed decreases in Sf and Rsd at all stations (). These trends are comparable and do not differ significantly. Notable decreases occurred on both annual and seasonal timescales at all stations with the exception of Husinec. On a seasonal timescale, the largest decrease in Sf (from 12% to 26%) was detected at middle elevations (mostly at Adelboden), whereas at lower elevations the decrease in Sf was less evident (from 11% to 20%). At the highest elevations, no trends were detected for the cold period (decrease by 0.4–1%), although the decreasing trend was detected for the late spring and summer months due to the shifting snowmelt times.
The Sf and Rsd also declined on monthly timescales. At middle elevations, the snowfall fraction was highest in February followed by January (not shown). Sf and Rsd decreased mostly in March and April, especially at Telgárt and Adelboden (). The main reason is increasing air temperature for the XI–IV season by 0.9°C during the whole study period. At the Adelboden station, there was also a significant decrease in precipitation in the XI–IV season. At stations located at higher elevations, Sf and Rsd values were the highest in January, February, and December. Decreases began to occur in May, with the greatest ones at the Säntis station (). At these elevations, air temperature had the smallest impact on the decline in Sf and Rsd, even though it rose substantially here (by 1.2°C in the XI–IV season). At lower stations, the proportion of snow was highest in January and then February. The largest significant decreases in Sf and Rsd occurred in April and March. This was caused by increasing air temperature (by 0.9°C in the XI–IV season) and at Harrachov by significantly decreasing precipitation in April. The correlation between Sf on one hand and climatic parameters on the other is shown in .
Figure 5. Comparison of snowfall fraction Sf and snowfall days fraction Rsd for air temperature thresholds 1°C, 0.5°C, and 0°C in 1966–2012 in April for Telgárt, in March for Adelboden, and in May for Säntis.
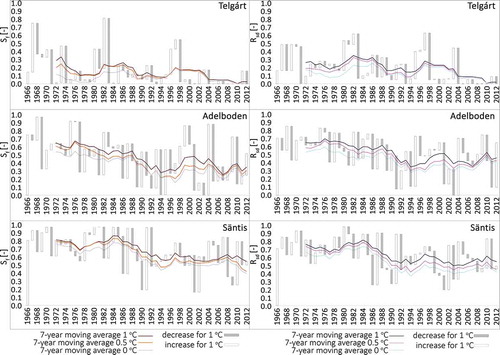
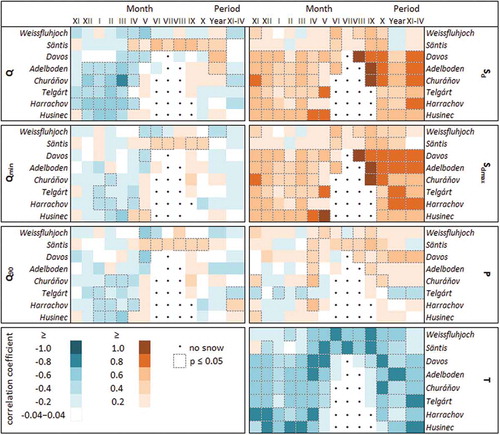
Figure 6. Correlation of snowfall fraction, Sf, with hydroclimatic parameters (air temperature, T; precipitation amount, P; snow cover depth, Sd; maximum snow cover depth, Sdmax; discharge, Q; minimum discharge, Qmin; and discharge with 90% exceedance probability, Q90) for months, the XI–IV season and years. Climate stations are sorted by elevation from highest to lowest.
To make the results more robust, several threshold values differentiating between snow and rain were tested. The change in the threshold value from 0°C to 1°C resulted in more frequent and stronger decreasing Sf and Rsd trends, especially at middle and lower elevations (). At higher elevations, the situation was reversed; the strength and frequency of decreasing trends often increased with decreasing threshold air temperature, especially at the Säntis station. Different threshold values resulted in somewhat larger differences in Rsd. Interestingly, the differences in threshold values have been negligible at the Telgárt station since roughly the mid-1990s.
4.2 Impacts of changes in snow cover on runoff and hydrological drought occurrence
4.2.1 Assessing runoff trends
On an annual timescale, no significant runoff trends were detected. On seasonal timescales, discharges increased significantly, especially in the Allenbach and Mumlava catchments (by 20–37%, ). Correlation was examined between discharge and precipitation and between Sf (Rsd) values and air temperature (). As shown in Section 4.1, changes in precipitation and snowfall fraction were most significant at the Adelboden station. Higher seasonal air temperature (XI–IV) caused more frequent and earlier snowmelt, which resulted in the discharge increase. This is most clearly manifested at middle and lower elevations. The situation changes, however, in late spring, when snow at middle and higher elevations melts during March and April and Sf and Rsd decrease significantly. There is a significant correlation between these snow characteristics and discharge. Increasing air temperature, and at some stations (Adelboden, Churáňov, Harrachov) decreasing precipitation as well, contribute to the significant decrease in discharge from May onward.
depicts a similar trend in minimum discharge values (Qmin and Q90). On an annual timescale, Qmin increased at most stations, but significantly only in the Dischma and Mumlava catchments for Qmin, and the Dischma, Mumlava, and Allenbach catchments for Q90. Similar trends were detected on seasonal timescales. In the winter period (XII–II), minimum discharges increased mostly at middle and lower elevations (with the largest increase in the Allenbach and Mumlava catchments). Higher air temperatures and snow changes (decreases in Sf and Rsd) played a role here. In spring (III–V), especially in April and May, Qmin decreased at most stations. In summer (VI–VIII), Qmin decreased in all catchments, but significantly only at middle and higher elevations. These trends continued to autumn (IX–XI).
4.2.2 Hydrological drought occurrence and drought types
Focusing on the trends in air temperature and precipitation, we evaluated a total of 65 dry periods lasting more than 40 days that occurred in our study catchments (). Seasonal water deficits occur in the Allenbach and Hron catchments mainly during winter time (December to February); in the Vydra catchment from January to March; in the Dischma, Sitter, and Mumlava catchments from late winter to early spring (February to March); in the Mumlava catchment also in August; and in the Blanice catchment in August and September. The highest number of dry periods occurred at middle and higher elevations (Hron, Allenbach, and Dischma).
Figure 7. Dry periods and their typology in study catchments in 1966–2012 (based on methodology published in Van Loon Citation2015).
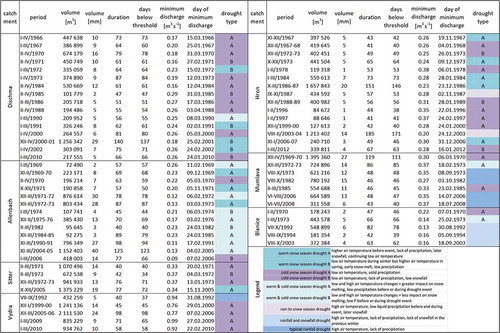
From a regional perspective, similar behaviour in hydrological drought trends was detected in the Hron, Vydra, Dischma, and Sitter catchments (first group) and in the Mumlava, Blanice, and Allenbach catchments (second group). In the first group of the catchments, the hydrological droughts were most frequently caused by low air temperatures in the cold season (winter droughts). Therefore, the precipitation did not reach streams for an extended period of time because precipitation occurred in the form of snow (cold snow season drought A). This type of hydrological drought occurred most frequently in the Vydra () and Sitter catchments. When low winter air temperatures were combined with a precipitation deficit (cold snow season drought B), runoff from spring snowmelt was reduced. This type of hydrological drought was observed in the Hron, Dischma, and Sitter catchments. When there are insufficient precipitation and higher air temperatures in early winter, a delay in the formation of continuous snow cover can be expected (warm snow season drought A). This type of hydrological drought also has a negative impact on water supplies in the catchment, and it was detected in the Hron () and Sitter catchments. The negative effects of higher air temperatures and insufficient precipitation resulted in earlier snowmelt in spring (warm snow season drought B), which could be a potential signal of future water deficits in the catchment. This was most clearly visible in the Dischma catchment. For example, the winter season of 2000/2001 was characterized by high air temperatures and low precipitation. These conditions resulted in a water deficit exceeding one million m3 and the dry period lasted 140 days ().
Figure 8. Typical evolution of dry periods for individual drought types. Solid lines represent the time series of each variable (mean monthly air temperature, precipitation, snowfall fraction, snow cover depth, and discharge); and dotted lines represent long-term means (1966–2012). The red line indicates the duration of the dry period.
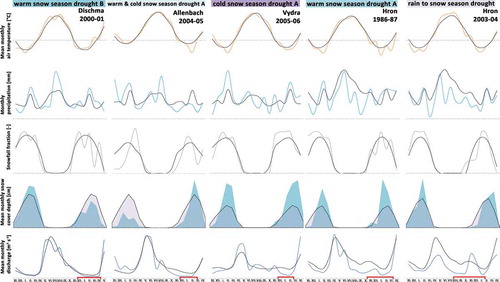
Water deficits in the second group of catchments are also associated with increasing air temperatures and insufficient precipitation, but often in summer and autumn. Insufficient precipitation has a negative impact on water supplies mainly at lower elevations, specifically in the Blanice and Mumlava catchments. Dry periods occurred most often in summer in those catchments (typical rainfall drought) and in autumn, when insufficient precipitation and higher air temperatures had an impact on the situation in early winter (rainfall and snowfall drought). The Allenbach catchment was strongly affected by several melting periods during winter that subsequently affected Sd. When these factors are combined with insufficient precipitation (warm & cold snow season drought A), a long-lasting water deficit occurs. Of all the studied catchments, the Allenbach catchment experienced the longest average dry periods, which often followed each other in quick succession. One example is the hydrological drought of winter 2004/2005 that lasted 125 days (). Of the nine largest water deficits observed, only this one was caused by an insufficient snowpack during the previous winter. The insufficient snowpack combined with below-average precipitation from autumn to spring and higher autumn air temperatures caused a water deficit of 1 152 403 m3, which represents 40 mm of runoff depth. The Allenbach catchment is highly influenced by declining Sd. Here, the continuous snow cover melted a month earlier; Sdmax has occurred 19 days earlier and Sf and Rsd values have declined significantly. Insufficient snowfall in recent decades has had a negative effect on parameters in summer, as confirmed by the significant decrease in Qmin.
The left side of demonstrates that the highest significant correlation between the snowpack in the previous winter season and discharge trends occurs in the following hydrological drought types: warm snow season drought A, cold snow season drought A and B, and warm & cold snow season drought A. Warm & cold snow season drought A and rainfall and snowfall drought types have the greatest impact on Qmin and Q90. It was already confirmed in the findings from the Allenbach catchment that the greatest correlation between the snowpack in the previous winter season and subsequent discharge trends occurs during drought type warm & cold snow season drought A. Air temperature had the most significant effect on low flows in the XI–IV and V–X seasons during this type of hydrological drought.
Figure 9. Correlation of hydrological (discharge, Q; minimum discharge, Qmin; and discharge with 90% exceedance probability, Q90) and climatic (snow cover depth, Sd; maximum snow cover depth, Sdmax; precipitation amount, P; and air temperature, T) variables in the cold (XI–IV) and warm (V–X) half-year that preceded the dry period (left) and the cold (XI–IV) and warm (V–X) half-year during and after the dry period (right).
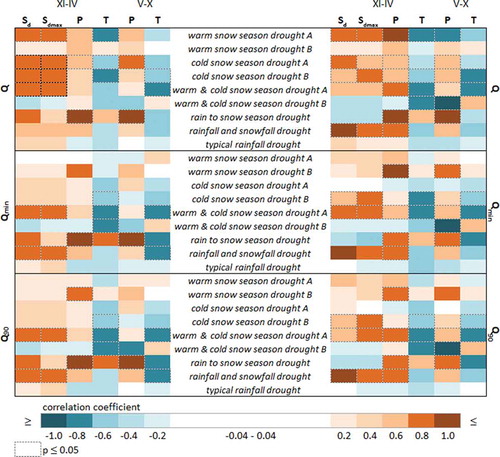
The right side of shows the significant correlation between discharge and precipitation immediately before and during dry periods as well as in the subsequent V–X warm period. The direct influence of Sd and Sdmax on discharge was found in the following hydrological drought types: rainfall and snowfall drought, warm snow season drought A, and cold snow season drought A and B. Less snowpack or a delay in the formation of snow cover is significantly affected by both precipitation and air temperature. Qmin and Q90 have the greatest significant correlation with climatic parameters during drought type warm & cold snow season drought A.
5 Discussion
5.1 Changes in snow conditions
5.1.1 Long-term changes in snow cover
Our results showing changes in Sd at eight climate stations in Central Europe confirmed the earlier findings from other mountainous areas in the Northern Hemisphere which concluded that the amount and duration of snow cover are decreasing (Vojtek et al. Citation2003, Pellicciotti et al. Citation2010, Knowles Citation2015). More specifically we found that the largest decreases in Sd and Sdmax occurred mostly at middle elevations, which is in accordance with the findings of other studies from Slovakia, France, and Switzerland (Martin and Durand Citation1998, Vojtek et al. Citation2003, Pellicciotti et al. Citation2010). Vojtek et al. (Citation2003) have discovered less snowfall and changes in the snow cover duration at elevations below 1000–1500 m a.s.l. in Slovakia due to higher air temperatures. The critical impact of air temperature on the changes in Sd was also observed at the middle elevation catchments in our study. Higher air temperatures had a negative influence on Sf and Rsd. Furthermore, there is generally less precipitation in the XI–IV period, which was most noticeable at the Adelboden station, where, over the last 50 years, the largest significant declines in Sd occurred ( and ). Knowles (Citation2015) made similar findings in the central parts of the United States.
Labudova et al. (Citation2015) discussed the acceleration of warming at higher elevations of Slovakia (above 2000 m a.s.l.) in comparison with low elevations in the 21st century. In Central Europe, the largest air temperature increase occurred at highest elevations (Weissfluhjoch and Säntis in our study), as also shown by Giorgi et al. (Citation1997) in the Alps and by Knowles et al. (Citation2006) in the western United States. However, this air temperature increase at high elevations did not affect snow storages as dramatically as it occurred at middle elevations, due to the fact that the air temperature at highest elevations is still below the freezing point during winter despite warming.
5.1.2 Changes in snowfall fraction and snowfall day fraction
To assess the proportion of solid and liquid precipitation, we used two different variables, the snowfall fraction Sf and the snowfall day fraction Rsd. Sf is frequently used variable which reflects the amount of precipitation (Huntington et al. Citation2004, Feng and Hu Citation2007, Jenicek et al. Citation2016). Therefore, any potential changes in snowfall during extreme precipitation events (both high and low) would be reflected by this parameter (Lute et al. Citation2015). In contrast, Rsd does not account for absolute amounts of precipitation as it reflects only changes in the number of wet days and the proportion of days with solid or days with liquid precipitation (Sawicz et al. Citation2011, Serquet et al. Citation2011). Therefore, it is reasonable to use both variables for the assessment, although we did not detect any significant differences in trends for these two variables. In general, it is very important to test several snow-related indicators for trend detection rather than one selected indicator since the interplay of individual climate inputs (snow, air temperature) might result in a large variety of outputs (runoff).
Our findings related to the decrease in annual Sf and Rsd () in Central Europe correspond to the findings of other studies in Slovakia, the United States, Czechia, and Switzerland (Vojtek et al. Citation2003, Huntington et al. Citation2004, Feng and Hu Citation2007, Brazdil et al. Citation2009, Jenicek et al. Citation2016). On annual and seasonal timescales, air temperature has the greatest impact on the Sf and Rsd decrease. Higher air temperature significantly influences snowmelt (Ledvinka Citation2015), which occurs earlier, especially at middle and higher elevations (Adelboden, Davos, Säntis, and Weissfluhjoch; ). Berghuijs et al. (Citation2014) reported from the contiguous United States that in catchments with high snowfall fraction, with an increase in air temperature by 2.4°C in 1948–2001, the average annual snowfall fraction decreases by 40%. In the same set of catchments, an increase in air temperature by 4°C resulted in a decrease in snowfall fraction by 60%. Comparing the results from the United States with our results from Central European catchments reveals that especially since the late 1980s the rising average annual air temperature has had the greatest negative impact on Sf at middle elevations (Telgárt, Churáňov, Adelboden, and Davos; ). An increase in air temperature by 0.8°C caused a decrease in Sf on average by 22%. At elevations from 1000 to 1500 m a.s.l, the decline in Sf in the XI–IV season was even more dramatic (); an air temperature increase by 0.9°C caused a decrease in Sf on average by 38%.
When studying the impact of snowfall fraction, choosing an appropriate threshold air temperature is important. For Europe, the frequently used value is 1°C which we used in our study as well. This threshold air temperature was applied by Dai (Citation2008), Berghuijs et al. (Citation2014), and Jenicek et al. (Citation2016). We tested values of 0°C, 0.5°C, and 1°C to compare the impacts of different threshold air temperatures on snowfall fraction at different elevations (see ).
5.2 Impacts of changes in snow cover on runoff and hydrological drought occurrence
5.2.1 Assessing runoff trends
Precipitation totals and precipitation phase are two determining factors influencing runoff (Berghuijs et al. Citation2014, Dierauer et al. Citation2018). Snowfall fraction is mostly affected by air temperature. Higher air temperature in the XI–IV season caused more frequent and earlier snowmelt, which resulted in increased discharge in our study catchments, especially during winter. This was clearly manifested at middle and lower elevation catchments in our study. Similar findings have been made by Birsan et al. (Citation2005) and Pellicciotti et al. (Citation2010) in Switzerland, by Fiala (Citation2008), Kliment et al. (Citation2011) and Langhammer et al. (Citation2015) in Czechia, and Hlavcova and Cunderlik (Citation1998) and Roncak et al. (Citation2019) in Slovakia. In spring, snow at middle and higher elevations melted during March and April in our study period, and Sf and Rsd decreased significantly (). Higher air temperatures and snow changes (decreases in Sf and Rsd) affected the spring flows, which was confirmed by a significant correlation between the decrease in Sf and Rsd and the increase in discharge in this season. Fiala et al. (Citation2010), Kliment et al. (Citation2011) and Berghuijs et al. (Citation2014) came to a similar conclusion. During late spring, mean monthly discharges and minimum discharges declined, which continued throughout summer until autumn. Spring and summer minimum discharges have also decreased in other regions as reported, e.g., by Birsan et al. (Citation2005), Kliment et al. (Citation2011), Kormann et al. (Citation2015), Langhammer et al. (Citation2015), Jenicek et al. (Citation2016), Dierauer et al. (Citation2018), Piniewski et al. (Citation2018).
Most of the results in this study related to catchment runoff were assessed using elevation classes as defined in Section 2. The study catchments were distributed into the classes according to the mean catchment elevation. However, the mean catchment elevation cannot fully describe the hypsography of individual catchments and thus the response of snow storages to changes in air temperature at different elevation zones of a specific catchment. Therefore, the results interpretation based on elevation classes is rather limited in our study. For example, in a catchment with a relatively low mean catchment elevation, but with a large elevation range covering the elevations above 2000 m a.s.l, the late snowmelt in these highest parts (June, July) affects low flows in the low elevation parts of the catchment for a longer period than in a catchment with the same mean elevation but with a smaller elevation range.
Potential uncertainties in results interpretation also stem from the fact that changes in snow and meteorological variables were assessed based on station data rather than catchment means. Therefore, the linkage between trends in snow and streamflow variables might be affected by the fact that the individual climate station does not represent the respective catchment well enough.
5.2.2 Hydrological drought occurrence and drought types
As previous studies have demonstrated, insufficient snowmelt in spring may result in hydrological drought in the following season (Feng and Hu Citation2007, Van Loon Citation2015, Jenicek et al. Citation2016). Based on our results, the Allenbach catchment was affected by frequently occurring melting periods during winter which caused the largest Sd decrease among all study catchments. The warm & cold snow season drought A and B are the most frequent types in this catchment. The former is the only one of the nine evaluated types of hydrological drought which was caused by an insufficient snowpack during the previous winter ( and ). Dierauer et al. (Citation2018) also found a similar correlation between climatic conditions in winter and summer low flows. They also found that warm and dry winters correspond to significantly lower runoff and significantly longer, more severe summer low flows than cool and dry winters. Mountainous regions, where this drought type predominates (e.g. in the Allenbach catchment), seem to be the most affected by regional warming. For the future, it implies that water deficits might not occur in cold months only, but they will become more frequent in warmer months as well, as indicated by respective decreasing trends in our study.
6 Conclusion
This study analysed inter-annual variations and trends in selected snow, climate, and low streamflow characteristics in selected mountain catchments in Central Europe from 1966 to 2012. Specifically, we were focused on how changes in snow cover affected changes in summer runoff, and we explored the runoff sensitivity of the study catchments regarding their different elevations and climate regimes. The main conclusions are the following:
The results from the study catchments showed a significant increase in air temperature by 0.7–1.3°C, decrease in snowfall fraction by 0.4% at highest elevations, by 26% at middle elevations and by 20% at lowest elevations and decrease in snow depth by 1% (highest elevations) to 63% (lowest elevations). In some cases, changes in precipitation in the cold season were detected as well; the largest increase by 33% at the Säntis station and the largest decrease by 16% at the Adelboden station.
In years with relatively high air temperatures during the cold season, there was a lower snow depth and more frequent and earlier snowmelt which caused the increase in winter discharges ranging from 1% in the Blanice and Sitter catchments to 36% in the Mumlava catchment. Furthermore, snowfall fraction progressively decreased at elevations below 1000 m a.s.l. during the study period (due to air temperature increase), which resulted in an increasing trend in winter runoff. Despite the increase in winter runoff, the runoff in late spring (from May onward) decreased due to earlier snowmelt. In addition to the air temperature and snow changes, lack of precipitation played a significant role, which resulted in a decreasing trend in minimum discharge for the period from May to August in Czech and Slovak catchments and for the period from June to August for Swiss catchments.
The changes were most significant in catchments at elevations from 1000 to 1500 m a.s.l. The largest impact of changes in climate variables on hydrological droughts was found in the Allenbach catchment in Switzerland which experienced the longest hydrological droughts in years with frequent fluctuations in winter air temperature and lack of precipitation, which caused below-average seasonal snow storages (warm & cold snow season drought A type). In general, our findings indicated that catchments at elevations from 1000 to 1500 m a.s.l. were more sensitive to increases in air temperature and changes in precipitation compared to catchments at elevations above 1500 m a.s.l.
Our results showed that summer hydrological droughts in mountainous catchments are closely related not only to air temperature (and thus evapotranspiration) and lack of precipitation during summer but they are strongly affected by snow conditions in the previous winter season. Since the snow conditions are very sensitive to any changes in air temperature, our results indicated that the future increase in air temperature and thus decrease in snow storages might significantly affect the future drought seasonality and severity. This might have a large impact on water management applications, such as hydropower production and irrigation, as well as on the ecology of river systems.
Acknowledgements
The authors would like to thank the Slovak Hydrometeorological Institute, the Czech Hydrometeorological Institute, the Federal Office of Meteorology and Climatology (MeteoSwiss), and the Federal Office for the Environment (FOEN) for providing data.
Disclosure statement
No potential conflict of interest was reported by the authors.
Additional information
Funding
References
- Beniston, M., 2003. Climatic change in mountain regions: a review of possible impacts. Climatic Change, 59, 5–31. doi:10.1023/A:1024458411589
- Berghuijs, W.R., Woods, R.A., and Hrachowitz, M., 2014. A precipitation shift from snow towards rain leads to a decrease in streamflow. Nature Climate Change, 4, 583–586. doi:10.1038/nclimate2246
- Birsan, M.V., et al., 2005. Streamflow trends in Switzerland. Journal of Hydrology, 314, 312–329. doi:10.1016/j.jhydrol.2005.06.008
- Blahusiakova, A. and Matouskova, M., 2015. Rainfall and runoff regime trends in mountain catchments (Case study area: the upper Hron River basin, Slovakia). Journal of Hydrology and Hydromechanics, 63 (3), 183–192. doi:10.1515/johh-2015-0030
- Brazdil, R., et al., 2009. Climate fluctuations in the Czech Republic during the period 1961–2005. International Journal of Climatology, 29 (2), 223–242. doi:10.1002/joc.1718
- Dai, A., 2008. Temperature and pressure dependence of the rain-snow phase transition over land and ocean. Geophysical Research Letters, 35, L12802. doi:10.1029/2008GL033295
- Dierauer, J.R., Whitfield, P.H., and Allen, D.M., 2018. Climate controls on runoff and low flows in mountain catchments of Western North America. Water Resources Research, 54, 7495–7510. doi:10.1029/2018WR023087
- Feng, S. and Hu, Q., 2007. Changes in winter snowfall/precipitation ratio in the contiguous United States. Journal of Geophysical Research, 112, D15109. doi:10.1029/2007JD008397
- Fiala, T., 2008. Statistical characteristics and trends of mean discharges of period 1961–2005. Journal of Hydrology and Hydromechanics, 56 (2), 133–140.
- Fiala, T., Ouarda, T.B.M.J., and Hladny, J., 2010. Evolution of low flows in the Czech Republic. Journal of Hydrology, 393 (3–4), 206–218. doi:10.1016/j.jhydrol.2010.08.018
- Floriancic, M.G., et al., 2019. The effects of climatic anomalies on low flows in Switzerland. Hydrology and Earth System Sciences Discussion, 1–18. doi:10.5194/hess-2019-448
- Giorgi, F., et al., 1997. Elevation dependency of the surface climate change signal: a model study. Journal of Climate, 10, 288–296. doi:10.1175/1520-0442(1997)010<0288:edotsc>2.0.CO;2
- Gobiet, A., et al., 2014. 21st century climate change in the European Alps – a review. Science of the Total Environment, 493, 1138–1151. doi:10.1016/j.scitotenv.2013.07.050
- Gustard, A. and Demuth, S., eds., 2009. Manual on low-flow estimation and prediction, WMO – Operational Hydrology Report, No. 50, WMO-No. 1029, Geneva, 136.
- Hlavcova, K. and Cunderlik, J., 1998. Impact of climate change on the seasonal distribution of runoff in mountainous basins in Slovakia. Hydrology, Water Resources and Ecology in Headwaters. Proceedings of the HeadWater’98 Conference held at Meran/Merano, April 1998, Italy. IAHS Publ. no. 248, 39–46.
- Huntington, T., et al., 2004. Changes in the proportion of precipitation occurring as snow in New England. Journal of Climate, 17, 2626–2636. doi:10.1175/1520-0442(2004)017<2626:citpop>2.0.CO;2
- Jenicek, M., Seibert, J., and Staundinger, M., 2018. Modeling of future changes in seasonal snowpack and impacts on summer low flows in Alpine catchments. Water Resources Research, 54 (1), 538–556. doi:10.1002/2017WR021648
- Jenicek, M., et al., 2016. Importance of maximum snow accumulation for summer low flows in humid catchments. Hydrology and Earth System Sciences, 20, 859–874. doi:10.5194/hess-20-859-2016
- Kendall, M.G. and Gibbons, J.D., 1990. Rank correlation methods. 5th ed. New York: Oxford University Press.
- Kliment, Z., et al., 2011. Trend analysis of rainfall-runoff regimes in selected headwater areas of the Czech Republic. Journal of Hydrology and Hydromechanics, 59 (1), 36–50. doi:10.2478/v10098-011-0003-y
- Knowles, N., 2015. Trends in snow cover and related quantities at weather stations in the conterminous United States. Journal of Climate, 28, 7518–7528. doi:10.1175/JCLI-D-15-0051.1
- Knowles, N., Dettinger, M.D., and Cayan, D.R., 2006. Trends in snowfall versus rainfall in the Western United States. Journal of Climate, 19, 4545–4559. doi:10.1175/JCLI3850.1
- Koffler, D., Gauster, T., and Laaha, G., 2016. Lfstat: calculation of low flow statistics for daily stream flow data. Available from: https://CRAN.R-project.org/package=lfstat [Accessed 12 February 2019].
- Kormann, C., et al., 2015. Attribution of high resolution streamflow trends in Western Austria – an approach based on climate and discharge station data. Hydrology and Earth System Sciences, 19, 1225–1245. doi:10.5194/hess-19-1225-2015
- Kreibich, H., et al., 2019. How to improve attribution of changes in drought and flood impacts. Hydrological Sciences Journal, 64 (1), 1–18. doi:10.1080/02626667.2018.1558367
- Kucerova, D. and Jenicek, M., 2014. Comparison of selected methods used for the calculation of the snowpack spatial distribution, Bystřice River basin, Czechia. Geografie, 119 (3), 199–217. doi:10.5167/uzh-101156
- Laaha, G., 2002. Modelling summer and winter droughts as a basis for estimating river low flows. FRIEND 2002: regional Hydrology: bridging the Gap between Research and Practice. Proceedings of the Fourth International FRIEND Conference held at Cape Town, March 2002, South Africa. IAHS Publ. no. 274, 289–295.
- Labudova, L., Fasko, P., and Ivanakova, G., 2015. Changes in climate and changing climate regions in Slovakia. Moravian Geographical Reports, 23 (3), 70–81. doi:10.1515/mgr-2015-0019
- Langhammer, J., Su, Y., and Bernsteinova, J., 2015. Runoff response of climate warming and forest disturbance in a mid-mountain basin. Water, 7, 3320–3342. doi:10.3390/w7073320
- Ledvinka, O., 2015. Evolution of low flows in Czechia revisited. Proceedings of the International Association of Hydrological Sciences, 369, 87–95. doi:10.5194/piahs-369-87-2015
- Lute, A.C., Abatzoglou, J.T., and Hegewisch, K.C., 2015. Projected changes in snowfall extremes and interannual variability of snowfall in the western United States. Water Resources Research, 51 (2), 960–972. doi:10.1002/2014WR016267
- Mann, H.B., 1945. Nonparametric tests against trend. Econometrica, 13, 245–259. doi:10.2307/1907187
- Marke, T., et al., 2018. Simulation of past changes in the Austrian snow cover 1948–2009. Journal of Hydrometeorology, 19 (10), 1529–1545. doi:10.1175/JHM-D-17-0245.1
- Martin, E. and Durand, Y., 1998. Precipitation and snow cover variability in the French Alps. In: M. Beniston and J.L. Innes, eds. The impacts of climate variability on forests. Heidelberg/New York: Springer-Verlag, 81–92. doi:10.1007/BFb0009761
- Pellicciotti, F., Bauder, A., and Parola, M., 2010. Effect of glaciers on streamflow trends in the Swiss Alps. Water Resources Research, 46, W10522. doi:10.1029/2009WR009039
- Piniewski, M., Marcinkowski, P., and Kundzewicz, Z.W., 2018. Trend detection in river flow indices in Poland. Acta Geophysica, 66, 347–360. doi:10.1007/s11600-018-0116-3
- Roncak, P., et al., 2019. Impacts of future climate change on runoff in selected catchments of Slovakia: managing risks and building resilience to climate change. Climate Change Adaptation in Eastern Europe, 279–292. doi:10.1007/978-3-030-03383-5_19
- Sawicz, K., et al., 2011. Catchment classification: empirical analysis of hydrologic similarity based on catchment function in the eastern USA. Hydrology and Earth System Sciences, 15, 2895–2911. doi:10.5194/hess-15-2895-2011
- Serquet, G., et al., 2011. Seasonal trends and temperature dependence of the snowfall/precipitation-day ratio in Switzerland. Geophysical Research Letters, 38 (7), L07703. doi:10.1029/2011GL046976
- Staudinger, M., et al., 2017. Catchment water storage variation with elevation. Hydrological Processes, 31, 2000–2015. doi:10.1002/hyp.11158
- Van Loon, A.F., 2015. Hydrological drought explained. WIREs Water, 2, 359–392. doi:10.1002/wat2.1085
- Vojtek, M., Fasko, P., and Stastny, P., 2003. Some selected snow climate trends in Slovakia with respect to altitude. Acta Mathematica Universitatis Comenianae, 32, 17–27.
- Yue, S., Pilon, P., and Cavadias, G., 2002a. Power of the Mann-Kendall and Spearman’s rho tests for detecting monotonic trends in hydrological series. Journal of Hydrology, 259, 254–271. doi:10.1016/S0022-1694(01)00594-7
- Yue, S., et al., 2002b. The influence of autocorrelation on the ability to detect trend in hydrological series. Hydrological Processes, 16, 1807–1829. doi:10.1002/hyp.1095