
 ?Mathematical formulae have been encoded as MathML and are displayed in this HTML version using MathJax in order to improve their display. Uncheck the box to turn MathJax off. This feature requires Javascript. Click on a formula to zoom.
ABSTRACT
In order to provide more accurate reservoir-operating policies, this study attempts to implement effective monthly forecasting models. Seven inflow forecasting schemes, applying discrete wavelet transformation and artificial neural networks are proposed and provided to forecast the monthly inflow of Dez Reservoir. Based on some different performance indicators the best scheme is achieved comparing to the observed data. The best forecasting model is coupled with a simulation-optimization framework, in which the performance of five different reservoir rule curves can be compared. Three applied rules are based on conventional Standard operation policy, Regression rules, and Hedging rule, and two others are forecasting-based regression and hedging rules. The results indicate that forecasting-based operating rule curves are superior to the conventional rules if the forecasting scheme provides results accurately. Moreover, it can be concluded that the time series decomposition of the observed data enhances the accuracy of the forecasting results efficiently.
Editor A. Castellarin Associate editor F.-J. Chang
1 Introduction
Nowadays, forecasting is assumed as an essential part of a water resources system management and reservoir operation procedures (Kistenmacher and Georgakakos Citation2015). This issue has become more crucial when climatic changes and human activities in nature affect the hydrological processes and cause major changes in the availability of water resources. According to the Inter-Governmental Panel on Climate Change (IPCC) fifth report, the temperature of the earth surface has been increasing due to frequent use of greenhouse gases, which introduce a natural flow pattern to serious changes (Pachauri et al. Citation2014). Also, the conditions prevailing on the natural flow of the rivers is changing and will continue to change in the future. As a result, the water reservoir system operating will become more complex due to the stochastic nature of the rainfall, runoff and reservoir inflow (Liu et al. Citation2011, Li et al. Citation2014). The reservoir operation rules that determine the amount of release as a function of the available resources including the storage level and the inflow, are generally employed in the long-term operation of the reservoirs due to their simple structure (Ashrafi et al. Citation2017). The use of specific operating rules to reduce the probable damage to the water resources systems is essential and unavoidable (Ashrafi and Mahmoudi Citation2019). Operational regulations are often calculated based on curve fitting methods or simulation-optimization models (Liu et al. Citation2014). Linear and nonlinear fitting methods (Young Citation1967, Bhaskar and Whitlatch Citation1980, Wang et al. Citation2011) estimate the coefficients of operating rules using specific optimization models and finding the optimal parameters. Also, the simulation-optimization models determine the coefficients by calibration of the parameters of operating rule until one or more optimal objectives are obtained (Ashrafi et al. Citation2017). However, all the mentioned methods are based on the past time series of the flow, meaning that the calculated instruction is constant and does not change in adherence to the dynamic and changing nature of the above-mentioned inflow (Ashrafi Citation2019). Furthermore, optimization is conducted without accounting for flow changes in the future and solutions are proposed according to past period statistics. This leads to the ineffectiveness of operating policies in case of water scarcity. Because the amount of release is determined according to the flow patterns in the previous stages. The review of literature on operating reservoir systems with regard to future flow changes reveals that the foundations of work is based on operating models compatible with the future circumstances and there is a similar structure in this regard, a structure that is composed of an inflow forecast model and a reservoir operation model.
Figure 1. Proposed model development.
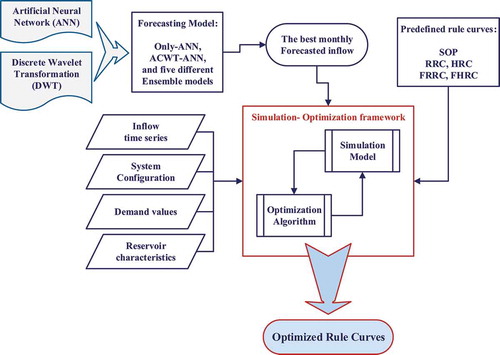
Figure 2. General structure of ACWT-ANN.
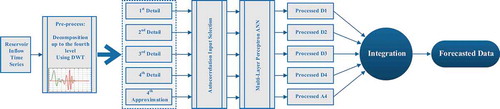
Figure 3. General structure of ECWT-ANN.
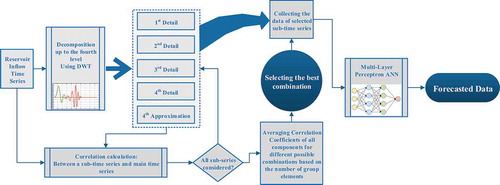
Figure 4. Study area of Dez River basin.
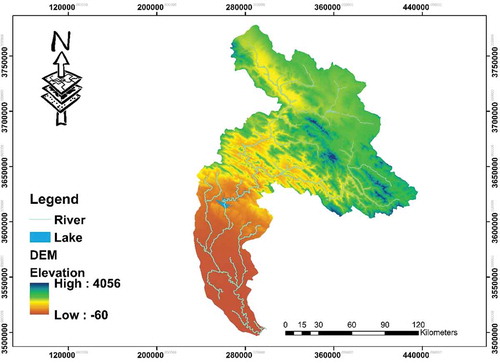
Figure 5. Variation of Detail2 sub-time series of Dez Reservoir inflow.
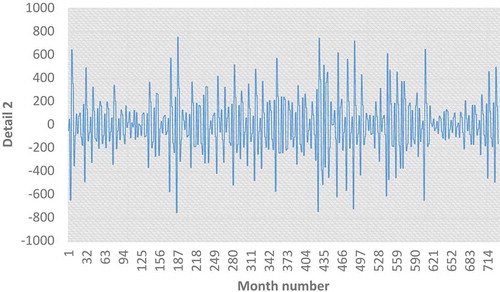
Figure 6. Observed and forecasted streamflow in testing period (a) Only-ANN, (b) ACWT-ANN, (c) Single-ECWT, (d) Dual-ECWT, (e) Triple-ECWT, (f) Quaternary-ECWT and (g) Quintuple-ECWT).
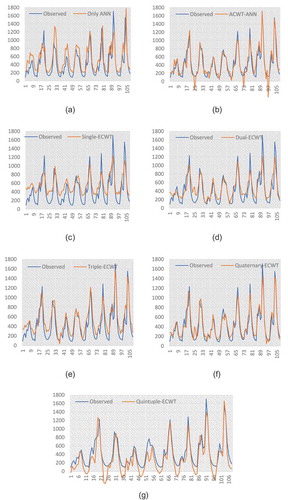
Figure 7. Pre-processing effects on evaluation indexes.
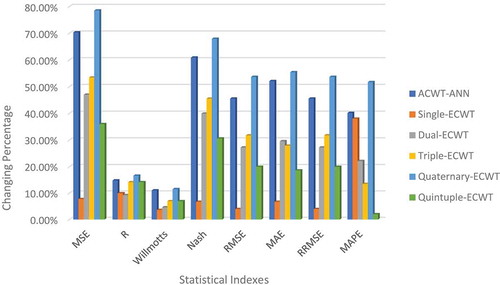
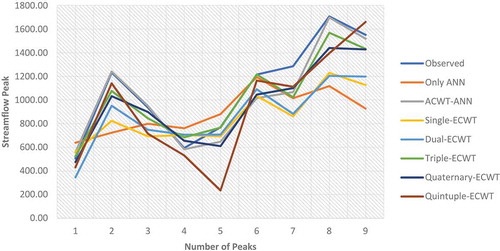
Figure 8. Monthly streamflow peak estimates in the test period.
Ahmadi et al. (Citation2015), and Eum et al. (Citation2009) evaluated the result of the monthly operating rules against the changing pattern of inflow and presented an optimal approach in this respect. Ahmadi et al. (Citation2015) presented a revision method in the operating rules with the objective of adjusting the instructions with different scenarios of inflow changes. Yang and Ng (Citation2016) studied the precision of operating rule curves against the flow time series and developed a measure of the sustainability of a policy against non-stationary flows. Feng et al. (Citation2017) investigated the changes of operating regulations under different scenarios of inflow. Scenarios such as the change in the mean, the coefficient of change and the seasonal variation factor were considered. Li et al. (Citation2018) considered the difference between the operating horizon and the forecast horizon and presented an approach in order to categorize the different operating horizons.
All the above researches focus on assessing the performance of water resources operating strategies under different scenarios of inflow change and acknowledge that the current operating rules are required to be reviewed to adjust to the changing conditions of the flow pattern. However, the direct role of the reservoir inflow and its performance as a term of the operating rules is not investigated.
Recently, some researches have been conducted to combine forecast modeling within the reservoir operation models in managing extreme events such as floods (e.g. Guo et al. Citation2004, Schwanenberg et al. Citation2015, Nohara et al. Citation2016, Amnatsan et al. Citation2018, Wang et al. Citation2019). These studies attempted to achieve the best forecasted values of hydrological parameters in a short time period for managing reservoirs in flood events and reducing the costs and damages. The achieved results are so valuable for flood control. However, the optimized rule curves are not applicable for water resources system management in long-term periods for demand supply or power generation. The forecast models are more effective in shorter lead times (Turner et al. Citation2020) and so developing forecasted reservoir-operating models in hourly or daily time steps is more easily than achieving an effective forecast-based model for reservoir operation in monthly time steps. This study aims to provide a forecast-based model for operating water resources systems and supplying water demands in a long time horizon with monthly time step which helps the system managers to operate reservoirs more effectively.
This issue has attracted the attention of some researchers more recently (e.g. Cheng et al. Citation2015, Chiamsathit et al. Citation2016, Yang et al. Citation2017). Liu et al. (Citation2019) proposed a Bayesian Deep learning method to study the impacts of inflow and model uncertainties on the reservoir operating rule performance. The results showed that the inflow uncertainty can affect the efficiency of the reservoir operation rules more than the model parameter uncertainty. Gavahi et al. (Citation2019) presented a forecast-based adaptive real-time operation model (ATROM) for Boukan reservoir. The main aim was maximizing the feeding of Urmia lake constrained to meeting other demands such as irrigation, industrial and domestic uses. The ATROM consists of An adaptive neuro-fuzzy system and an inflow forecast model to compute the optimal releases in future months. Results demonstrated that the ATROM attains an objective function value very close to the best possible value that can ever be reached by utilizing an ideal operation model, benefiting from perfect foresight on future streamflow. Jin and Lee (Citation2019) aimed to present a discrete hedging rule which runs through several hedging phases to introduce an effective method for water supply operation. Two different rule curves were derived through their study: one was based on available water that accompanies prediction of the current period inflow and the other was based on the beginning storage alone. Results show that the derived hedging rule curves based on the beginning storage were placed higher than the other one and so, induced earlier rationing of water supply. In order to achieve an effective operation rule for a hydropower reservoir system, Feng et al. (Citation2019) proposed a novel class-based evolutionary extreme learning machine (CEELM) in which, an enhanced version of the simple extreme learning machine was implemented. Their proposed model was able to derive more suitable operating rules for hydropower systems. It was indicated that, isolating each subclass composed of similar dataset can improve the model’s capabilities. Allawi et al. (Citation2019) attempted to develop an integrated forecasting-based operational model in which, the reservoir inflow and evaporation were forcasted and a simulation-optimization model generated the optimized reservoir rules. Major findings revealed the necessity of implementing the forcasted values of hydrological variables into operating procedure to achieve more accurate results. Peng et al. (Citation2019) presented a platform consisting of a rainfall-runoff model for inflow forecast and a stochastic dynamic programming model for reservoir operation in order to effectively use the ensemble precipitation forecast with optimized uncertainty. The results show that, hydropower generation can be increased compared to the traditional rule curves, which indicates that the use of forecast facilitates considerably improves the performance of the operating rules. These studies usually focused on the forecasting methods and tried to improve the performance of the forecasting utilities. It should be noted that, the best forecast model is not essentially the most compatible and effective model for a water resources management procedure.
This study aims to develop a suitable inflow forecasting model and evaluate the impact of forecasting process on the reservoir operation. To this end, seven forecasting schemes applying Discrete Wavelet Transformation (DWT) and Artificial Neural Networks (ANN) are proposed and evaluated. Moreover, three conventional structures of reservoir operating rules including; Standard Operating Policy (SOP), Regression-based Rule Curve (RRC) (Revelle et al. Citation1969, Loucks Citation1970, Eisel Citation1972), and Hedging Rule Curve (HRC) (Shih and ReVelle Citation1994) are developed within a simulation-optimization framework. Coupling the best forecasting scheme with different operating rules, shows the effects of forecasting models on the reservoir operation strategies.
2 Methodology
The structure of this study consists of two distinct parts: describing the monthly inflow forecasting model and the simulation-optimization model to determine the optimal operating policy of the Dez water resources system. Seven forecasting methods are used to produce a monthly flow forecast. In the next step, the genetic algorithm is employed to develop the reservoir simulation-optimization model. The development flowchart of the proposed models is illustrated schematically in .
In the forecasting model development process, a three-layer perceptron network is used. The Sigmoid function is chosen as the transfer function of the hidden layer neurons. Moreover, in the decomposition process of the time series, the Haar wavelet is used as the mother wavelet and applied to the fourth level of the pre-processor functions.
2.1 Proposed forecast modelling
Implementing dynamic and data-driven models form two major categories for forecasting monthly river streamflow in prior studies. In this study, data-driven models are used due to their simplicity and smaller of data requirement. Seven different approaches including an Only ANN method and six Preprocessed ANN are defined and applied to this end. In the first approach, named Only ANN, the data enters the training process without any pre-processing based on input selection criteria while the other approaches are based on the data preprocessing. Indeed, regarding the applied structures of preprocessing, seven different models are proposed and their impacts on performance of reservoir operation strategies are analyzed. These models are different with regards to their input selection modules, pre-processor operators, training model and flow-forecasting model evaluation indices.
Since McCulloch and Pitts (Citation1990), proposed the idea of neural network, this machine training model has been frequently used in the forecasting of random parameters (Deo et al. Citation2017). The following general equation can be used to introduce an Artificial Neural Network (ANN):
where X is a vector of input variables, Y indicates the forecasted/simulated value, L is the number of hidden cells, W is the vector of connection weights, b is the bias value and F stands for the activation function. In this paper, we use the tangent sigmoid transfer function in the hidden layers and the linear transfer function in the output layer. The superiority of these functions to predict the inflow to the reservoir is investigated in previous researches (e.g. Moazami et al. Citation2016). During the training process, the values of weights and biases are updated going throughout different iterations until the minimum value of mean square error (MSE) is reached. The applied criterion within the training process is given by:
where Tp and Qp represent the values of target and model output, respectively, at the observation point p.
Various methods are available for selecting influential parameters in a training model, for instance the feature selection techniques such as the wrapper method (Phuong et al. Citation2005) and correlation and auto-correlation concepts, including auto-correlation function (ACF) and partial auto-correlation function (PACF). In this study, correlation concepts are used to select the input parameters to the training model. Also, all input data are normalized to limit the variation and prevent the change on a wide scale (Wang et al. Citation2009).
It is assumed that, there is a natural relation between the forecasted value () of a variable and its previous values (
,
…
). This assumption can be stated by:
where s is the number of lags involved in the training process. It is important to identify s as its small values can cause the elimination and dismissal of the data contained in the input variables and its large values lead to a wide range of irrelevant data to the training model and reduction of its accuracy and speed. It is clear that both small and large values of s have a negative effect on the performance of the forecasting process. It must be noted that ACF provide the value of the linear correlation between various lags of a time series as a function of the lag, while PACF is a conditional correlation. In fact, by identifying the value of the lag in which there is a suitable correlation, the number of effective delays on the monthly planning horizon is obtained.
Six of the seven proposed forecasting models are pre-processed ANN approaches, in which the discrete wavelet transform (DWT) operator is employed with the purpose of deducing the frequency of variation dominant in the initial time series (Mallat Citation1989). The general equation of the DWT function is defined as follows (Polikar Citation1999):
Here, is the mother wavelet function,
, is the scale parameter, b stands for the time transfer parameter and
indicates the discrete wavelet transform of
. The scale parameter determines the wavelet width. In this study, the Haar wavelet is adopted as the mother wavelet:
Struzik and Siebes (Citation1999) proved that the Haar Mother wavelet due to its mathematical formulation is the best choice to analyze the natural phenomena such as hydrological processes. The Haar wavelet is composed based on square waves and therefore facilitates physical interpretations and its results are more compatible with the natural oscillations (Kamruzzaman et al. Citation2014). Moreover, the Haar wavelet is the simplest wavelet with a low pass filter specification which leads to reasonable results in hydrological modelling (Rathinasamy et al. Citation2014). Due to the most compatibilities and its characteristics, the Haar Mother wavelet was the most common wavelet in hydrologic researches recently (Solgi et al. Citation2014, Guimaraes Santos and Silva Citation2014) and is implemented to develop the proposed approach in this study.
The wavelet decomposition level is another parameter which should be determined suitably to achieve appropriate results. Considering the results of the comprehensive sensitivity analysis implemented within this study, the time series of reservoir inflow is decomposed up to the fourth decomposition level. In preprocessed ANN, after decomposition of the initial time series into various sub-series, with regards to the input selection and the type of correlation, two methods are developed based on correlation functions and auto-correlation functions which consist of six different approaches, and along with the Only ANN approach, are the seven schemes studied in this paper.
2.2 Autocorrelation wavelet transform – artificial neural network (ACWT-ANN)
The idea of this process is derived from linear auto-correlation among different components of the inflow time series. The process is based on the separate forecasting of each decomposed component. The input selection of each forecasting model is determined with the help of ACF and PACF input selection criteria. As shown in , the amount of inflow in the forecast horizon is derived from the integration of the forecasted values of each sub-model.
2.3 Ensemble correlation wavelet transform – artificial neural network (ECWT-ANN)
Five different forecasting schemes are based on the ensemble correlation wavelet transform – artificial neural network (ECWT-ANN) approach which is focused instead of auto-correlation, on the correlation between the reservoir inflow as the main variable and each decomposed component (i.e. Detail1, …, Detail4, Approximation4). The number of input variables into the training process are differ for proposed schemes. In these approaches, first correlation coefficients of decomposed components with the original time series are calculated. According to the correlation values, different combinations composed of one to five sub-time series are formed when the original time series is decomposed to four level. For each combination, the selected sub-time series are considered as an input data and entered into the ANN training processes. Indeed, the correlation coefficient is applied as a measure of the selection of input parameters, which is calculated as the average value for different sub-time series. shows the computational flowchart of the proposed ECWT-ANN schemes.
Because there is more information in the approximation component of the main time series, it was decided to be present at each scheme with any number of members.
2.4 Performance evaluation of forecasting models
In order to study the performance and comparison of the seven approaches of monthly flow forecasting models, the following statistical indexes are implemented: the correlation coefficient, R, the Willmott index (WI), Nash-Sutcliffe efficiency (ENS), root mean square error (RMSE), mean absolute error (MAE), relative root mean square error (RRMSE) and mean absolute percentage error (MAPE) (Shamseldin Citation1997, Legates and McCabe Citation1999). Since there is no single and general index with the objective of assessing the forecasting model (Krause et al. Citation2005, Chai and Draxler Citation2014), several functional indices are employed in this study.
where ,
,
and
represent the observed inflow, the forecast inflow, the mean inflow, and the number of sampled data, respectively. The correlation coefficient, R, provides useful information about the degree and direction of the linear relation between predicted and observed value. This coefficient is parametric and is not sensitive to the difference between similar observed and calculated elements and on at the same time it is over-sensitive to the peak values outside of the range. The Nash-Sutcliffe index (ENS) is one of the most common indices in hydrological modeling and is an indicator of the model’s ability to compete with a default model which in this paper is the mean of observed values. It is worth mentioning that this index has an “Overestimate” mode for large values and dismisses negligible values. the Willmott index (WI) overcomes the non-sensitivity problem as it calculates the difference between the observed and calculated values with only first power and is superior to the two above indices, however, it must be noted that WI values larger than 0.65 are possible even for poor models. With respect to model error calculation, the RMSE and MAE are calculated based on the aggregation of residual values of computational and observed data. The RMSE, because of its squaring function, evaluates the accuracy of the model in comparison with large value data and MAE examines them against mean value data. They calculate the absolute error values, thus fail to provide a comprehensive view. In order to compensate for this, two relative indices of RRMSE and MAPE examine the model behavior in different areas of the inflow.
2.5 The water resources operating model
The aim of this study is considering the impacts of forecasting on the minimization of water resources system shortages. Moreover, the effects of the forecasting model on the efficiency of derived operating policies is investigated. In this regard, the two types of different operating policy including Regression based rule curve (RRC) and Hedging rule curve (HRC) are provided to operate a single-reservoir system of Dez River basin, and the effect of combination of these policies with the selected forecast model has been studied. In order to provide the minimum environmental flow and other constraints of the model, the penalty function method is implemented. Other constraints are the reservoir storage constraints, the maximum discharge capacity, and the reservoir loss values. In this study, evaporation is calculated as the only loss component. Based on the above mentioned factors, reservoir planning model is presented as follows:
Subject to:
where Z is the objective function of the problem, indicates amount of system demand at the tth time step,
and
are the storage volumes at the beginning and the end of the month, and
,
,
and
stand for the values of release, evaporation, spill and precipitation, respectively, at month t. Also,
is the weight coefficient of the penalty function that is calculated by performing sensitivity analysis and
as mentioned above is the total weighted violation value, including total deviation from reservoir dead storage and also total deviation from predetermined environmental minimum requirement flow. The two coefficients
and
magnify penalty effects which lead to faster convergence. In the case of feasible space, this ensures the storage level higher than minimum level and also meeting environmental flow requirements as the highest priority demand. The amount of evaporation and precipitation on the reservoir surface, is calculated by an iterative algorithm.
In order to operate water resources systems different operating policies can be defined. The regression-based operating rule (RRC) determines the reservoir release as a function of state variables of water availability in each time step. These state variables can be assumed as reservoir storage, inflow and water demands in different time steps (Dariane and Momtahen Citation2009, Ashrafi and Dariane Citation2017). Both the long-term static rule curves and real-time rules can be formed as a RRC. The long-term static rule uses the past time series of state variables while a real-time rule can determine the amount of release according to the forecasted inflow values. The general structure of a RRC can be summarized as follows (Bolouri Citation2009):
where ,
, and
are the storage volumes, the reservoir inflow and the target demand in the month t. Also, the coefficients of a, b and c represent the weight of the involved terms in the equation, which are calculated during optimization process. Regarding the main aim of this study, the first-order form of this equation is applied to determine the effects of the forecasting process on the efficiency of the operating rule. Therefore, the static and real-time rules are supposed as following equations:
EquationEquation (23)(23)
(23) represents the forecasting based RRC (FRRC), in which
is reservoir inflow during month t, which is achieving from the forecasting model. According to the above mentioned equation, the amount of reservoir release at the beginning of each month, depends on the knowledge of the reservoir storage level, demand values, and the flow rate in the current month.
The hedging rules are the most commonly applied strategies to reduce a water resources system shortages. Due to the non-linearity of the economic cost function caused by demand deficits, system administrators prefer frequent but small deficits over single severe shortages (Shih and ReVelle Citation1994). This leads to the preserve of water and acceptance of a small deficit in the current period to reduce the severe shortages in the future which are considered important economically and socially (Ashrafi and Mahmoudi Citation2019). To begin start the rationing, a threshold volume for each month is defined. When the reservoir storage is less than this threshold at the beginning of the month, the rationing policy begins. Various types of hedging rule have already been defined and introduced by researchers. In continuous hedging, as the operators do not have access to a proper estimation of possible amount of water resources, they are not fully aware of the state of the drought and its approaching. While, discrete hedging rules are more practical and hence more attractive for operators of the water resources systems (Ashrafi and Dariane Citation2017).
In this research, to study the role of inflow forecast in hedging policy, first, two levels of hedging are defined for reservoir management and thus the reservoir storage volume is divided into three zones. For each storage zone a hedging coefficient is defined, based on which the reservoir output value is determined. As a result, there are five unknown parameters for each month, including two levels of hedging and three hedging coefficients. The values of these parameters are determined in the optimization process of operating policy.
where is the amount of released flow to meet the downstream demands in month t,
,
and
are the hedging coefficients in various storage zones of the reservoir and
are reservoir hedging levels in month t. In EquationEquation (24)
(24)
(24) the priority of supply of all demands is considered the same. If different demands are met with a different supply priority, then different rationing coefficients will be applied to meet different priority needs. It is worth mentioning that the above policy does not account for the flow forecast and only determines the output value with respect to the storage level (Ahmadi Najl et al. Citation2016). To form a forecasting based hedging rule curve (FHRC), the provided forecasting model should be coupled with a hedging operation model, and the FHRC hedging relation can be rewritten as follows:
In order to optimize the parameters of the rule curves for all proposed operating approaches, a well-known and efficient real version of genetic algorithm (Holland Citation1973) is used in the form of a simulation-optimization model. The “Random Pairing” and “Alpha Blending” operators are employed in the pairing and crossover stages, respectively. The algorithm parameters (e.g. population size, crossover rate, mutation rate) are achieved regarding the performed sensitivity analysis for each model optimization. The achieved optimization models have been executed independently several times to optimize each reservoir operating model. The optimal values of parameters of different optimization models are summarized in .
3 Case study
In order to investigate the efficiency of the forecasting based operation rules, the single reservoir system of Dez Dam, in Khuzestan Province, southwest Iran, is considered. The Dez River, consists of Sezar and Bakhtiari branches, and joins the Karun River at the BandeGhir and forms the Great Karun River thereafter (Ashrafi Citation2019). shows the location of Dez Reservoir within the Dez River basin in southwest of Iran. Several studies have been carried out to improve the performance of the mentioned system (Dariane and Momtahen Citation2009) and to conduct a systematic simulation (Ashrafi and Mahmoudi Citation2019). In this study, all proposed models are developed and evaluated, for a 60-year time period from October 1957 to December 2017. The water years used in modeling based on the climate of the area begins in October and ends in September. To develop the forecasting models 70% of data (504 months) are used for training, 15% (108 months) for validation and 15% (108 months) for testing the models. Meanwhile, to evaluate the performance of operating policies 70% of data (540 months) are used in the optimization phase and the remaining 30% (216 months) are used in the simulation stage.
To reduce the complexity of the system simulation, the distribution of demand centers is dismissed and the demand centers are assumed to be cumulative.
4 Results
The proposed forecasting models are composed by an artificial neural network and a pre-processor based on discrete wavelet transformations. A time series of monthly inflow to the Dez Reservoir is decomposed into different frequency modes. Employing the decomposition, the information contained in the time series including the frequency of seasonal changes are diligently analyzed and its strengths and weaknesses are evaluated to be applied in the training model. In order to prepare model input, the 60-year time series input data (October 1957 to September 2017) of the Dez Reservoir is decomposed into four levels using Mallat algorithm (Mallat Citation1989).
The output of a wavelet transform is an approximate value and a negligible value. The approximate value represents the trend of the time series which in other words is representative of the long – term changes in the time series that behaves in adherence to a low frequency. The concept is inferred that the more accurately decomposition of data is conducted, the high frequency values further improved their representation of the long-term changes and the forecast performance also improved. Meanwhile, the detail data show a very high transformation frequency and are in other words the error between the approximate value and the initial time series. It is clear that analyzing the behavior of the decomposed component in a training model is difficult and sometimes causes the deviation of the forecast model’s performance. Increasing the number of decomposition levels tends to smooth the series of changes, and provides more control over the behavior of details.
In this study, seven different schemes are adopted with the aim of developing forecasting models. The proposed schemes include Only ANN, Pre-processed ANN, and five ECWT-ANN) named Single-ECWT, Double-ECWT, Triple-ECWT, Quaternary-ECWT and Quintuple-ECWT. The ensemble schemes differ in the number of input components. The best forecasting scheme is selected according to the performance evaluation of the forecasting models and utilized within the reservoir operation frameworks to organize different forecasting based operation models. Applying these models, the efficiency of the proposed rule curves including FHRC, FRRC, HRC and RRC can be evaluated and compared. In the Only ANN, the lags 1, 2, 6 and 12 have the highest correlation and therefore are selected as input variables. In ACWT-ANN, five separate neural networks are required in pre-processing, while Each network operates independently to provide a forecast of a decomposed component. Indeed, different decomposed wavelet sub-time series are utilized by a separate ANN to simulate the next value of the current sub-time series. In this case, the lag values (s = 1 … 10) are evaluated according to auto-correlation values. Similarly, there are five independent networks in all ensembled methods, with the exception that every network predicts the main data. The input selection criterion for each network is the correlation between each decomposed sub-time series and the main data (monthly inflow values). , shows the best found combinations in different ensemble groups according to the correlation values.
Table 1. The achieved parameters of optimization models.
Table 2. Group members of different ensemble models selected by correlation evaluation process.
Here, indicates the fourth approximation of the decomposed time series, where
and
stands for first to fourth Details of the decomposed time series. The values variation is too stochastic and does not follow a specific pattern in Detail2 component where Detail2 sub-series stands for the main deviation from the mean value of the basic time series. Therefore, in the presented approach elimination of Detail2 sub-series enhances the correlation between the original and approximated time series. So, it is supposed to achieve more accurate results removing Detail2 from the forecasting process. illustrates the values variation of Detail2 component of decomposed time series of Dez Reservoir inflow. reveals that Detail2 component is not selected as a group member of the best ensemble models.
The results are presented in a wide range of different statistical indices in . It is necessary to note that these results are related to the simulation of the test period (108 months) and the best performance is selected according to the indexes in the simulation phase. In order to ensure the results of each network, the training function is executed 10 times independently and the final results are investigated in terms of mean and standard deviation of 10 independent performances.
Table 3. Evaluation criteria for different proposed forecasting methods.
It is observed that the coefficient of correlation, R, for the Quaternary-ECWT scheme has the highest value. This value indicates that in terms of linearity, the fit provides a good performance. The Willmott index is almost identical to the correlation coefficient and shows the highest value (0.966) for the Quaternary-ECWT. If the Nash Sutcliffe efficiency coefficient value exceeds 0.9, simulation is highly satisfactory (Shamseldin Citation1997). At the same time, the Quaternary-ECWT scheme shows a very favorable performance with a 0.901 recorded value of NSe, that indicates a significant difference with other applied methods.
The MAE indicator is sensitive to median values and RMSE is affected by peak values. To make a better sight of the model efficiency, the relative indices of RRMSE and MAPE which examine the residual value or model error compared to target value (observed) are calculated. It is shown in that the Quaternary-ECWT approach has a much smaller relative error than the other schemes. From It is concluded that if Detail2 sub-time series is added as one of the main components of binary, ternary or quadruple groups, all evaluation criteria are weakened.
Table 4. Effect of Detail2 sub-time series on evaluation criteria on different ensemble groups.
The simulation results of different proposed approaches are illustrated in , compared to the observed data.
It can be seen that most of the proposed methods do not perform well in estimating peak values. It is also possible to observe that the direct input of inflow data to the training model leads to a form of overestimation in the forecasted values. The decomposition process of initial series by implementing DWT processor exerts a form of underestimation onto the model results. While, DWT affects the values of each of the statistical indices, and the effect may vary depending on the nature of the index. shows the effects of different performed preprocessing on the evaluated performance indices compared to the only-ANN scheme. The MSE index has been highly affected by the decomposition of time series, and has caused this indicator to vary in the Quaternary-ECWT scheme to 80%. It is also observed that the Willmott index has the lowest sensitivity to the pre-processing function, with the highest variation being in the Quaternary-ECWT at about 16%. As observed in all assessment indices, most changes have occurred for the Quaternary-ECWT scheme. This can be due to the faint effect of Detail2 component in the Quaternary-ECWT approach, as it has a very low correlation with the flow as the main data and its absence in the group leads to greater significance of other component in the group’s correlation with the main data. Furthermore, since in Single-ECWT, the main data is predicted using only one member of the decomposed components, the effect of pre-processing is negligible and shows drops to 4% at minimum. this can be due to neural network’s function in determining single variable weight coefficient inputs, as in this mode the variation frequency of a component will have a slight effect on the main forecasted variable.
There are nine maximum values of inflow, called peak values, within the observed time series which should be estimated by forecasting methods. shows the peak values of the forecasted streamflow obtained by proposed approaches compared to the observed data. as mentioned earlier, in Only-ANN approach, an underestimation is observed in peak values. The fact can be due to the small number of samples for peak data. While the ANN is a data-driven approach, decreasing the number of training samples, reduces the result accuracy. summarizes the relative error of estimating peak values of reservoir inflow, applying different considered approaches. The ACWT is the most effective method in estimating peak values which is visible in . This can be due to the nature of auto-correlation approach in this method. where each individual component tends to be estimated in adherence to its behavior and preserve the independence of each decomposed component.
Table 5. Relative error in peak estimation.
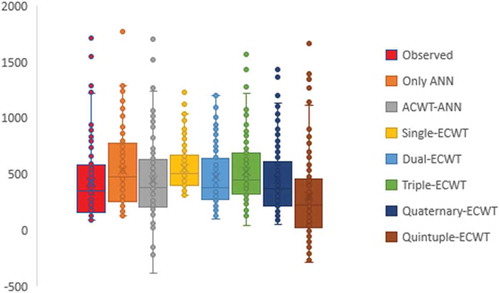
shows the box-plot of observed and forecasted values of the reservoir inflow. The box plot is due to its non-parametric nature, is independent of the initial hypothesis regarding the statistical distribution, which leads to better understanding of the degree of spread and skewness of a time series. Also, the whiskers indicate the variation of data in the high and low quartile (25% and 75%). shows that the degree of spread in Quaternary-ECWT scheme is the same as in the observations. Also minimum, maximum and median values in this method can be assumed as equal to the observed values. Moreover, it is observed that the above mentioned method, similar to the observed values, are skewed in an upward fashion. Although peak values are well estimated by ACWT method, because of the independence of each component in the forecasting process and the presence of dramatic negative values in some details, the diversity rate of forecasted data is more than that achieved by other methods. This issue is also observed in Quintuple-ECWT.
Figure 9. Box plots of observed and forecasted streamflow.
Finally, after gathering points and the results presented in relation to the performance of the forecasting models, the Quaternary-ECWT method has been chosen as the more accurate scheme to be coupled with the simulation-optimization model.
It can be seen that most of the proposed methods did not perform well in estimating peak values of the monthly inflow time series. It is also possible to observe that the direct input of inflow data to the ANN model leads to a form of overestimation in the forecasted values. The decomposition process of initial series by implementing DWT processor exerted a form of underestimation onto the model results. It was observed that all performance criteria have their best values for Quaternary-ECWT. Although the Quaternary-ECWT approach had a much smaller relative error than the other schemes, the ACWT showed the best performance in estimating peak values. This is due to the nature of auto-correlation approach in this method. It can be concluded that the best forecasting method cannot guarantee simulating peak values accurately. From the results It can be seen that decomposing time series into dominant frequencies led to better extraction of hidden features contained in. Of course, It is always necessary to eliminate annoying frequencies or error representations from predictors. In addition, it should be noted that direct prediction of original data using decomposed components had better performance than the ACWT model which indirectly predicts original time series. This can be originated from the interactions between decomposed components, if ignored will lose some of the original information and reduce accuracy.
4.1 Evaluation of proposed operating rule curves
To investigate the effect of the forecasting model on the operation rules, the results are evaluated after coupling of the superior forecasting model with the conventional reservoir operating rules. As shown in , the addition of the monthly streamflow forecast term led to a 10%improvement for regression-based rules. In both cases, optimization model is able to find feasible space. Because of the mathematical properties of the applied objective function, the forecasting-based operating policy (FRRC) has a significant advantage of 10% over the one achieved by non-forecasting model (RRC).
Table 6. Comparison of rule curves in terms of evaluation indexes.
The results also showed the better performance of the coupled model in other assessment indices such as quantitative reliability and maximum vulnerability, 7% and 4% respectively. The above argument applies to the maximum vulnerability. The point is that the maximum vulnerability indicator is barely sensitive to the changes in the operating rule, as this index is the maximum monthly value of a relative shortage and the improvement of each unit means significant reduction in monthly supply of the demand. Furthermore, the improvement of the quantitative reliability of the data regarding the possible streamflow in current month shows that the awareness of the operators of the possible streamflow in the current month and conducting the release accordingly results in more demand coverage.
The advantage of the proposed policy is evident in comparison to the standard operating policy (SOP). Standard operating policy is always assigned the highest reliability, yet exposes the system to large failures. It should be mentioned that the above policies were simulated for the last 15 years of the inflow to the reservoir and during this period the volume of the inflow was decreasing due to the drought, which is why the reliability values, even those of the standard operation policy, are not a high.
The use of forecasting model in hedging policy structure also improves the performance of this policy, which has improved the objective function to a total of 16%. also shows the results comparison for all considered rules. All supply indicators of the system show an improvement in the performance after adopting a rationing policy. Applying the forecasted streamflow term in the hedging rule lead to a 2% improvement in maximum vulnerability, and a 7% improvement in reliability. The hedging rule is superior in comparison to SOP regarding the reduction of the system vulnerability in both cases of the presence or absence of forecasting term and further, because of the nature of the SOP, this policy presents the highest value of reliability.
In this study, a penalty approach is implemented within the simulation-optimization model to obtain feasible solutions. When a penalty approach is applied, the formulation of objective function and adopted penalty coefficients are really important to have a good convergence of the optimization algorithm. In this regard a comprehensive sensitive analysis has been performed to find the most effective values of the coefficients and the best structure of the model. The obtained results indicate that the applied values were suitable and effective.
In , a comparison between the monthly values of supply criterion for regression based rule curves is provided. This comparison shows that during the late summer and the autumn, the impact of forecasting on system performance is far more significant and the values of supply criterion using forecasting model showed a larger improvement. It should be noted that this period is the time of the maximum agricultural demand and the drawdown period of the system’s reservoirs. Generally, it can be concluded that the impact of applying forecasting model within the system management is much more significant during periods when the resources to demand ratio of the system drops to its minimum. The same conclusion is stated for the results of the hedging rules which are summarized in .
Table 7. Monthly comparison of the performance indices for regression-based rules.
Table 8. Monthly comparison of the performance indices for hedging rule curves.
It is inferred that awareness of the reservoir inflows of the coming periods and its direct involvement within the operating policy, it is possible to improve the operating performance. It is Recommended to account the system inflows as a part of system resources within the operating strategies.
With the aim of analyzing the performance of the proposed forecasting based rule curves, variation of the reservoir monthly storage was investigated under FRRC and FHRC. In the months leading to the wet season, the flow forecasting improved the performance of the reservoir operation strategies more efficiently. Because of the awareness of future streamflow, the storage level in the months leading to wet season came closest to the dead storage. This also increases the flexibility of the reservoir and makes more use of its potential. Applying forecasting into the regression rule curve, caused the storage level to drop 7% more towards the minimum level. The same point in the hedging rule decreased the storage level by 11% towards the minimum level. That means providing an additional 11% potential storage space. Accordingly, the amount of reservoir spill will be affected as the awareness of the future flow reduces the risk of filling the storage, reducing the amount of the spill in FRRC by 6% and by 9% in FHRC. Similarly, this improvement was observed in the months leading to the drought, when an awareness of the future streamflow caused the increase of the reservoir storage to the maximum level, as in the months leading to the drought, the further use of reservoir space stores more water to be used during the following seasons. In the FRRC and FHRC, the storage volume increased by 8% and 13%, respectively.
Generally, depending on the accuracy of the forecasting model, the reservoir emptiness can be avoided or reduced in the months leading up to the drought and also the risk of flooding in the months leading up to the wet seasons. Therefore, it is recommended to account the system inflows as a part of system resources within the operating strategies. The further improvement of this work are suggested to focus on the following aspects. As mentioned above, direct effects of forecast term in the rule curve relation led to better performance in two predefined policies. This concept can be generalized in some other mathematical rule curves.
5 Conclusions
In order to develop more efficient water resources operating rule curves, a forecasting-based operating approach was proposed in this study. To find an efficient operating rule curve, seven different forecasting schemes were proposed applying discrete wavelet transformation and artificial neural networks. The most effective forecasting scheme was implemented within the proposed reservoir operating approach. It can be concluded that applying the forecasting process reduced the severity of shortages during a 60-year period of operating Dez Reservoir system.
The FRRC which applied the best trained forecasting scheme, had a significant advantage of 10% over the conventional regression-based rule curve in optimizing the predefined objective function. Moreover, the advantage of the proposed policy is evident in comparison to the SOP. The use of forecasting model in hedging policy structure also improves the performance of this policy, which has improved the objective function to a total of 16%. Furthermore, it was obvious that applying a suitable forecasting-based operating rule improved the performance of the reservoir operation process more efficiently in the months leading to the wet seasons. Also, the proportion of the reservoir emptiness can be reduced in the months leading up to the drought seasons. Comparing the results of different forecasting schemes shows that, applying more accurate forecasting models in such operating-based rule curves enhances the efficiency of the applied rules and reduces the severity of the system shortages in a long time horizon.
In the field of achieving appropriate forecasting model our conclusion can be summarized in two main aspects. First, in order to forecast the upcoming values of a reservoir inflow, adopting a suitable pre-processing procedure increases the efficiency of the ANN-based models, dramatically. In This study, a Discrete Wavelet Decomposition model was applied to decompose the observed time series of the reservoir inflow and then determine the input variables for ANN training process as the pre-processor. Second, the most efficient scheme to forecast the future value of a hydrological time series is not necessarily the most accurate model in estimating peak values. In this study, although the Quaternary-ECWT scheme had a much smaller relative error than the other schemes in the long-term consideration, the ACWT showed the best performance in estimating peak values.
Disclosure statement
No potential conflict of interest was reported by the authors.
Additional information
Funding
References
- Ahmadi, M., Haddad, O.B., and Loáiciga, H.A., 2015. Adaptive reservoir operation rules under climatic change. Water Resources Management, 29 (4), 1247–1266. doi:10.1007/s11269-014-0871-0
- Ahmadi Najl, A., Haghighi, A., and Vali Samani, H.M., 2016. Simultaneous optimization of operating rules and rule curves for multireservoir systems using a self-adaptive simulation-GA model. Journal of Water Resources Planning and Management, 142 (10), 04016041. doi:10.1061/(ASCE)WR.1943-5452.0000688
- Allawi, M.F., et al., 2019. Forecasting hydrological parameters for reservoir system utilizing artificial intelligent models and exploring their influence on operation performance. Knowledge-based Systems, 63 (18), 907–926.
- Amnatsan, S., Yoshikawa, S., and Kanae, S., 2018. Improved forecasting of extreme monthly reservoir inflow using an analogue-based forecasting method: a case study of the sirikit dam in Thailand. Water, 10 (11), 1614. doi:10.3390/w10111614
- Ashrafi, S.M., 2019. Investigating pareto front extreme policies using semi-distributed simulation model for Great Karun River Basin. Journal of Hydraulic Structures, 5 (1), 75–88.
- Ashrafi, S.M., Ashrafi, S.F., and Moazami, S., 2017. Developing self-adaptive melody search algorithm for optimal operation of multi-reservoir systems. Journal of Hydraulic Structures, 3 (1), 35–48.
- Ashrafi, S.M. and Dariane, A.B., 2017. Coupled operating rules for optimal operation of multi-reservoir systems. Water Resources Management, 31 (14), 4505–4520. doi:10.1007/s11269-017-1762-y
- Ashrafi, S.M. and Mahmoudi, M., 2019. Developing a semi-distributed decision support system for great Karun water resources system. Journal of Applied Research in Water and Wastewater, 6 (1), 16–24.
- Bhaskar, N.R. and Whitlatch, E.E., Jr, 1980. Derivation of monthly reservoir release policies. Water Resources Research, 16 (6), 987–993. doi:10.1029/WR016i006p00987
- Bolouri, Y., 2009. Effects of extracting multi-reservoir systemes operational rule curves for different reservoires in system efficiency Doctoral dissertation, M. Sc. Thesis. Faculty of Agriculture and Natural Resource. Soil and Water Department. Tehran University. Karaj, Iran. (In Farsi).
- Chai, T. and Draxler, R.R., 2014. Root mean square error (RMSE) or mean absolute error (MAE)?–Arguments against avoiding RMSE in the literature. Geoscientific Model Development, 7 (3), 1247–1250. doi:10.5194/gmd-7-1247-2014
- Cheng, C.T., et al., 2015. Heuristic methods for reservoir monthly inflow forecasting: A case study of Xinfengjiang reservoir in Pearl river, China. Water, 7 (8), 4477–4495. doi:10.3390/w7084477
- Chiamsathit, C., Adeloye, A.J., and Bankaru-Swamy, S., 2016. Inflow forecasting using artificial neural networks for reservoir operation. Proceedings of the International Association of Hydrological Sciences, 373, 209–214. doi:10.5194/piahs-373-209-2016
- Dariane, A.B. and Momtahen, S., 2009. Optimization of multireservoir systems operation using modified direct search genetic algorithm. Journal of Water Resources Planning and Management, 135 (3), 141–148. doi:10.1061/(ASCE)0733-9496(2009)135:3(141)
- Deo, R.C., et al., 2017. Very short-term reactive forecasting of the solar ultraviolet index using an extreme learning machine integrated with the solar zenith angle. Environmental Research, 155, 141–166. doi:10.1016/j.envres.2017.01.035
- Eisel, L.M., 1972. Chance constrained reservoir model. Water Resources Research, 8 (2), 339–347. doi:10.1029/WR008i002p00339
- Eum, H.I., Arunachalam, V., and Simonovic, S.P., 2009. Integrated reservoir management system for adaptation to climate change impacts in the Upper Thames River basin. Department of Civil and Environmental Engineering, Ontario, Canada: The University of Western Ontario.
- Feng, M., et al., 2017. Identifying changing patterns of reservoir operating rules under various inflow alteration scenarios. Advances in Water Resources, 104, 23–36. doi:10.1016/j.advwatres.2017.03.003
- Feng, Z., et al., 2019. Operation rule derivation of hydropower reservoir by k-means clustering method and extreme learning machine based on particle swarm optimization. Journal of Hydrology, 576, 229–238.
- Gavahi, K., Mousavi, J., and Ponnambalam, K., 2019. Adaptive forecast-based real-time optimal reservoir operations: application to Lake Urmia. Journal of Hydroinformatics, 21 (5), 908–924. doi:10.2166/hydro.2019.005
- Guimaraes Santos, C.A. and Silva, G.B.L.D., 2014. Daily streamflow forecasting using a wavelet transform and artificial neural network hybrid models. Hydrological Sciences Journal, 59 (2), 312–324. doi:10.1080/02626667.2013.800944
- Guo, S., et al., 2004. A reservoir flood forecasting and control system for China/Un système chinois de prévision et de contrôle de crue en barrage. Hydrological Sciences Journal, 49 (6). doi:10.1623/hysj.49.6.959.55728
- Holland, J.H., 1973. Genetic algorithms and the optimal allocation of trials. SIAM Journal on Computing, 2 (2), 88–105. doi:10.1137/0202009
- Jin, Y. and Lee, S., 2019. Comparative effectiveness of reservoir operation applying hedging rules based on available water and beginning storage to cope with droughts. Water Resource Management, 33 (5), 1897–1911. doi:10.1007/s11269-019-02220-z
- Kamruzzaman, M., Metcalfe, A.V., and Beecham, S., 2014. Wavelet-based rainfall–stream flow models for the southeast Murray darling basin. Journal of Hydrologic Engineering, 19 (7), 1283–1293. doi:10.1061/(ASCE)HE.1943-5584.0000894
- Kistenmacher, M. and Georgakakos, A.P., 2015. Assessment of reservoir system variable forecasts. Water Resources Research, 51 (5), 3437–3458. doi:10.1002/2014WR016564
- Krause, P., Boyle, D.P., and Bäse, F., 2005. Comparison of different efficiency criteria for hydrological model assessment. Advances in Geosciences, 5, 89–97. doi:10.5194/adgeo-5-89-2005
- Legates, D.R. and McCabe, G.J., Jr, 1999. Evaluating the use of “goodness‐of‐fit” measures in hydrologic and hydroclimatic model validation. Water Resources Research, 35 (1), 233–241. doi:10.1029/1998WR900018
- Li, H., et al., 2018. Hybrid two-stage stochastic methods using scenario-based forecasts for reservoir refill operations. Journal of Water Resources Planning and Management, 144 (12), 04018080. doi:10.1061/(ASCE)WR.1943-5452.0001013
- Li, L., et al., 2014. Identifying explicit formulation of operating rules for multi-reservoir systems using genetic programming. Water Resources Management, 28 (6), 1545–1565. doi:10.1007/s11269-014-0563-9
- Liu, P., et al., 2014. Parameter uncertainty analysis of reservoir operating rules based on implicit stochastic optimization. Journal of Hydrology, 514, 102–113. doi:10.1016/j.jhydrol.2014.04.012
- Liu, X., et al., 2011. Deriving optimal refill rules for multi-purpose reservoir operation. Water Resources Management, 25 (2), 431–448. doi:10.1007/s11269-010-9707-8
- Liu, Y., et al., 2019. Deriving reservoir operation rule based on bayesian deep learning method considering multiple uncertainties. Journal of Hydrology, 579, 124207.
- Loucks, D.P., 1970. Some comments on linear decision rules and chance constraints. Water Resources Research, 6 (2), 668–671. doi:10.1029/WR006i002p00668
- Mallat, S.G., 1989. A theory for multiresolution signal decomposition: the wavelet representation. IEEE Transactions on Pattern Analysis & Machine Intelligence, 11 (7), 674–693. doi:10.1109/34.192463
- McCulloch, W.S. and Pitts, W., 1990. A logical calculus of the ideas immanent in nervous activity. Bulletin of Mathematical Biology, 52 (1–2), 99–115. doi:10.1016/S0092-8240(05)80006-0
- Moazami, S., et al., 2016. Hydrological assessment of daily satellite precipitation products over a basin in Iran. Journal of Hydraulic Structures, 2 (2), 35–45.
- Nohara, D., et al., 2016. Real-time reservoir operation for flood management considering ensemble streamflow prediction and its uncertainty. In: Advances in hydroinformatics edited by P. Gourbesville, J. Cunge, and G. Caigneart. Singapore: Springer, 333–347.
- Pachauri, R.K., et al., 2014. Climate change 2014: synthesis report. Contribution of working groups I, II and III to the fifth assessment report of the intergovernmental panel on climate change. IPCC, Geneva, Switzerland: Ipcc, 151.
- Peng, A., et al., 2019. The application of ensemble precipitation forecasts to reservoir operation. Water Science & Technology. Water Supply, 19 (2), 588–595. doi:10.2166/ws.2018.105
- Phuong, T.M., Lin, Z., and Altman, R.B., 2005. Choosing SNPs using feature selection. In: 2005 IEEE Computational Systems Bioinformatics Conference (CSB’05), August. Stanford, CA, USA: IEEE, 301–309.
- Polikar, R., 1999. The story of wavelets. In: Physics and modern topics in mechanical and electrical engineering. World Scientific and Engineering Society Press, 192–197.
- Rathinasamy, M., et al., 2014. Wavelet‐based multiscale performance analysis: an approach to assess and improve hydrological models. Water Resources Research, 50 (12), 9721–9737. doi:10.1002/2013WR014650
- Revelle, C., Joeres, E., and Kirby, W., 1969. The linear decision rule in reservoir management and design: 1, development of the stochastic model. Water Resources Research, 5 (4), 767–777. doi:10.1029/WR005i004p00767
- Schwanenberg, D., et al., 2015. Short-term reservoir optimization for flood mitigation under meteorological and hydrological forecast uncertainty. Water Resources Management, 29 (5), 1635–1651. doi:10.1007/s11269-014-0899-1
- Shamseldin, A.Y., 1997. Application of a neural network technique to rainfall-runoff modelling. Journal of Hydrology, 199 (3–4), 272–294. doi:10.1016/S0022-1694(96)03330-6
- Shih, J.S. and ReVelle, C., 1994. Water-supply operations during drought: continuous hedging rule. Journal of Water Resources Planning and Management, 120 (5), 613–629. doi:10.1061/(ASCE)0733-9496(1994)120:5(613)
- Solgi, A., Nourani, V., and Pourhaghi, A., 2014. Forecasting daily precipitation using hybrid model of wavelet-artificial neural network and comparison with adaptive neurofuzzy inference system (case study: verayneh station, Nahavand). Advances in Civil Engineering, 2014, 1–12. doi:10.1155/2014/279368
- Struzik, Z.R. and Siebes, A., 1999. The Haar Wavelet transform in the time series similarity paradigm. In: European Conference on Pricniples of Data Mining and Knowledge Discovery, 15–18 September 1999, Czech Republic, 12–22.
- Turner, S.W., Xu, W., and Voisin, N., 2020. Inferred inflow forecast horizons guiding reservoir release decisions across the United States. Hydrology and Earth System Sciences Discussions, 24, 1275–1291.
- Wang, W.C., et al., 2009. A comparison of performance of several artificial intelligence methods for forecasting monthly discharge time series. Journal of Hydrology, 374 (3–4), 294–306. doi:10.1016/j.jhydrol.2009.06.019
- Wang, X., et al., 2019. A Forecast-Based Operation (FBO) mode for reservoir flood control using forecast cumulative net rainfall. Water Resources Management, 33 (7), 2417–2437. doi:10.1007/s11269-019-02267-y
- Wang, X.L., et al., 2011. A new approach of obtaining reservoir operation rules: artificial immune recognition system. Expert Systems with Applications, 38 (9), 11701–11707. doi:10.1016/j.eswa.2011.03.055
- Yang, P. and Ng, T.L., 2016. Fuzzy inference system for robust rule-based reservoir operation under nonstationary inflows. Journal of Water Resources Planning and Management, 143 (4), 04016084. doi:10.1061/(ASCE)WR.1943-5452.0000743
- Yang, T., et al., 2017. Developing reservoir monthly inflow forecasts using artificial intelligence and climate phenomenon information. Water Resources Research, 53 (4), 2786–2812. doi:10.1002/2017WR020482
- Young, G.K., 1967. Finding reservoir operating rules. Journal of the Hydraulics Division, 93 (6), 297–322.