
 ?Mathematical formulae have been encoded as MathML and are displayed in this HTML version using MathJax in order to improve their display. Uncheck the box to turn MathJax off. This feature requires Javascript. Click on a formula to zoom.
ABSTRACT
The conventional abrupt change-based assessments of climate- and human-induced impacts on streamflow require the existence of change point(s) and stationarity assumption. However, hydrological conditions may not change abruptly at a certain time, but rather evolve gradually over a period. We propose a trend-based time-varying approach that does not require these prerequisites to assess the climate- and human-induced impacts on hydrological conditions in the Pearl River Basin (PRB), China, which can be applied in other basins. The trend-based time-varying approach detects human activities exert a significant seasonal regulation on streamflow (i.e. 113% of the decreases in the wet season and 93% of the increases in the dry season) and 101% of the reductions in flood peaks in the East River Basin, the sub-basin with the highest ratio of total reservoir storage capacity to river discharge in the PRB. Climate change contributes to 77% of the increases in flood peaks in the West River Basin, a large sub-basin with lower flood control levels.
Editor A. Castellarin; Associate editor M. Piniewski
1 Introduction
A scientific understanding of changes in streamflow and floods is crucial for water resource management and flood prevention in a changing environment. Streamflow changes can be attributed to climate change and human activities at various spatial and temporal scales (Sterling et al. Citation2012, Tan and Gan Citation2015, Dey and Mishra Citation2017, Pirnia et al. Citation2019). The acceleration of hydrological cycle under climate change alters the spatiotemporal distributions of water resources and hydrological hazards at various scales (IPCC Citation2013). Human activities can affect the spatiotemporal distributions of the average and extremes of streamflow directly (e.g. through river regulation, water extraction and diversion) and indirectly (e.g. through land use and land cover change).
The impacts of climate change and human activities on streamflow changes have been extensively investigated in different regions around the world (e.g. McMahon et al. Citation2011, Wang et al. Citation2019, Zhang et al. Citation2011). The assessment methods can mainly be classified into two groups: statistical and simulation-based methods (Pooralihoosein and Delavar Citation2020). Statistical methods, such as the climate elasticity method (Huang et al. Citation2016, He. et al. Citation2019) and the ecohydrological approach (Wang et al. Citation2013a), are more flexible and easier to use, but provide less information on the hydrological cycle. Simulation-based methods, such as those based on the Soil Water Assessment Tool (SWAT) and artificial neural networks (Ma et al. Citation2014), are considered as more complex but provide more detailed information on the hydrological cycle. With the development of hydrological models, the simulation-based methods have been increasingly adopted (Xu et al. Citation2013, Dey and Mishra Citation2017, Liu et al. Citation2019). In these studies, simulations of the hydrological model driven by changing climatic factors were compared with observations and hence the differences in water budget components (e.g. runoff and discharge) between simulations and observations were considered to be the contributions of human activities.
In the conventional simulation-based methods, a stereotype is to split the streamflow time series into different time intervals by abrupt change point(s) based on assumptions that (1) statistics of hydrological variables change abruptly after a change point and (2) statistics within the same time interval are statistically stationary (e.g. Ye et al. Citation2013, Tan and Gan Citation2015, Pooralihoosein and Delavar Citation2020). The earliest period is usually treated as a naturalized or reference period. The other later period(s) is (are) considered as period(s) influenced by climate change and human activities and then compared to the reference period. Indeed, some human activities such as reservoir regulation exert abrupt effects on the streamflow regime. However, climate change and other types of human activities, such as land use changes and increases in water withdrawal due to population growth, can be gradual processes, which questions the abrupt-change and stationarity assumptions (Jiang et al. Citation2015). However, as summarized by Pooralihoosein and Delavar (Citation2020), the existing assessment methods in the literature fail to consider the trends of the driving forces.
Therefore, this study proposes a trend-based time-varying approach to evaluate the impacts of climate change and human activities on streamflow. The proposed trend-based time-varying approach is a simulation-based method in which a hydrological model is used to simulate hydrological conditions. Compared to the existing simulation-based method that requires change point(s) and the stationarity assumption, the proposed approach is free of these restrictions and is based on trend analysis by considering the impacts of climate change and human activities as gradual processes. The proposed method is a solution to consider trends in the simulation-based assessment methods, as Pooralihoosein and Delavar (Citation2020) concluded that the trends of the contributing factors are neglected in the existing methods. The proposed trend-based time-varying approach also provides another dimension (i.e. trends) to evaluate the changing hydrological cycle. If a signal (e.g. increases in dry-season streamflow due to human activities) can be detected in the conventional abrupt change-based assessment (which evaluates the changes in averages) as well as the proposed trend-based time-varying approach (which assesses the trends), the signal is more reliable and convincing.
The proposed trend-based time-varying approach is applied in the Pearl River Basin (PRB) as a case study and it can be applied in other basins that the conventional abrupt change-based method can be used, as well as the basins where the change point detection or stationarity assumption are not valid. The PRB is located in South China with a drainage area of approximately 4.42 × 10⁵ km2 ()). The PRB is the second largest river in China in terms of total discharge volume, with a mean annual discharge volume of 336 ×109 m3 (PRWRC Citation2006, Zhang et al. Citation2009). The basin is the major water source for megacities such as Guangzhou, Shenzhen, Hong Kong and Macau ()). The rapid urbanization and population growth of these cities substantially increase the water demand and hence cause greater pressure on the water security and sustainable development of this area. Moreover, such intensive human activities also alter the surface hydrological properties of the PRB. In contrast to other basins in northern China, such as the Yellow River and Haihe River basins, where streamflow has substantially decreased in the past decades due to a significant reduction of precipitation and a substantial increase in water withdrawal, the PRB has experienced insignificant changes in streamflow (Bao et al. Citation2012). Therefore, this paper aims to (a) propose a trend-based time-varying approach to evaluate climate- and human-induced impacts on streamflow; (b) apply the proposed method in the PRB in which the abrupt change in observed hydrological conditions is insignificant and compare the results with the traditional abrupt change-based assessment and (c) discuss the possible mechanisms of changes in seasonal streamflow and floods across the PRB.
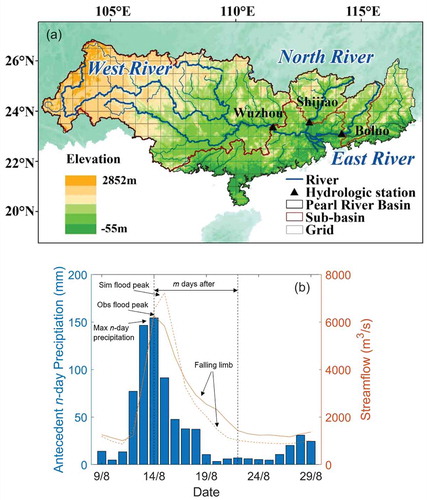
Figure 1. (a) The Pearl River Basin (PRB) and location of hydrological stations. (b) A flood event triggered by an antecedent n-day precipitation (blue bars) in the ERB in 1995. The flood peaks in observations (Obs, solid orange line) and simulations (Sim, dashed orange line) are the maximum observed and simulated streamflow within m days after the n-day precipitation, respectively.
2 Study area and data
2.1 Study area
The PRB is dominated by a subtropical monsoon climate with annual precipitation ranging from 1000 to 2000 mm, in which 72–88% precipitation occurs in the summer, showing a strong seasonal pattern of the hydrological regime (Liu et al., Citation2017). The annual mean temperature varies from 14°C to 22°C. Boluo, Shijiao and Wuzhou are the controlling stations of the East River Basin (ERB), North River Basin (NRB) and West River Basin (WRB), respectively, the three major sub-basins of the PRB ()). Details of the hydrological characteristics of the three sub-basins are shown in (PRWRC Citation2006). The PRB is a major water source for the Pearl River Delta (PRD), an important socio-economic centre in China and one of the largest megacity regions in the world. The ERB provides approximately 80% of Hong Kong’s water supply (Zhang et al., Citation2014).
Table 1. Hydrological characteristics of the sub-basins in the PRB.
Climate change and human activities in the PRB in recent decades have been extensively studied. Previous studies have reported no significant trends in the mean precipitation in the PRB, but precipitation maxima tends to become more extreme under conditions of global warming, which is an important contributor to increases in flood risks (Li et al. Citation2013). Moreover, rapid urban land cover expansion and population growth have significantly altered the surface hydrological properties and substantially increased water demands in the PRB. Urban land-use coverage of the PRD has increased from 29.6% in 1982 to 72.7% in 2010 and the population of the PRD has grown from 24 million in 1990 to 56.1 million in 2010 (Ouyang et al. Citation2006, Wang et al. Citation2013b). The total water usage in the PRB has increased from 60.7 × 10⁹ m3 in 1980 to 83.8 × 10⁹ m3 in 2016 (Li et al. Citation1998, Yao Citation2004). The water usage accounted for 14% of the water resources in the PRB in 2016 and 27.5% in the ERB in 2015 (Zeng and Liu Citation2014). As shown in , reservoirs and embankments are the major measures for flood control and prevention. In the PRB, 387 large and medium reservoirs with a total storage capacity of 46.7 × 10⁹ m3 were built before 2005 (Zhang and Lu Citation2009). The ratio of the total reservoir storage capacity to river discharge is 0.15 for the PRB and approximately 0.78, 0.12 and 0.09 for the ERB, NRB and WRB, respectively, suggesting that streamflow in the ERB is more well regulated (). These natural and anthropogenic factors affect streamflow regimes and floods in different ways. For instance, urbanization and more extreme climates amplify the intensity and frequency of floods, while river regulations and water management mitigate floods in downstream regions and increase streamflow in the dry season. Infrastructure construction (e.g. reservoir) exerts abrupt changes in the streamflow regime, while the impacts of anthropogenic activities such as urban land use expansion and changes in water use can be gradual processes.
2.2 Data
In this study, the daily precipitation and minimum/maximum temperature covering the PRB at a 0.5° × 0.5° spatial resolution are collected from the National Climate Centre of the China Meteorological Administration (Zhao Citation2012). Wind speed is obtained from the National Centers for Environmental Prediction – National Center for Atmospheric Research (NCEP-NCAR) reanalysis (Kalnay et al. Citation1996). Precipitation, temperature and wind speed are used as the meteorological inputs in the hydrological model. The observed daily streamflow for the period 1961–2005 in the ERB, NRB and WRB are collected from the Hydrological Yearbook. The observations of streamflow are used to calibrate and validate the hydrological model. In the implementation of the hydrological model, the soil textural parameters and soil bulk densities, such as porosity, saturated soil potential and saturated hydraulic conductivity, are derived from the Food and Agriculture Organization (FAO Citation1998) combined with the World Inventory of Soil Emission Potentials pedon database (Batjes Citation1995). Vegetation types are obtained based on a 1-km AVHRR-based land classification from Hansen et al. (Citation2000).
3 Methodology
3.1 Hydrological model implementation
The variable infiltration capacity (VIC), a widely used macroscale semi-distributed hydrological model, is used to simulate daily streamflow at a 0.5° × 0.5° spatial resolution over the PRB (Liang et al. Citation1994, Cherkauer and Lettenmaier Citation2003, Niu et al. Citation2015, Citation2017). In this study, the global parameters at a 0.5° × 0.5° spatial resolution developed by Nijssen et al. (Citation2001) are used to represent the land surface conditions in the model. Despite these physically derived parameters, according to the practice of previous studies, seven soil parameters are subject to calibration based on the agreement between simulations and observations, including the infiltration parameter b, the maximum velocity of baseflow Dm, the fraction of maximum baseflow Ds, the fraction of maximum soil moisture content of the third layer Ws, and the thicknesses of the three soil layers d1, d2 and d3 (Xie et al. Citation2007, Shi et al. Citation2008, Gao et al. Citation2010, Li et al. Citation2016). The ranges of these variables for calibration are shown in . Details of the parameters in the VIC model can be found in Gao et al. (Citation2010). The VIC model is separately implemented for the three sub-basins (i.e. ERB, NRB and WRB) with three soil layers at a daily time step in water balance mode. The simulated daily runoff and baseflow in each grid cell are routed by a streamflow routing model proposed by Lohmann et al. (Citation1998).
Table 2. Ranges of the parameters for calibration and the selected optimal values.
The shuffled complex evolution (SCE-UA) method, a global optimization procedure developed by Duan et al. (Citation1993), is used to calibrate the seven abovementioned parameters in the VIC by optimizing an objective function. Schaefli and Gupta (Citation2007) proposed a normalized benchmark efficiency (BE) to measure model performance. The BE measures the improvement of a hydrological model relative to a benchmark model. In this study, the adjusted smoothed precipitation benchmark (ASPB) model, in which rainfall is scaled, shifted and smoothed to match the mean discharge, is used as the benchmark model (Chow et al. Citation1988, Schaefli and Gupta Citation2007). Similar to the objective function defined in Viney (Citation2009), the objective function F used herein is as follows:
where BEannual, BEwet and BEdry denote the annual, wet season and dry season BE, respectively; B is bias as total model error divided by total observed streamflow. The coefficients of this function control the severity and shape of the bias constraint penalties (Zhao et al. Citation2012). Because of rapid urbanization and socio-economic development in the PRB since the 1980s, the observed daily streamflow in the 1961–1970 period is applied to calibrate the VIC. The calibrated model is then validated by comparing simulations against the observations from 1971–1980. The VIC is implemented and calibrated in the three sub-basins. The selected optimal values of the above-mentioned seven calibrated parameters are shown in . Furthermore, the two-sample Kolmogorov-Smirnov (K-S) test is used to compare the statistical distributions of the observations and simulations (Balsamo et al. Citation2011).
3.2 Definitions of seasonal streamflow and floods
The wet season occurs from June to August (i.e. summer) and the dry season is from December to February of the subsequent year (i.e. winter). The annual, wet season and dry season precipitation/streamflow is defined as the mean of the daily precipitation/streamflow in a year, wet season and dry season, respectively.
In previous studies, floods were usually defined as the maximum daily streamflow over a year (e.g. Douglas et al. Citation2000). However, based on this definition, floods identified from the observed and simulated streamflow in the same year can be two different events, because the dates of the maximum daily streamflow can sometimes be different for the observed and simulated streamflow. For example, in the WRB in 2002, the maximum daily streamflow in the observations is on 19 June, while that in the simulations is on 24 August. To ensure the observed and simulated flood events are triggered by the same precipitation event, we adopt the event simulation approach in Park and Markus (Citation2014) to define flood events. The observed maximum n-day precipitation is used as the start of both the observed and simulated flood processes. The antecedent maximum n-day precipitation represents the impacts of antecedent soil moisture, precipitation and runoff concentration, which can be significantly affected by the hydrological characteristics of a basin (e.g. area, topography, soil type). The flood peak generated by that precipitation event is the maximum daily streamflow within m days after the antecedent maximum n-day precipitation as follows:
where Qfi (m3/s) is the flood peak of the ith year and qji is the daily streamflow (m3/s) of the jth day after the antecedent maximum n-day precipitation in the ith year. In this way, observed and simulated flood peaks are generated by the same precipitation event ()).
As shown in the study by Hamlet and Lettenmaier (Citation2007) in the western USA, the systematic bias in simulated floods compared with observations can be large. They corrected the bias of simulations by using the ratio of individual flood volume to the mean volume of floods to represent floods. Hamlet and Lettenmaier (2007) found that estimates of flood quantiles were reasonable after the bias in the simulated mean annual flood was removed. In this paper, to avoid the problem of bias in the simulation of the mean annual flood, we define Flood/Mean to characterize flood events as follows:
where (Flood/Mean)i is the Flood/Mean in the ith year and Qfi and
denote the flood peak (m3/s) in the ith year and the mean of the flood peaks (m3/s) during the model calibration period (i.e. 1961–1970 in this study), respectively. This index represents the relative magnitude of the flood in a year relative to the simulation of mean flood peaks in a unit “1”.
The values of n and m are related to the hydrological characteristics of a sub-basin and therefore they should be varied in different sub-basins. We first obtain the duration of flood recession in flood processes by visual inspection of the falling limbs of all flood events in each sub-basin. ) presents an example hydrograph showing a flood process in the ERB in 1995. The duration of flood recession in this case is approximately 8 days. We inspect all flood processes in the ERB and estimate the general time of flood recession. We find that the durations of most flood recessions are 8, 12 and 25 days in the ERB, NRB and WRB, respectively. Given these m values, we calculate the percentage of annual maximum daily streamflow (the traditional flood definition) captured by the flood definition with various n and then the n with the highest percentage is selected for each sub-basin (). Therefore, floods are defined by n= 3, 4 and 7 for the ERB, NRB and WRB, respectively.
Table 3. Percentage (%) of annual maximum streamflow captured by the flood definition based on m days after the antecedent maximum n-day precipitation in the East River Basin (ERB; m= 8), North River Basin (NRB; m= 12) and West River Basin (WRB; m= 25).
3.3 Abrupt change-based assessment
Abrupt change-based assessment uses abrupt change points to divide streamflow series into a reference period and an impacted period influenced by climate change and human activities (e.g. Li et al. Citation2007, Bao et al. Citation2012). In this study, a year detected by the Mann-Whitney U test (M-W U) (Mann Citation1945, Kendall and Gibbons Citation1990) and t test (Patrick and Shlomo Citation1999) is considered as an abrupt change point and the observed series is split into a number of subseries by the change point(s) (Zhang et al., Citation2013). Hydroclimatic conditions and human activities within each subperiod are assumed to be statistically stationary. The whole observation period is divided into subperiods based on the abrupt change points for the whole PRB. The averages of the observed streamflow of the reference period and the impacted period are denoted by Qref and Qimp, respectively. The change in observed streamflow between these two periods, ΔQ, is calculated as follows:
where ΔQC and ΔQH are changes in streamflow attributed to climate change and human activities, respectively. ΔQC is estimated by:
where Qs,imp and Qs,ref are the averages of the simulated streamflow from the VIC forced by meteorological variables during the impacted period and the reference period, respectively. Because the VIC model is driven by controlled soil and vegetation parameters, the differences between Qs,imp and Qs,ref should be caused by the abrupt change in climate between the impacted and reference periods. In contrast, in the observations, differences between Qimp and Qref are caused by the combined effects of climate change and human activities. Based on EquationEquations (4)(4)
(4) and (Equation5
(5)
(5) ), ΔQH is estimated by:
Therefore, contributions of climate change and human activities to streamflow changes between the impacted and reference periods can be estimated as follows (Bao et al. Citation2012):
3.4 Trend-based time-varying assessment
The impacts of changes in climate and some human activities (e.g. land-use changes) can be treated as gradual processes (Jiang et al. Citation2015). Therefore, in this study, we develop an approach to assess the time-varying impacts of climate change and human activities on streamflow and floods. In this approach, changes in climate and human activities are considered nonstationary. The temporal evolution of streamflow/floods attributed to climate change and human activities is examined using a trend detection method. Let QO, QC and QH denote the time series of the observed streamflow, the streamflow attributed to climate and the streamflow attributed to human activities in the study period, respectively. For year i, the observed streamflow QOi is determined by the streamflow attributed to climate (QCi) and human activities (QHi) as follows:
As the VIC simulations only reflect changes in climate, QCi can be represented by the simulated streamflow QSi. Therefore:
In the abrupt change-based approach, the contribution is defined as the percentage of the change in averages caused by climate change or human activities relative to the absolute value of change in averages of the observed streamflow after a change point (i.e. EquationEquation (7)(7a)
(7a) ). In analogy to this, the contribution of human activities or climate change to the streamflow (φH or φC) is defined as the percentage of the linear coefficients of human activities (aH) or climate change (aC) relative to the linear coefficient of the observations (aO), respectively:
The linear coefficient is the slope of linear regression.
3.5 Significance of the contributions
To detect the significance of the impacts of human activities and climate change in the abrupt change-based approach, time series of streamflow attributed to the climate QC and human activities QH are divided into two subseries before and after the change point. The M-W U test and t test are then used to detect whether the before and after series are significantly different at the 5% or 10% significance level. Regarding the trend-based time-varying approach, a modified version of the Mann-Kendall trend test (MK test), a nonparametric trend detection method, is applied to detect the trends of QH and QC at the 5% or 10% significance level (Mann Citation1945, Kendall Citation1955, Hamed and Rao Citation1998). A significant trend indicates that the gradual change in streamflow attributed to the considered factor is significant.
4 Results and discussion
4.1 Implementation of the VIC model in the PRB
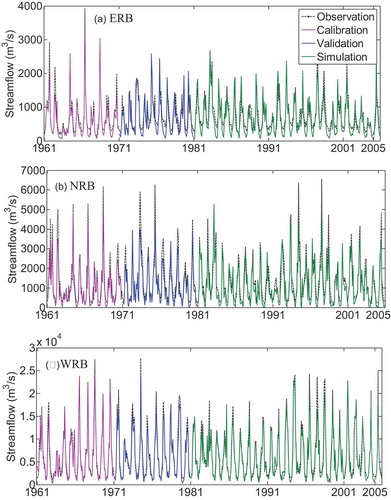
shows the daily and monthly performance measures of the calibrated VIC model during the periods of calibration and validation. The monthly E values of the three stations are all >0.9 in the calibration period and >0.8 in the validation period, showing the acceptable performance of the VIC model. The BE values, which indicate the improvement of the VIC model from the benchmark model, are mostly >0.5, suggesting that the VIC model performs better than the benchmark model in all sub-basins in the annual, wet season and dry season. The values of B are generally within – 0.1 and 0, except in the NRB for the validation period, where it reaches – 0.15. These results show that the VIC model is capable of simulating daily and monthly streamflow for the PRB and outperforms the benchmark model ASPB. The simulated and observed monthly streamflow at three stations for the period 1961–2005 are visually compared in . The simulations match the observations well for the calibration (1961–1970), validation (1971–1980) and simulation (1981–2005) periods, especially the timing of high and low flows. The K-S test indicates that the observations and simulations of Flood/Mean follow the same probability distribution, suggesting an acceptable performance of the simulated Flood/Mean. Overall, the VIC model is a skilful model for streamflow and flood simulations in the three sub-basins in the PRB.
Table 4. Performance measures of the VIC model in the East (ERB), North (NRB) and West (WRB) river basins under the calibration and validation periods. BE, E and B are the normalized benchmark efficiency, Nash-Sutcliffe efficiency and bias, respectively.
Figure 2. Observed and simulated monthly streamflow in (a) the East River Basin (ERB), (b) the North River Basin (NRB) and (c) the West River Basin (WRB) for the period 1961–2005.
4.2 Time-varying assessment of climate- and human-induced impacts
4.2.1 Impacts on seasonal streamflow
The trend-based time-varying approach is applied to assess the temporal evolution of seasonal streamflow attributed to climate change and human activities. In the ERB, the wet season streamflow attributed to human activities (QH) exhibits a significantly decreasing trend, indicating that human activities generally cause a reduction in streamflow in the wet season (). The reduction effects become increasingly considerable over time. In the dry season of the ERB, the significantly increasing streamflow attributed to human activities shows that human activities lead to increases in dry season streamflow and this positive contribution is increasingly obvious over time. The Pearl River Water Resources Commission (PRWRC) has indicated the ERB is the most regulated sub-basin in the PRB with a ratio of total reservoir storage to river discharge of 0.78 (; PRWRC Citation2006). Zhang et al. (Citation2015) indicated that the regulation of reservoirs is the major cause of the decrease in high flows and increase in low flows in the ERB. At the annual scale, streamflow attributed to human activities decreases significantly in the ERB. The demands of water from the ERB have been rapidly increasing due to the tremendous population growth (Chen Citation2001). In 2005, the utilization rate of ERB water was 27.5%, exceeding the sustainable utilization rate of water resources in this sub-basin (Zeng and Liu Citation2014). In the NRB, the impacts of human activities on the annual, wet season and dry season streamflow are insignificant. In the WRB, streamflow attributed to human activities annually and in the dry season exhibit significantly increasing trends, while the trend in the wet season is insignificant. The ratio of total reservoir storage to river discharge in the NRB and WRB is 0.12 and 0.09, respectively, which are much lower than in the ERB, suggesting weaker effects of the seasonal regulation of reservoirs in the NRB and WRB (PRWRC Citation2006). Additionally, compared with the other two sub-basins in the PRB, the ERB is the smallest sub-basin with the least streamflow (), making it relatively more sensitive to human intervention. Zhang et al. (Citation2009) also found a significant increase in the dry season streamflow and sediment load in the lower WRB caused by human activities such as land use changes. In contrast, no significant trends can be found in streamflow attributed to climate (QC) in the three sub-basins, which is in line with the insignificant trends in mean precipitation, excluding significant increases in summer precipitation in the ERB (Zhang et al. Citation2009). The increasing trends in the annual, wet season and dry season temperature are significant in the three sub-basins.
Figure 3. Time-varying streamflow (m3/s) attributed to climate (QC) and human activities (QH) at controlling stations of the ERB, NRB and WRB. Solid lines denote the streamflow; dashed lines denote the linear regressions of the streamflow; and bold dashed lines indicate that the trends are statistically significant in the modified MK trend test.
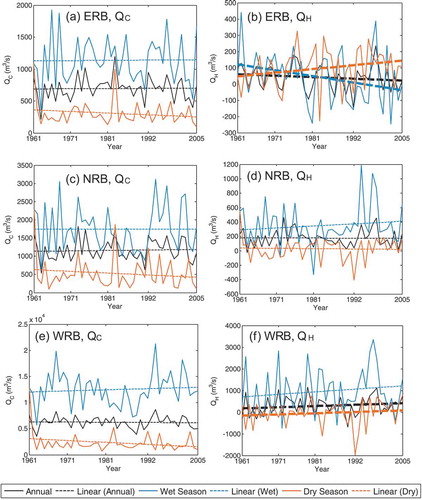
In the ERB, the contributions of human activities to the annual, wet season and dry season streamflow changes are –140%, –113% and 93%, respectively (). As shown in , these impacts of human activities on the ERB are statistically significant. Human activities in the WRB lead to 359% and 317% of the increases in annual and dry season streamflow, respectively. These positive contributions of human activities in the WRB are significant. The contributions of climate change are insignificant for the three sub-basins.
Table 5. Contribution (%) of the changing climate (φC) and human activities (φH) to the changes in seasonal streamflow and Flood/Mean based on the trend-based time-varying assessment. Underlined numbers indicate that the trends are significant.
4.2.2 Impacts on floods
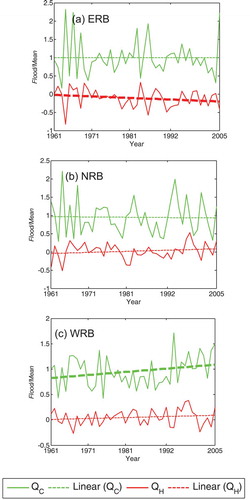
The Flood/Mean attributed to climate change increases insignificantly in the ERB (QC in ). A significantly decreasing trend in the Flood/Mean attributed to human activities (QH) is found in the ERB and the contribution to the reduction is 101%, indicating that human activities such as flood controls can effectively reduce flood peaks ( and ). Climate change and human activities in the NRB cause no significant changes in Flood/Mean. In the WRB, Flood/Mean attributed to climate change increases significantly, while the impacts of human activities are insignificant. These results are in line with the ratio of the total reservoir storage capacity to the river discharge of the sub-basins (i.e. 0.78, 0.12 and 0.09 in the ERB, NRB and WRB, respectively). Climate change significantly contributes to 77% increases in Flood/Mean in the WRB, while the impact on the ERB and NRB is insignificant. Zhang et al. (Citation2009) analysed the observed precipitation and found that the intensity of precipitation extremes significantly increased in the WRB in the period 1951–2005, while those in the ERB and NRB were not significant.
Figure 4. Time-varying Flood/Mean caused by climate (QC) and human activities (QH) at controlling stations of the ERB, NRB and WRB. Solid lines denote the streamflow; dashed lines denote the linear regressions of QC and QH; and bold dashed lines indicate the trends are statistically significant in the modified MK trend test.
4.3 Abrupt-change assessment of climate- and human-induced impacts
4.3.1 Impacts on seasonal streamflow
Precipitation in the wet season in the ERB, NRB and WRB, as well as streamflow in the wet season in the NRB and WRB, are observed to increase abruptly after 1992 ( and ). The areal temperature in the ERB, NRB and WRB annually and in the dry season increases significantly after 1992, implying that potential evapotranspiration may increase accordingly (). Previous studies have also found that precipitation, streamflow and sediment in the PRB were subject to abrupt changes in the 1990s (Zhang Citation2009). Therefore, 1992 is adopted as the year representing the abrupt change point across the PRB. Precipitation and streamflow series (i.e. 1961–2005) are split into two subperiods: 1961–1992 (the reference period) and 1993–2005 (the impacted period). However, no abrupt-change points are detected for annual and dry season precipitation and streamflow in the three sub-basins, suggesting various changing behaviours of precipitation and streamflow in different seasons. In the conventional abrupt change-based approach, abrupt-change points must first be identified and the hydrological cycle is assumed to abruptly change at that time, while our change-point analysis shows that this assumption may not reasonably represent the changes in climate and streamflow across the PRB. Even in such cases, the abrupt-change assessment is still used to estimate the fractional contributions of climate change and human activities on changes in streamflow after the change point.
Figure 5. Areal average of precipitation in (a) the ERB, (c) the NRB and (e) the WRB and areal average of temperature in (b) the ERB, (d) the NRB and (f) the WRB. The vertical dashed line denotes the abrupt-change year of 1992. Horizontal dashed lines denote the averages of the periods before and after the change point; and bold dashed lines indicate that the changes after the change point are significant.
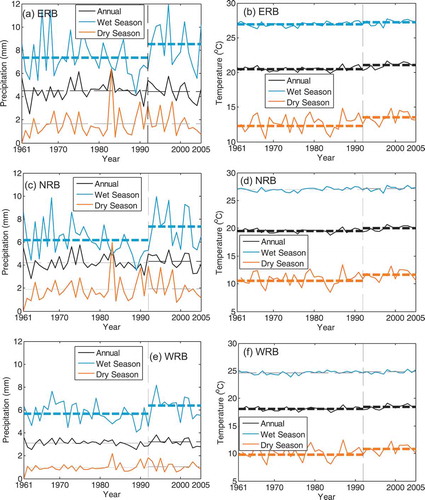
Figure 6. Areal average of the observed streamflow (Obs) in (a) the ERB, (c) the NRB and (e) the WRB and areal average of the simulated streamflow (Sim) in (b) the ERB, (d) the NRB and (f) the WRB. The vertical dashed line denotes the abrupt change year of 1992. Horizontal dashed lines denote the averages of the periods before and after the change point; and bold dashed lines indicate that the changes after the change point are significant.
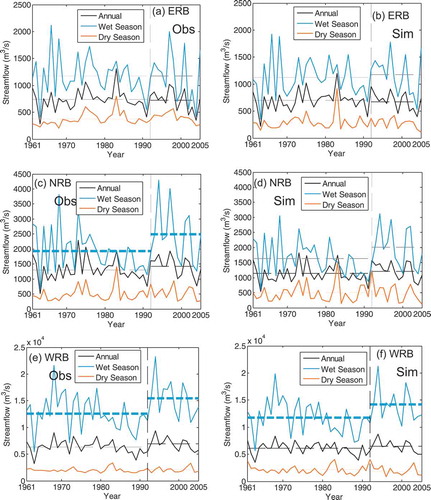
No significant changes after 1992 can be found for the observations and simulations of annual and dry season streamflow (). Climate change (i.e. insignificant changes in precipitation but significant increases in temperature) after the change point contributes to 77%, 567% and 205% of the decreases in dry season streamflow in the ERB, NRB and WRB, respectively (). In contrast, human activities contribute to 177%, 667% and 305% of the increases in dry season streamflow over the ERB, NRB and WRB, respectively. Thus, human activities mitigate the drying conditions in the dry season, which may be caused by the seasonal regulation of reservoir operations and increases in runoff generation due to land use changes, as discussed in Section 4.2.1. In the wet season, precipitation of the three basins increases significantly (). However, in the ERB, no significant increases are found for the observed and simulated wet season streamflow (). In the wet season of the NRB and WRB, the observed streamflow increases significantly after the change point, although the simulated streamflow in the NRB increases insignificantly; 72% and 87% of the increases in observed wet season streamflow in the NRB and WRB are attributed to climate change, respectively (). Human activities contribute to 28% and 13% of the increases in wet season streamflow in the NRB and WRB, respectively. Decreases in wet season streamflow attributed to human activities offset the increases attributed to climate change in the ERB. Therefore, human activities contribute to increases in the wet season streamflow. The annual streamflow changes insignificantly over the three sub-basins after the change point (). shows that human activities tend to increase the annual streamflow. However, most of the contributions of climate change and human activities are statistically insignificant, excluding the contribution of climate change to the wet season streamflow in the WRB.
Table 6. Streamflow changes (m3/s), Flood/Mean changes and contribution (%) of the changing climate and human activities after 1992 based on the abrupt change-based assessment. O, C and H denote observation, climate change and human activities, respectively. Underlined numbers indicate that the contributions after the change point are significant.
4.3.2 Impacts on floods
The observed and simulated Flood/Mean as well as the antecedent maximum n-day precipitation exhibit no abrupt changes after 1992 in the three sub-basins (not shown). Hydrological simulations indicate that climate change alone causes a 10% reduction in Flood/Mean after the abrupt-change point in the ERB (). Human activities contribute to 90% decreases in Flood/Mean in the ERB. In the NRB, climate change and human activities contribute to 61% and 39% increases in Flood/Mean, respectively. The contribution of climate change to increases in Flood/Mean in the WRB is 90% and the other 10% increases are attributed to human activities. The observed Flood/Mean decreases slightly in the ERB but increases in the NRB and WRB. The contributions of climate change and human activities to Flood/Mean are all statistically insignificant ().
4.4 Comparison of the trend-based time-varying and abrupt-change assessments
summarizes the contributions and significance of impacts of climate change and human activities based on the trend-based time-varying approach and the abrupt change-based approach. Both assessments agree that human activities reduce the wet season streamflow and increase the dry season streamflow in the ERB, which is very likely to reflect the seasonal regulation of reservoirs. In the NRB, positive impacts of human activities on dry-season streamflow are detected in both assessments. In the WRB, both assessments indicate that human activities cause increases in annual and dry season streamflow. The trend-based time-varying assessment indicates that these contributions of human activities are statistically significant in the ERB, NRB and WRB, while the abrupt-change assessment shows that the contributions are insignificant. The time-varying assessment also indicates an insignificant contribution of climate change to the seasonal streamflow in the three sub-basins, which is in line with the insignificant trends in seasonal precipitation (Li et al. Citation2013). Discrepancies of the percentage contributions in the two approaches are found, because the abrupt change-based approach evaluates the changes of the averages between two periods, while the trend-based time-varying assessment is based on the trends of the whole study period. The discrepancies among different assessment methods were also reported in Pooralihoosein and Delavar (Citation2020). In general, the two assessments can reach agreements on the directions of the signals that are strong and significant (except the signal of human activities in the ERB at the annual scale). For example, the increases of dry-season streamflow due to human activities in the ERB can be detected in the changes in averages (abrupt change-based approach) and trends (trend-based time-varying approach). The consensus of the two approaches based on different statistics can help confirm the contributions of these factors on changes in streamflow regimes, which are usually well supported and evidenced by changes in the climate and hydrological properties of the basins. The two approaches may disagree on the directions of contributions in the signals that are insignificant. For example, climate change in the NRB at the dry season led to an insignificant increasing trend but an insignificant decrease in streamflow average after the abrupt-change point.
Table 7. Contributions of the changing climate and human activities to seasonal streamflow and floods based on trend-based time-varying and abrupt-change assessments. C and H denote climate change and human activities, respectively. Underlined numbers indicate that the contributions are significant.
4.5 Hydrological reasons of the impacts
The strong seasonal regulation of streamflow in the ERB and significant positive contributions of human activities in the WRB can be well explained by the hydrological characteristics of the sub-basins. The ratios of the total reservoir storage capacity to river discharge are 0.78, 0.12 and 0.09 for the ERB, NRB and WRB, respectively, showing that the ERB has a much higher capacity to regulate seasonal streamflow, resulting in a reduction of the wet season streamflow and increase in the dry season streamflow (). The ratios for the NRB and WRB are much lower and thus the signal for seasonal regulation is weaker in both sub-basins. However, in the WRB, which has a much larger sub-basin compared with the ERB and NRB, the aggregated impacts of land use changes may increase runoff in the basin (Zhang and Lu Citation2009).
The trend-based time-varying assessment suggests that human activities lead to significant reductions in the flood peak in the ERB and climate change causes significant increases in the flood peak in the WRB. These impacts on Flood/Mean are well supported by the flood control conditions and hydrological properties of the sub-basins, as well as the spatiotemporal changes in precipitation extremes in the PRB (Zhang et al. Citation2009). The ERB is much smaller than the WRB. It is easier to control and prevents flooding water from discharging downstream in the flood peak period by measures such as reservoir operation, floodplains, etc. According to PRWRC (Citation2006), the ERB has been effectively protected from floods by successful flood control facilities and strategies (e.g. the Xinfengjiang Reservoir, Fengshuba Reservoir and Baipenzhu Reservoir completed in 1959, 1973 and 1985, respectively). For the WRB, a much larger basin, flood control is more challenging due to the larger flood peak and more complex river networks. Furthermore, there is still no efficient basin-level flood control facilities for the WRB (PRWRC Citation2006). However, the time-varying assessment indicates that flood peak has become more extreme due to climate change, which is supported by the more intensive precipitation extremes in the WRB detected in previous studies (e.g. Li et al. Citation2013).
4.6 Advantages and limitations of the proposed trend-based time-varying approach
The proposed trend-based time-varying approach is a simulation-based method and can be employed in any basins in which other simulation-based methods can be used, such as the conventional abrupt change-based assessment. The major advantage of the trend-based time-varying approach is that it does not require change point(s) and stationarity assumption (the prerequisites of the abrupt change-based approach). Therefore, the proposed approach also can be applied in basins in which change point detection is insignificant, such as the PRB. In the PRB, an abrupt-change point in wet season precipitation in 1992 is identified, but no change points are found for annual and dry season precipitation and streamflow ( and ). In this case, the 1992 abrupt-change point may not be sufficiently representative of the changes in climate and streamflow. As a matter of fact, most contributions in the abrupt change-based approach are statistically insignificant, which further questions the applicability of the abrupt change-based approach in this basin. In previous studies, the abrupt change-based approach has been widely applied in river basins of northern China, e.g. northwest China (Ma et al. Citation2008) and Tarim River Basin (Hao et al. Citation2008), where decreases in precipitation and streamflow are considerable due to climate change and human activities and hence change points in precipitation and streamflow can be easily identified. However, in the PRB, changes in precipitation and streamflow are insignificant at the annual scale, although they are significant in the wet season. The impacts of human activities (e.g. increased streamflow in the dry season) may offset those of climate change (e.g. reduced streamflow in the dry season), making it more difficult to identify appropriate change points ().
The trend-based time-varying approach evaluates the signals of the impacts in trends over a period, which provides another perspective to detect the signals of climate- and human-induced impacts. On the other hand, the conventional abrupt change-based method assesses changes in the averages after and before a change point. The above comparison of the proposed trend-based time-varying and traditional abrupt-change approaches shows that the two approaches will agree on the signals of impacts, if the signals in climate- and human-induced impacts are strong enough in trends and average changes (e.g. seasonal regulation of the streamflow in the ERB). Therefore, if a signal of impacts can be detected in trends (the trend-based time-varying approach) and changes in averages (the abrupt change-based approach), the signal is more reliable and convincing.
The limitations of the proposed trend-based time-varying approach are similar to the abrupt change-based assessment and other simulation-based methods (Pooralihoosein and Delavar Citation2020). The proposed trend-based time-varying approach is data demanding, as it requires high-quality and long enough streamflow observations, as well as land use/land cover, soil and vegetation data of a basin. Furthermore, the trend-based time-varying approach is more computationally expensive compared to statistical methods, because a hydrological model has to be calibrated, validated and used for simulations in a simulation-based method. The computational cost of the trend-based time-varying approach is comparable to the abrupt change-based assessment. The parameters of the hydrological model may introduce further uncertainties in the results (Pooralihoosein and Delavar Citation2020). The same as other existing assessment methods, the proposed trend-based time-varying approach evaluates climate- and human-induced impacts separately. However, climate- and human-induced impacts can interact and generate combined effects which can play an important role in some basins, in particular, those with high climate variability (Pooralihoosein and Delavar Citation2020). Therefore, future research efforts are needed to overcome these limitations.
5 Conclusions
In this paper, we propose a trend-based time-varying approach to assess the contributions of climate change and human activities to changes in seasonal streamflow and floods in the PRB. The results of the trend-based time-varying approach are compared with the conventional abrupt change-based approach. The VIC model is implemented in the ERB, NRB and WRB to simulate daily streamflow attributed to climate change only. The climate- and human-induced impacts on streamflow and floods estimated by the trend-based time-varying and abrupt change-based assessments are discussed.
The proposed trend-based time-varying approach does not require change point(s) and the stationarity assumption. It can be applied in basins in which the traditional abrupt change-based approach can be used, as well as the basins in which no significant change points can be detected, such as the PRB basin in this study. Since the trend-based time-varying approach identifies signals in trends, it can also be used to confirm the reliability of the signals detected by the traditional abrupt change-based approach which detects the signals in the changes of averages after and before the change point. In the PRB as a case study, the trend-based time-varying and abrupt change-based assessments reach agreement on the signals that are significant in both of the two methods. The signals that the two methods agree on can also be well explained by documented changes in the climate and hydrological properties of the sub-basins (e.g. the strong seasonal regulation in the ERB).
In the PRB, the trend-based time-varying assessment shows human activities play increasingly important roles in the changes in seasonal streamflow. Human activities cause significant seasonal regulation in streamflow in the ERB, i.e. a reduction in the wet season and an increase in the dry season, because the ERB is the most regulated sub-basin in the PRB. The climate-induced impacts on seasonal streamflow changes are insignificant in the three sub-basins.
A significant reduction in flood peaks due to effective flood controls in the ERB is detected in the trend-based time-varying assessment. The abrupt change-based assessment also indicates an insignificant reduction of flood peaks due to human activities in the ERB. The flood peaks in the ERB are expected to change insignificantly if they are affected by climate change alone. In the WRB, a large basin with less main-stem level flood controls, climate change significantly contributes to increases in flood peaks, while human-induced impacts are insignificant.
Acknowledgements
Detailed information of the data can be obtained by contacting to the corresponding author at [email protected].
Disclosure statement
No potential conflict of interest was reported by the authors.
Additional information
Funding
References
- Balsamo, G., et al., 2011. A revised land hydrology in the ECMWF model: a step towards daily water flux prediction in a fully-closed water cycle. Hydrological Processes, 25 (7), 1046–1054. doi:10.1002/hyp.7808
- Bao, Z., et al., 2012. Attribution for decreasing streamflow of the Haihe River Basin, northern China: climate variability or human activities? Journal of Hydrology, 460–461, 117–129. doi:10.1016/j.jhydrol.2012.06.054
- Batjes, N.H., 1995. A homogenized soil data file for global environmental research: A subset of FAO, ISRIC and NCRS profiles. International Soil Reference and Information Centre (ISRIC). Tech. Rep. 95/10, 50.
- Chen, Y.D., 2001. Sustainable development and management of water resources for urban water supply in Hong Kong. Water International, 26 (1), 119–128. doi:10.1080/02508060108686891
- Cherkauer, K.A. and Lettenmaier, D.P., 2003. Simulation of spatial variability in snow and frozen soil. Journal of Geophysical Research: Atmospheres, 108 (D22). doi:10.1029/2003JD003575
- Chow, V.-T., Maidment, D.R., and Mays, L.W., 1988. Applied hydrology. New York: McGraw-Hill, 572.
- Dey, P. and Mishra, A., 2017. Separating the impacts of climate change and human activities on streamflow: A review of methodologies and critical assumptions. Journal of Hydrology, 548, 278–290. doi:10.1016/j.jhydrol.2017.03.014
- Douglas, E.M., Vogel, R.M., and Kroll, C.N., 2000. Trends in floods and low flows in the United States: impact of spatial correlation. Journal of Hydrology, 240 (1–2), 90–105. doi:10.1016/S0022-1694(00)00336-X
- Duan, Q., Gupta, V., and Sorooshian, S., 1993. Shuffled complex evolution approach for effective and efficient global minimization. Journal of Optimization Theory and Applications, 76 (3), 501–521. doi:10.1007/BF00939380
- FAO (Food and Agriculture Organization). 1998. Digital soil map of the world and derived soil properties [CD-ROM]. Rome: FAO Land and Water Diversion.
- Gao, H., et al., 2010. Water budget record from Variable Infiltration Capacity (VIC) model. In: Algorithm theoretical basis document for terrestrial water cycle data records.
- Hamed, A.F., and Rao, A.R., 1998. A modified Mann-Kendall trend test for autocorrelated data. Journal of Hydrology, 204, 182–196.
- Hamlet, A.F., and Lettenmaier, D.P., 2007. Effects of 20th century warming and climate variability on flood risk in the western U.S. Water Resources Research, 43. doi:10.1029/2006WR005099
- Hansen, M.C., et al., 2000. Global land cover classification at 1 km spatial resolution using a classification tree approach. Int. J. Remote Sens., 21, 1331–1364.
- Hao, X., et al., 2008. Impacts of climate change and human activities on the surface runoff in the Tarim River Basin over the last fifty years. Water Resources Management, 22 (9), 1159–1171. doi:10.1007/s11269-007-9218-4
- He., Y., et al., 2019. Quantitative contribution of climate change and human activities to runoff changes in the Bahe River watershed of the Qinling Mountains, China. Sustainable Cities and Society, 51, 101729. doi:10.1016/j.scs.2019.101729
- Huang, S., et al., 2016. Spatio-temporal changes and frequency analysis of drought in the Wei River Basin, China. Water Resources Management, 28 (10), 3095–3110. doi:10.1007/s11269-014-0657-4
- IPCC (Intergovernmental Panel on Climate Change), 2013. Climate Change 2013. The physical science basis. Contribution of working group I to the fifth assessment report of the intergovernmental panel on climate change. Geneva, Switzerland: IPCC. Available from: https://www.ipcc.ch/report/ar5/wg1/
- Jiang, C., et al., 2015. Separating the impacts of climate change and human activities on runoff using the Budyko-type equations with time-varying parameters, Journal of Hydrology, 522, 326–338.
- Kalnay, E., et al., 1996. The NCEP/NCAR 40-year reanalysis project. Bulletin of the American Meteorological Society, 77 (3), 437–471. doi:10.1175/1520-0477(1996)077<0437:TNYRP>2.0.CO;2
- Kendall, M.G., 1955. Rank correlation methods. London: Griffin.
- Kendall, M.G., and Gibbons, J.D., 1990. Rank correlation methods. 5th ed. London: Griffin.
- Li, J., et al., 2013. GCMs-based spatiotemporal evolution of climate extremes during the 21st century in China. Journal of Geophysical Research: Atmospheres, 118 (11), 017–11, 035.
- Li, J., et al., 2016. Response of long-term water availability to more extreme climate in the Pearl River Basin, China. International Journal of Climatology. doi:10.1002/joc.4910
- Li, J., Zhang, L., and Lin, M., 1998. Analysis of current water usage in the Pearl River Basin. Pearlwater, 5, 3–5. (In Chinese).
- Li, L.-J., et al., 2007. Assessing the impact of climate variability and human activities on streamflow from the Wuding River basin in China. Hydrological Processes, 21, 3485–3491.
- Liang, X., et al., 1994. A simple hydrologically based model of land surface water and energy fluxes for generation circulation models. Journal of Geophysical Research – Atmospheres, 99 (D7), 14, 415–14, 428. doi:10.1029/94JD00483
- Liu, B., et al., 2017. Impacts of different threshold definition methods on analyzing temporal-spatial features of extreme precipitation in the Pearl River Basin. Stochastic Environmental Research and Risk Assessment, 31, 1241–1251.
- Liu, J., et al., 2019. A new approach to separating the impacts of climate change and multiple human activities on water cycle processes based on a distributed hydrological model. Journal of Hydrology, 578, 124096. doi:10.1016/j.jhydrol.2019.124096
- Lohmann, D., et al., 1998. Regional scale hydrology: I. Formulation of the VIC-2L model coupled to a routing model. Hydrological Sciences Journal, 43 (1), 131–141. doi:10.1080/02626669809492107
- Ma, F., et al., 2014. An estimate of human and natural contributions to flood changes of the Huai River. Global and Planetary Change, 119, 39–50. doi:10.1016/j.gloplacha.2014.05.003
- Ma, Z., et al., 2008. Analysis of impacts of climate variability and human activity on streamflow for a river basin in arid region of northwest China. Journal of Hydrology, 352 (3–4), 239–249. doi:10.1016/j.jhydrol.2007.12.022
- Mann, H.B., 1945. Nonparametric tests against trend. Econometrica, 13 (3), 245–259. doi:10.2307/1907187
- McMahon, T.A., Peel, M.C., Pegram, G.G., and Smith, I.N., 2011. A simple methodology for estimating mean and variability of annual runoff and reservoir yield under present and future climates. Journal of Hydrometeorology, 12(1), 135–146. doi:10.1175/2010JHM1288.1
- Nijssen, B.N., et al., 2001. Predicting the discharge of global rivers. Journal of Climate, 14 (15), 3307–3323. doi:10.1175/1520-0442(2001)014<3307:PTDOGR>2.0.CO;2
- Niu, J., et al., 2017. Multi-scale streamflow variability responses to precipitation over the headwater catchments in southern China. Journal of Hydrology, 551, 14–28. doi:10.1016/j.jhydrol.2017.05.052
- Niu, J., Chen, J., and Sun, L., 2015. Exploration of drought evolution using numerical simulations over the Xijiang (West River) basin in South China. Journal of Hydrology, 526, 68–77. doi:10.1016/j.jhydrol.2014.11.029
- Ouyang, T., Zhu, Z., and Kuang, Y., 2006. Assessing impact of urbanization on river water quality in the Pearl River Delta Economic Zone, China. Environmental Monitoring and Assessment, 120 (1–3), 313–325. doi:10.1007/s10661-005-9064-x
- Park, D. and Markus, M., 2014. Analysis of a changing hydrologic flood regime using the Variable Infiltration Capacity model. Journal of Hydrology, 515, 267–280. doi:10.1016/j.jhydrol.2014.05.004
- Patrick, D.B. and Shlomo, S.S., 1999. Increasing physicians’ awareness of the impact of statistics on research outcomes: comparative power of the t-test and Wilcoxon Rank-Sum test in small samples applied research. Journal of Clinical Epidemiology, 52 (3), 229–235. doi:10.1016/S0895-4356(98)00168-1
- Pearl River Water Resources Commission (PRWRC), 2006. Flood prevention planning for the Pearl River basin. (In Chinese).
- Pirnia, A., et al., 2019. Contribution of climatic variability and human activities to stream flow changes in the Haraz River basin, northern Iran. Journal of Hydro-environment Research, 25, 12–24. doi:10.1016/j.jher.2019.05.001
- Pooralihoosein, S. and Delavar, M., 2020. A multi-model ensemble approach for the assessment of climatic and anthropogenic impacts on river flow change. Hydrological Sciences Journal, 65 (1), 71–86. doi:10.1080/02626667.2019.1682148
- Schaefli, B. and Gupta, H.V., 2007. Do Nash values have value? Hydrological Processes, 21 (15), 2075–2080. doi:10.1002/hyp.6825
- Shi, X., Wood, A.W., and Lettenmaier, D.P., 2008. How essential is hydrologic model calibration to seasonal streamflow forecasting? J. Hydrometeorol., 9, 1350–1363.
- Sterling, S.M., Ducharne, A., and Polcher, J., 2012. The impact of global land-cover change on the terrestrial water cycle. Nature Climate Change, 3 (4), 385–390. doi:10.1038/nclimate1690
- Tan, X. and Gan, T.Y., 2015. Contribution of human and climate change impacts to changes in streamflow of Canada. Scientific Reports. doi:10.1038/srep17767
- Viney, N.R., et al., 2009. The usefulness of bias constraints in model calibration for regionalisation to ungauged catchments. In: Proceeding of 18th world IMACS Congress/MODSIM09 international congress on modelling and simulation. Cairns, Australia, 3421–3427.
- Wang, S., et al., 2013a. Isolating the impacts of climate change and land use change on decadal streamflow variation: assessing three complementary approaches. Journal of Hydrology, 507, 63–74. doi:10.1016/j.jhydrol.2013.10.018
- Wang, X., et al., 2013b. A numeric study of regional climate change induced by urban expansion in the Pearl River Delta, China. Journal of Applied Meteorology and Climatology, 53 (2), 346–362. doi:10.1175/JAMC-D-13-054.1
- Wang, X., He, K., and Dong, Z., 2019. Effects of climate change and human activities on runoff in the Beichuan River Basin in the northeastern Tibetan Plateau, China. Catena, 176, 81–93. doi:10.1016/j.catena.2019.01.001
- Xie, Z., et al., 2007. Regional parameter estimation of the VIC land surface model: Methodology and application to river basins in China. J. Hydrometeorol., 9, 1350–1363.
- Xu, X., et al., 2013. Assessing the impacts of climate variability and human activities on annual runoff in the Luan River basin, China. Hydrology Research, 44 (5), 940–952. doi:10.2166/nh.2013.144
- Yao, Z., 2004. Analysis of recent variation of water resources and water consumption in the Pearl River Basin. Hydrology, 24 (5), 20–23. (In Chinese).
- Ye, X., et al., 2013. Distinguishing the relative impacts of climate change and human activities on variation of streamflow in the Poyang Lake catchment, China. Journal of Hydrology, 494, 83–95. doi:10.1016/j.jhydrol.2013.04.036
- Zeng, C. and Liu, X., 2014. Present situation and analysis on the cascade reservoirs of Dongjiang River Basin. Guangdong Water Resources and Hydropower, 5, 30–33. (In Chinese).
- Zhang, L., et al., 2011. Estimating effects of plantation expansion and climate variability on streamflow for catchments in Australia. Water Resources Research, 47 (12), W12539. doi:10.1029/2011WR010711
- Zhang, Q., et al., 2009. Trends and abrupt changes of precipitation maxima in the Pearl River basin, China. Atmospheric Science Letters, 10, 132–144.
- Zhang, Q., et al., 2014. Trend, periodicity and abrupt change in streamflow of the East River, the Pearl River basin. Hydrological Processes, 28 (2), 305–314. doi:10.1002/hyp.9576
- Zhang, Q., et al., 2015. Evaluation of ecological instream flow using multiple ecological indicators with consideration of hydrological alterations. Journal of Hydrology, 529 (3), 711–722. doi:10.1016/j.jhydrol.2015.08.066
- Zhang, Q., Singh, V.P., and Li, J., 2013. Eco-hydrological requirements in arid and semiarid regions: case Study of the Yellow River in China. Journal of Hydrologic Engineering, 18 (6), 689–697. doi:10.1061/(ASCE)HE.1943-5584.0000653
- Zhang, S. and Lu, X.X., 2009. Hydrological responses to precipitation variation and diverse human activities in a mountainous tributary of the lower Xijiang, China. Catena, 77 (2), 130–142. doi:10.1016/j.catena.2008.09.001
- Zhao, F., et al., 2012. Application of a macroscale hydrologic model to estimate streamflow across Southeast Australia. Journal of Hydrometeorology, 13 (4), 1233–1250. doi:10.1175/JHM-D-11-0114.1
- Zhao Y. 2012. Surface precipitation dataset for China in the 0.50×0.50 resolution (V2.0). Beijing, China: National Meteorological Information Center.