
 ?Mathematical formulae have been encoded as MathML and are displayed in this HTML version using MathJax in order to improve their display. Uncheck the box to turn MathJax off. This feature requires Javascript. Click on a formula to zoom.
ABSTRACT
The endorheic basin of Zayandehrud in Iran suffers from environmental problems, social tensions, and economic instability. Lack of understanding how the water system and the socio-economic system interact may explain these challenges. A system dynamics model, being a holistic simulation tool, was developed for the Zayandehrud basin and used to evaluate several policy scenarios. The indices of employment, gross regional product, the volume of groundwater and surface water stored, flow into the basin’s end lake, and the water flow in the river were used to evaluate the scenarios. The findings demonstrate that focusing on supply-based activities or water demand management cannot solely improve the condition of the Zayandehrud basin. It is required to reconsider the development policies of the region in a broader context. Reducing the irrigated area by 15% and developing new industries up to a certain limit may make the combined water and socio-economic system sustainable.
Editor S. Archfield Associate editor S. Pande
1 Introduction
Water management is not an easy task owing to numerous consumers, diversity of consumption, the conflict between stakeholders, and water scarcity, specifically in large-scale systems (Sandoval-Solis and McKinney Citation2014). Moreover, there is an interaction between the water resources system and the socio-economic system, which makes water management more complex (Sivapalan et al. Citation2012, Montanari Citation2015, Ogilvie et al. Citation2019). The interaction between these two systems is reciprocal. On the one hand, the decisions made by managers of water resources could produce both welfare or difficulty for society and even lead the society towards social tensions and movements (Walker et al. Citation2015). On the other hand, economic and social policies influence water consumption (Grigg Citation2016). The lack of heed to these complexities and the interaction between the water resources system and socio-economic systems could result in the failure of water management (Walters and Javernick-will Citation2015).
Therefore, successful water management needs both understanding the interactions between socio-economic and water resources systems and taking account of this interaction in decision-making. To understand this interaction, it is essential to utilize holistic and integrated models that cover both systems and the connections between them (Mirchi et al. Citation2012). Since the processes of water resources systems are not linear, and there are intensifying feedbacks, these models should consider the dynamics mode of the systems (Madani and Mariño Citation2009, Mirchi et al. Citation2012). System dynamics is one of the modelling tools that can present a holistic and dynamic comprehension of the system and consider the interaction between systems (Winz et al. Citation2008, Mirchi et al. Citation2012, Kotir et al. Citation2017, Zomorodian et al. Citation2018). System dynamics models aid to perceive cause and effect relationships between different factors of system and feedbacks and subsequently understand what had been the stimulus of the outputs (Walters and Javernick-will Citation2015). In recent years, system dynamics models have been used for water resources modelling in various subjects. For example, participatory water resources modelling (Butler and Adamowski Citation2015, Kotir et al. Citation2017), global water resources and climate change (Davies and Simonovic Citation2011), the interaction between human settlement and flooding (Di Baldassarre et al. Citation2013), socio-economic sensitivity and collective response to hydrology system (Elshafei et al. Citation2014), the interaction between the water resource and the agricultural production sector (Kotir et al. Citation2016), and integrated assessment of water security system (Su et al. Citation2019).
In order to take account of the interaction between the water system and the socio-economic system in decisions, a system dynamics model can be developed as a predictive tool so that it can be utilized for evaluating scenarios. The evaluation of scenarios assists the decision-makers to recognize the effects of different decisions and policies on a system (Safavi et al. Citation2016). However, the criteria for the evaluation of scenarios should be determined before evaluating them.
The criteria, which have been used for evaluating policy scenarios of water resources management in previous studies, are diverse. Kotir et al. (Citation2016) have used the amount of water consumption in agricultural, industrial, and domestic sectors, population, net income of agriculture sector, and the amount of agricultural production for the evaluation of scenarios. Chao et al. (Citation2017) used the variables of water demand, agricultural water demand, water shortage, the ratio of surface water to groundwater resources for choosing the scenarios. Bastan et al. (Citation2018) assessed the scenarios by surveying the variables of water storage changes, areas of agricultural land, and areas of changed land-use. Su et al. (Citation2019) chose factors of the gap between water resources and consumption, water security, amount of sewage, water contamination, water damage, population, and gross domestic product (GDP) as criteria for evaluation of scenarios.
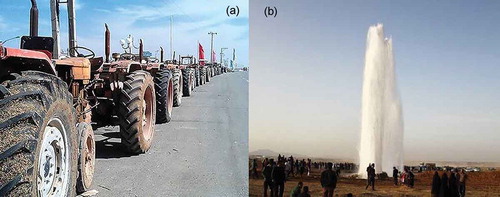
The Zayandehrud River basin is one of the most important basins of Iran which has faced several troubles in recent decades. The basin intensively suffers from a lack of equivalence between resources and consumption, which means “the basin is closing” (Molle and Mamanpoush Citation2012). Social tensions and protests have proliferated about the water (Safavi and Enteshari Citation2016), and the costs of the water management system are not met due to inappropriate pricing of water. In other words, the water resources management in this basin is environmentally, socially, and economically unsustainable. The lack of proper attention to the interactions between the water system and the socio-economic system is one of the most significant causes of this unsustainability. On the one side, the policies of industrial and agricultural growth have augmented the water demands. On the other side, the water allocation without considering its impacts on society has created difficulties for employment and livelihoods of a part of society. In some areas of the basin where the livelihood and employment of individuals (mostly farmers) have altered owing to water allocation, social tensions and protests have risen to the extent that the water system facilities have been damaged (). However, most of the studies on the Zayandehrud basin have focused on water resources and consumption (e.g. Safavi et al. Citation2015, Citation2016, Ahmadi et al. Citation2019), and they have less dealt with community issues related to water resources. Although employment and livelihood have been the most significant keywords of farmers in social protests, none of the studies on the Zayandehrud basin has examined the employment component. However, this issue has been addressed in other basins (Roobavannan et al. Citation2017a, Citation2017b).
Figure 1. Social tensions over water: (a) farmers in the eastern stretches of the watershed holding a tractor lining protest to defy their reduced water allocation; and (b) water transfer pipeline broken by farmers (Safavi and Enteshari Citation2016).
The present study attempts to create a holistic model of the water resources system of the Zayandehrud basin using system dynamics to simulate the interactions between the socio-economic and water systems. These interactions are around the growth of industry and agriculture, employment, gross regional domestic product (GRP), population, water uses, and water resources. The simulated model is then used to evaluate several policy scenarios. In order to evaluate scenarios, several indices have been used, which cover social, economic, and environmental aspects. The main take-home message of this study is broadening our perspectives beyond managing the water supply and demand and to also consider socio-economic development trajectories.
A description of the study area is given in Section 2. Section 3 discusses the model development process including evaluation criteria, calibration process and designing policy scenarios. The results under different policy options for improving sustainability criteria in the basin and conclusions are given in Sections 4 and 5.
2 Case study: Zayandehrud River basin
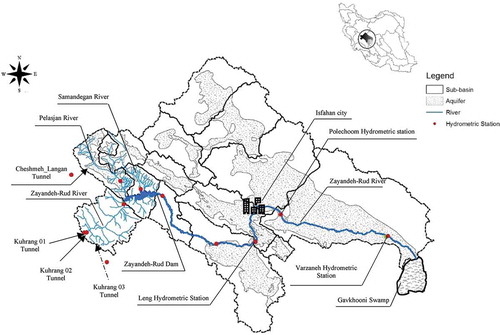
The Zayandehrud River basin is located in the central part of Iran, covering 27 000 km2 of land. Zayandehrud is a 350-km endorheic river that originates from mountainous areas in the west of the basin and flows into Gavkhuni Wetland in the east of basin after passing through several cities and villages. The most important surface water resources of the basin are three rivers Pelasjan, Zayandehrud, and Samandegan in the upper side of this basin, and inter-basin water transfer tunnels, which all flow into Zayandehrud Reservoir. Moreover, this basin consists of 16 sub-basins, 13 of which have aquifer and groundwater resources (Safavi et al. Citation2015). An overall view of the location of the Zayandehrud basin in Iran and its sub-basins, as well as the locations of the river, Zayandehrud Dam, aquifers, and hydrometric stations, is presented in .
Figure 2. The Zayandehrud River basin and its surface and groundwater resources (Safavi et al. Citation2015).
In the Zayandehrud basin, industry and agriculture play an important social and economic role. Owing to the diversity of climatic conditions in this basin, more than 50 different crops are planted; the most important annual crops are wheat, barley, alfalfa, potato, onion, maize, and rice, and the most important perennial crops are almond, grape, pomegranate, walnut, and peach. The potential agricultural land of the basin is about 400 000 hectares, 50 000 hectares of which are rain-fed (Isfahan Agricultural Jihad Organization Citation2017). The Zayandehrud basin, as the second industrial basin of Iran, has about 13 000 industrial units. The largest industries of this basin regarding water consumption are steel and iron industries, power plant, refinery, and petrochemical respectively (Horlemann and Mohajeri Citation2017). In addition to water uses within the basin, on average 80 million m3/year is transferred to the cities of Kashan, Yazd and Shahrekord in the adjacent basins.
Data of water resources in this basin from 1991 to 2011 demonstrates that average precipitation is 5787 million m3/year, 997 million m3/year of which on average flows into the reservoir of Zayandehrud dam as runoff, and about 933 million m3/year infiltrates and recharges groundwater resources. Moreover, on average, 564 million m3/year enters the basin through three tunnels of Koohrang I, Koohrang II, and Cheshmeh-Langan from adjacent basins (). Overall, the average renewable water resources are 2494 million m3/year, while on average 2765 million m3/year is consumptively used (Safavi et al. Citation2015). The average annual water balance of the Zayandehrud basin water resources is presented in .
Table 1. Average water balance in the Zayandehrud River basin in the period 1991–2011 (106 m3/year).
Several reasons have been cited for the scarcity of water in the Zayandehrud basin such as the growth of population, development of agriculture and industry in upstream and centre of the basin, increase of illegal extractions, and drought. Moreover, climate change impacts have caused annual precipitation and temperature to increase, changing the temporal distribution of precipitation as well as converting part of it from snow to rain (Sarhadi and Soltani Citation2013, Madani et al. Citation2016, Horlemann and Mohajeri Citation2017). Due to water scarcity in these years, fewer water resources have been released towards downstream of the basin, and it has caused the agricultural land on the east side of the basin to be arid and consequently increased unemployment in downstream regions. The growth of unemployment is followed by other forms of social harm like increased crimes and divorces. The lack of water allocation to downstream and unemployment in recent years has caused many social protests in this region (Safavi and Enteshari Citation2016) and expanded slums and cash jobs.
To solve the water scarcity in the Zayandehrud basin, structural solutions, such as the inter-basin transfer water from adjacent basins, have been regarded in recent years. Construction of three inter-basin water transfer tunnels during the recent six decades has compensated the water shortage to some extent. However, it has raised the tensions between inhabitants of the Zayandehrud basin and residents of neighbouring basins (Madani and Mariño Citation2009). Furthermore, inter-basin water transfers have raised dependence on water resources, and the basin has become more vulnerable to drought (Gohari et al. Citation2013a). This effect may be likened to the “reservoir effect” (Di Baldassarre et al. Citation2018). Thus, water transfer cannot be regarded as the main solution. In addition to socio-economic issues, environmental problems are also serious in the Zayandehrud River basin. A sharp drop in groundwater level has occurred due to illegal extractions; lack of contamination control, has declined the quality of water resources. The Zayandehrud River has become intermittent, and a vast part of Gavkhuni Wetland, at the mouth of the Zayandehrud River, has dried out owing to lack of water (Sarhadi and Soltani Citation2013). These socio-economic and environmental crises have arisen from problems of the administrative-institutional system. The related administrative-institutional system of water resources does not have sufficient efficiency due to some reasons such as prioritizing large-scale infrastructures, conflict of interest, lack of transparency and participation (Molle and Mamanpoush Citation2012). The existence of all these complexities in the Zayandehrud basin and the relation between societal issues and the system of water resources call for a holistic understanding of the interactions between these systems and for a holistic model. This research is an effort to model a part of these complexities, so it would be possible to identify more feasible scenarios for the management of this complicated system.
3 Processes of model development
3.1 System dynamics approach
The system dynamics, which is developed based on systemic thinking, is a modelling method of complex systems (Forrester Citation1961). The water resources system is a complex system, that cannot be analysed by a linear and event-based thought (Simonovic Citation2009, Mirchi et al. Citation2012). Hence, the analyses that do not consider the complexities of this system lead to unstable strategies (Mirchi et al. Citation2012). System dynamics assists in recognizing water resources as a system consisting of various sections that have interactions with each other (Simonovic Citation2009). By using system dynamics, instead of considering and modelling the factors separately, the focus would be on relations and processes, and also instead of concentrating on the result of an issue, the behavioural patterns which have produced the issue are considered. Nonetheless, the capability of these models and their success rate depend on the effective identification of main factors and their interrelations (Madani and Mariño Citation2009, Mirchi et al. Citation2012).
The structure of system dynamics consists of some factors and positive and negative relationships between them (Sterman Citation2000). Some of the factors shape a feedback loop, which could be reinforcing or balancing. In order to commence the modelling of system dynamics, a conceptual framework is created first. Then, the stock and flow diagram (SFD) is developed based on the conceptual framework. All factors in SFDs are defined as state variable (an indicator of system status), rate variable (an indicator of the change rate of state variables), and auxiliary variables. The system dynamics model can be used for the evaluation of managerial scenarios after its development and validation.
3.2 Evaluation criteria
In order to obtain sustainability in integrated studies of water resources management, it is emphasized that three categories of economic, social, and environmental criteria must be considered (Rahaman and Varis Citation2005, Giordano and Shah Citation2014, Roozbahani et al. Citation2015). van der Zaag (Citation2005) explicitly presumes that integrated water resources management (IWRM) is the creation of equivalency between social goals, economic development, and environmental conservation. In some other studies, these three aspects are also titled expressions like profit/planet/people or economy/ecology/equity (Guest et al. Citation2010, Tortajada Citation2014, Walters and Javernick-will Citation2015, Chao et al. Citation2017). Hence, there is a general agreement that any decision and any solution for water resources management, should be based on these three categories of criteria. However, it is not easy to determine a criterion for measuring these three categories, and it may vary for each region. The determination of evaluation criteria has its challenges like the definition of criteria, quantification, the compromise between stakeholders, and weighting the criteria (Peña Citation2011, Mooney et al. Citation2012, Walker et al. Citation2015). In this research, based on the interviews with stakeholders, practitioners, and managers, the following criteria are used for the evaluation of scenarios in Zayandehrud basin:
the most significant social factor influenced by water management in the basin is unemployment, which is expressed by the people in protests. Therefore, the employment rate is used as the most important social index.
the GDP is one of the economic indices that is used for measuring the economic activities of a country. The GDP represents the financial value of all provided products and services in a country. The GRP is utilized to measure the value of produced merchandise and services across a region or subdivision (Gohari et al. Citation2013a). In this research, the obtained GRP from industry and agriculture in the Zayandehrud basin is assessed as an economic index.
In recent years, there has been land subsidence in some areas due to the decrease in groundwater level in aquifers of the basin. Moreover, the stability of water consumption, specifically drinking water, is threatened in years when the volume of existing surface water in the Zayandehrud Reservoir falls below 300 million m3. Thus, the volumes of groundwater and surface water are considered the most important criteria of water resources stability and water consumption stability, respectively.
The level of inflow discharge to Gavkhuni Wetland on the east side of the basin has dramatically dropped since 1993, and, in some years, it has reached less than 5 million m3. However, this wetland needs 60, 140, and 175 million m3 of water per year for preserving the life of birds, conserving the life of aquatic species, and maintaining all ecologic functions, respectively (Morid Citation2003, Sarhadi and Soltani Citation2013). The discharge at Varzaneh gauging station () is assumed as the amount of water inflow into this wetland and one of the environmental indices.
Different stretches of the Zayandehrud River need a certain amount of water flow to keep its ecologic functions working. The interval between hydrometric stations of Lenj and Pole-Choom () is one of the most important stretches of the river where it passes through the most significant city of the basin (historical district of Isfahan). Therefore, Lenj hydrometric station is used as an environmental index in which its required environmental discharge to keep the ecologic function of the river is about 315 million m3/year (Isfahan University of Technology and Shahrekord University Citation2018).
3.3 Model development
For a better understanding of the Zayandehrud basin and designing a conceptual model, interviews were conducted with 43 experts from governmental, civic, and academic organizations. The result of this step was a causal loop diagram, of which a part is shown in . To illustrate the interactions and feedbacks between the socio-economic and the water system, only a part of the components are shown in this figure. Water resource storage is at the core of this causal loop diagram. Growth in agriculture, industry, and population increases water withdrawal and reduces water resource storage. Growth of industry and agriculture also increases GRP and employment, leading to an increase of the population through immigration. Water resources reduction provides some feedbacks on the socio-economic system. These feedbacks are considered in the form of scenarios. Feedbacks increase the water resource storage in negative loops and decrease the water resource storage in positive loops. One other interaction is that increasing precipitation and inter-basin water transfer will increase water resources directly and on the other hand decrease water resources by increasing cultivation and immigration. SFDs were created after the development of the conceptual model. The developed system dynamics comprises four subsystems which are: population and drinking water subsystem, agricultural subsystem, industrial subsystem, and water resources subsystem. The water resources subsystem is the most important part of the model because of linking all resources and consumptions. Unemployment and GRP are calculated in agricultural and industrial subsystems. Some of these subsystems are designed with multi-layers, meaning each variable is divided into several sections. Most of the links between components in the system dynamics are simulated based on the experimental formulas. In some cases, links between two components have been simulated based on regression analyses in which plausible causal relationships have been identified between components. The coefficient of determination (R2) was greater than 0.7 in these cases (). The territorial boundaries of the model are based on the boundaries of the basin and the time horizon of the model is defined for a 35-year period (1991–2025) with a yearly time step.
Figure 3. Causal loop diagram of interactions between socio-economic and water system in Zayandehrud basin; Thick arrows are considered in the form of scenarios.
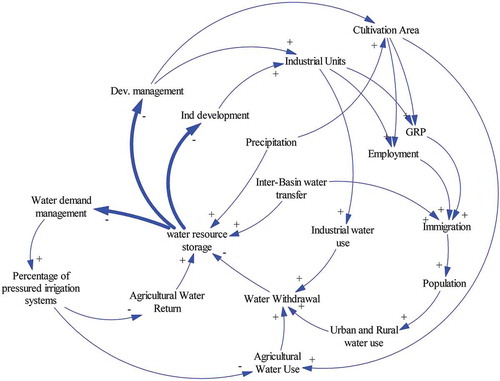
Figure 4. Analysis of regressions that used to simulate the relationships between some components in the system dynamics model: (a) cultivation area for rainfed crops; (b) cultivation area for irrigated crops; (c) evaporation; (d) percolation; and (e) runoff.
3.3.1 Population and drinking water subsystem
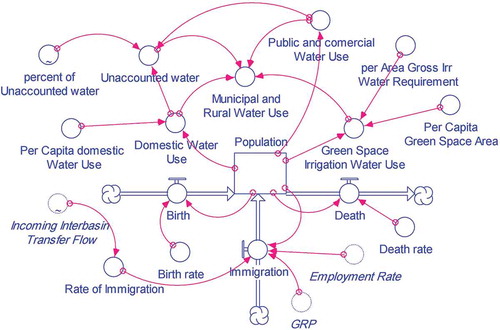
The consumption of water for drinking and hygiene purposes is simulated in this subsystem (). The population-related data (Statistical Center of Iran Citation2018a), water consumption data (Isfahan RWW. Co. Citation2017, Isfahan WW. Co. Citation2017) and green space data (Zayandab Consulting Co. Citation2009) were used to find the relationships between variables and calibration of the model. The population is regarded as a state variable, which changes by birth, mortality, and immigration. The immigration is also affected by water inflow to the basin, employment rate, and GRP. The factors of domestic water consumption per capita, public and commercial water consumption per capita, birth rate, mortality rate, and irrigation need for green areas per square meter have a constant value throughout a particular period while other factors change over time.
Figure 5. Stock and flow diagram (SFD) of population and drinking water subsystem.
3.3.2 Industry subsystem
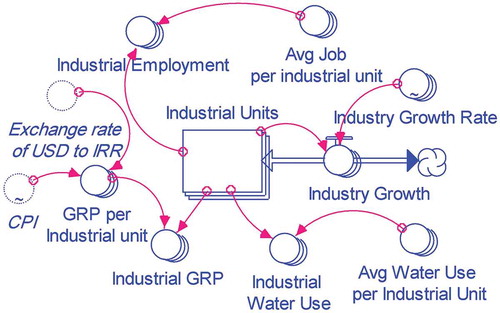
The data of industries (Isfahan Agricultural Jihad Organization Citation2017, Isfahan Industry and Trade Organisation Citation2018), water consumption of industries (Statistical Center of Iran Citation2004, Zayandab Consulting Co. Citation2009, Horlemann and Mohajeri Citation2017), the number of created jobs in industries on a yearly base (Statistical Center of Iran Citation2018b), and GRP resulted from the industries on the seasonal base (Statistical Center of Iran Citation2016) were used to simulate industry subsystem (). The subsystem includes three layers. Large industries, small and medium-size industries, and agricultural industries are modelled in each layer separately. In this research, the large industries mean the ones that demand more than 0.5 million m3 of water per year. At the moment, there are about 30 large industrial units. Aquaculture, livestock, poultry, and greenhouse are the agricultural industries that have been included in the model.
Figure 6. SFD of industry subsystem.
3.3.3 Agriculture subsystem
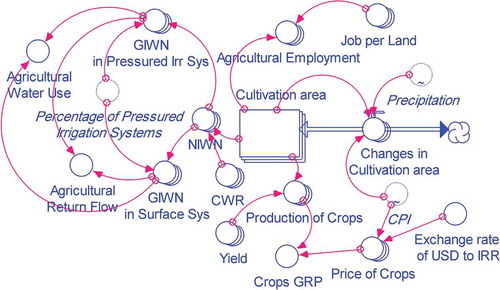
To model the agriculture subsystem, data of crops (Isfahan Agricultural Jihad Organization Citation2017), GRP (Statistical Center of Iran Citation2016), and the created jobs in the agriculture sector (Statistical Center of Iran Citation2018a) were used. The area under cultivation for crops is assumed as a state variable. The amount of crop production, amount of water consumption, GRP, and the created jobs in the agriculture sector are the most significant factors of this subsystem (). The subsystem comprises three layers, in each of which a category of crop is modelled. These categories are rain-fed annual crops, irrigated annual crops, and irrigated perennial crops.
Figure 7. SFD of agriculture subsystem.
The incongruence of hydrologic boundaries and political boundaries is one of the challenges of water resources management. In the Zayandehrud basin, agricultural data are also collected based on political units and are not adapted to hydrological units. It means that Agricultural Jihad Organization gathers and presents the agricultural data including cultivation area and the yield of crops based on counties. In order to convert agricultural data from political-based boundaries to hydrologic-based boundaries, it is possible to obtain some coefficients. For the first time, Sally et al. (Citation2001) provided some coefficient to convert cultivated land based on region unit into irrigation networks unit. Felmeden (Citation2014) updated these coefficients. In those studies, the lands with irrigation networks were solely considered, and other agricultural lands that exist scattered in the area and nourish mostly from groundwater resources were ignored. Furthermore, these studies have only focused on irrigated farming land and neglected rain-fed cultivation. To convert all agricultural data from political-based boundaries to hydrologic-based boundaries, some coefficients were obtained based on land-use maps in this study (see Tables S1–S3 in the Supplementary material).
In the Zayandehrood Basin, farmers decide how much of their lands to cultivate based on the amount of precipitation. Therefore, there is a significant correlation between the area under cultivation of crops per year and the amount of precipitation. Hence, regression was used to simulate the cultivated land of crops () and (b)). In order to calculate the amount of water consumption in agriculture sector, the following equations were used:
in which, GIWN is gross irrigation water need of all agricultural products (m3), Ep is irrigation efficiency (%), NIWN is net irrigation water need of all agricultural products (m3), CWRc is crop water requirement of crop c in cultivation period (mm), Ac is area under cultivation of crop c (ha), and n is the number of crops. The crop water requirement is gained from the following equations (Brouwer and Heibloem Citation1986, Allen et al. Citation1998):
In these equations, ETc is evapotranspiration of crop c during the cultivation period (mm), Pe is the effective precipitation during the cultivation period (mm), ETo is the reference evapotranspiration (mm), and Kc represents the crop coefficient. ETo is calculated based on climatic parameters of the region, and Kc is obtained based on the type of crop. Since this research aims at water management in the scale of the river basin and not based on a farm, it was decided to ignore other effective factors on irrigation water need such as the required water for leaching. The irrigation efficiency can be calculated from the following equation (Brouwer et al. Citation1989):
in which, Ec is conveyance efficiency, Ed is distribution efficiency, and Ea is irrigation application efficiency. The conveyance efficiency is only applied for the use that withdraws water from surface resources. Regarding the fact that the irrigation application efficiency is different in surface irrigation systems and pressurized irrigation systems, GIWN was calculated for surface irrigation systems and pressurized ones separately. Based on previous studies, the irrigation efficiency is estimated as shown in (Ataie Citation1997, Yekom Consulting Engineering Co. Citation2013, Abbasi et al. Citation2017).
Table 2. Water consumption efficiency in different irrigation systems (%).
The number of created jobs in the agriculture sector depends on several factors, including the type of crop and the type of cultivation (rain-fed or irrigated). On average, different types of cultivation activities create 85, 30, and 144 people day jobs per year in one hectare of irrigated annual crops, rain-fed annual crops, and perennial crops, respectively. During the calibration of the model, it was found that 155 days of cultivation activities per year is equivalent to one fulltime job on average.
3.3.4 Water resources subsystem
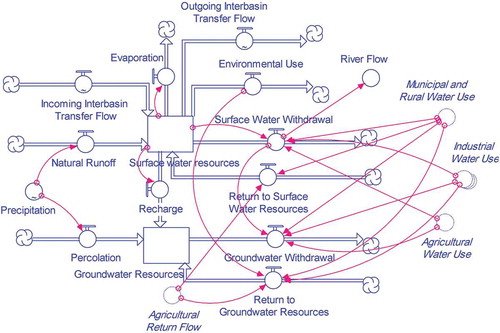
Two resources of surface water and groundwater are assumed as the state variables in the water resources subsystem. The outputs of water resources are outgoing inter-basin transfer flow, evaporation from surface water bodies, and withdraw for drinking, industrial, agricultural, and environmental purposes. The inputs of water resources are runoff, percolation, incoming inter-basin transfer flow and return water flow. The SFD of the water resources subsystem is illustrated in .
Figure 8. SFD of water resources subsystem.
The data from the period 1991–2011, were used to simulate runoff and percolation. For this purpose, the effect of temperature on runoff was omitted, and multiple regression analysis of a series of observed precipitation, simulated percolation (Safavi et al. Citation2015) and observed river discharge data were conducted () and (). The incoming transfer flow, outgoing transfer flow, and the precipitation were entered into the model in time series. To estimate evaporation from the surface water bodies, regression analysis was performed between evaporation and volume of surface water resources ()).
A total of 80% of urban and rural drinking water demands (Isfahan WW. Co. Citation2017), 68% of industrial water demands (Yekom Consulting Engineering Co. Citation2013), and 30% of agricultural water demands are supplied from surface water resources, and the rest are provided from groundwater resources. During the calibration of the model, it was perceived that in years when the available volume of surface water is low, less surface water is allocated to the agriculture sector and the remaining demand for agriculture is provided via groundwater resources based on the following equation:
In which Awu is the agricultural water demands, Awus is the agricultural water demands covered by surface water resources, and SWR is the volume of surface water, all in million m3.
For the simulation of return flow previous studies have been used. About 23% of withdrawal water for drinking use is consumed and the remaining 77% return to water resources of which 37% returns to the sewage treatment system and consequently to surface water resources (Isfahan WW. Co. Citation2017) and about 40% percolates to groundwater resources. Moreover, 56% of industrial withdrawal water returns to groundwater resources and 44% of it is consumed (Yekom Consulting Engineering Co. Citation2013). The return flow of the agricultural sector is calculated based on the efficiency of different irrigation systems in the agriculture subsystem.
3.3.5 Calculation of GRP
In general, GRP for an industrial or agricultural product is calculated as:
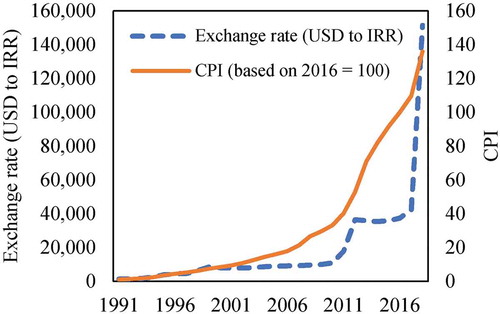
So that Pri is the production of the product i (kg), Pi is the price of the product i (IRR/kg), Er is the exchange rate of US dollar (USD) to Iranian Rial (IRR), and GRPi is the created GRP through product i (USD). Owing to the economic conditions of Iran, the exchange rate of USD to IRR and the price of products has not been stable over time. In order to take into account other economic impacts on the calculation of GRP, the consumer price index (CPI) was utilized.
To demonstrate the impact of inflation, the CPI is one of the most informative indices. This index is measures consumer expenses for purchasing a set of goods and services. If the CPI would be 112 for the current period, then it shows that 12% more should be paid for purchasing the set of goods at the moment compared to the time when the index has been 100. The index of CPI in Iran and the exchange rate of USD to IRR are illustrated in . As it is shown, the exchange rate of USD and CPI did not grow synchronously. Therefore, there would be many errors if this issue is not considered.
Figure 9. Exchange rate of USD and IRR, and Consumer Price Index (CPI) in Iran.
3.4 Calibration and validation
In the first step of calibration, variables with deterministic and linear relationships were calibrated without considering dynamic feedbacks within the system. In this step, agricultural, industrial and urban subsystems were calibrated separately and the variables connected to other subsystems considered constant. For instance, employment is a variable affected by the industry and agriculture subsystems and affects the population. Thus, to calibrate the population and drinking water subsystem, employment was entered in the model as a series of observed data and other variables of drinking water subsystem were calibrated. In the next step, the water resources subsystem and all other feedback loops were calibrated. In this step, the variables within the feedback loops were examined one by one and the mathematical relationships were replaced by observed data to reproduce historical trends. In the calibration process, relationships between variables were obtained through empirical equations or regression from observational data.
The level of accuracy certainty depends on the intended view and goals of the model-maker (Gohari et al. Citation2013b). For assurance about the accuracy of the model, parameter-confirmation test, dimensional consistency, and behavioural pattern test, introduced by Sterman (Citation2000), were utilized. In the behavioural pattern test, the factors of groundwater resources, surface water resources, river water flow, population, employment and GRP in agriculture and industry sectors for the period 1990–2016 were used. The coefficient of determination of these factors was greater than 0.6, a value that was considered acceptable by e.g. Roobavannan et al. (Citation2017a).
3.5 Designing policy scenarios
As Gohari et al. (Citation2013b) and Kotir et al. (Citation2016) have shown, the design of scenarios is performed based on trial and error, and assumptions that are available for the efficiency of policies. However, proper professional judgment might reduce the number of tentative scenarios. Regarding the situation of the Zayandehrud basin and informed by qualitative interviews conducted with stakeholders and experts, four scenarios were designed and implemented for the period 2016–2025 in this research.
A survey of climate change was carried out on the Zayandehrud basin based on the fifth report of the Intergovernmental Panel on Climate Change (IPCC Citation2015) to simulate the precipitation in the future (Sangestani Citation2019). To consider the impacts of climate change, the amount of precipitation in all scenarios was entered into the system dynamics model based on findings of the climate change scenario of representative concentration pathway RCP2.6. Each scenario is described below.
Scenario 1: Business-as-usual. This scenario is designed as a reference for comparing other scenarios. In this scenario, population, and consequently urban and rural water consumption, increase according to the existence trends. Furthermore, CPI and exchange rate with a fixed increase rate and the percentage of non-revenue water with a fixed decrease rate were entered in the model. Other factors of the system including birth rate, mortality rate, domestic, commercial and public water consumption per capita, green areas per capita, industrial water consumption per capita, irrigation efficiency, crop yield, incoming transferred flow, and outgoing transfer flow have been deemed invariant as before for future years.
Scenario 2: Water demand management. According to the survey of Rastghalam (Citation2013), it is possible to decrease non-revenue water up to 35%, per capita domestic and commercial water consumption up to 11%, and per capita water consumption in large scale industries up to 10% by conducting technical, cultural, educational, economic, and legal activities. Besides the reduction of drinking and industrial water consumption, it is assumed in this scenario that all agricultural lands of the basin are equipped with pressurized irrigation systems. Other factors of this scenario are similar to those of Scenario 1 (business-as-usual).
Scenario 3: Industry development. Right now, there are many requests for industry development in the Zayandehrud basin. In the case of industrial development based on those requests, five large industries (Zayandab Consulting Co. Citation2009), about 800 small and medium-sized industries, and 1200 agricultural industries will be created on average each year till the year 2025 (Horlemann and Mohajeri Citation2017). Other factors of this scenario are similar to those of Scenario 1.
Scenario 4: Development management. The scenario of development management was designed as a mediating policy after analysing the process and industrial development scenarios. In this scenario, it is assumed that the area under cultivation of irrigated lands reduces by 15%, and only 30% of new industries that have requested a license, start to operate.
4 Results
4.1 Model validation
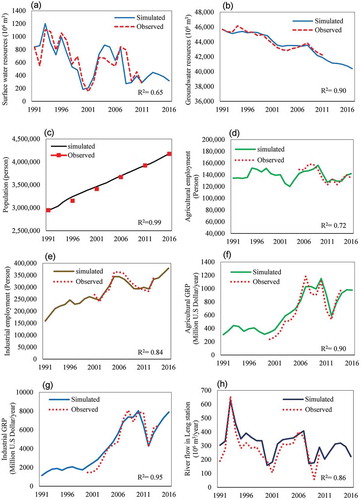
The results of testing the model for observed data and simulated data for the period 1991–2016 are presented in . There is a delay between observed and simulated data in some cases. Nevertheless, almost everywhere the data have similar behaviours, and the model is well-calibrated for the anticipation of the behaviour of various factors. Even though data of water resources, industries, agriculture, GRP, and employment were collected from independent sources, the model could properly simulate the relationship between these variables.
Figure 10. Comparison between observed data and simulation results for main components for 1991–2016: (a) surface water resources; (b) groundwater resources; (c) population; (d) agricultural employment; (e) industrial employment; (f) agricultural gross regional product (GRP); (g) industrial GRP; (h) river flow at Lenj station.
4.2 Analysis of scenarios
To analyse the results of scenarios, social, economic, and environmental sustainability of the basin are assessed through the observation of determined indices. The results of all simulated scenarios are illustrated in .
Figure 11. Behaviour of main model variables under four scenarios for 2016–2025: (a, b) baseline scenario; (c, d) water demand management scenario; (e, f) industrial development scenario; and (g, h) development management scenario.
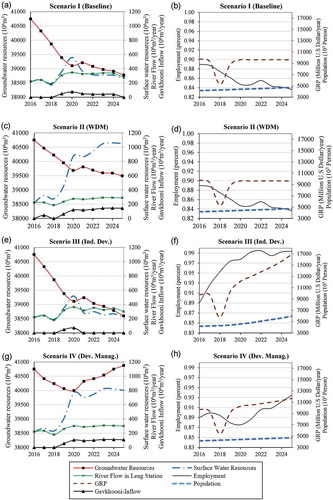
The year 2019 was relatively wet, which caused an increase in the volume of surface water at the beginning of the year 2020 and the volume of groundwater at the beginning of the year 2021 in Scenario 1 (business-as-usual). In other years, the volume of groundwater continuously declined, and the volume of surface water storage fluctuates around the critical limit (300 million m3). Water resources and their consumption are not stable in this scenario. According to this scenario, the minimum environmental requirement was provided for conservation of bird life in Gavkhuni Wetland only in 2020; while in other years even the minimum water requirement of the wetland was not met. Nonetheless, the required minimum river flow for preserving its ecologic functions was supplied in the area of Isfahan (Lenj station) in most of the years.
The population of the basin reaches about 4.7 million in 2025 in this scenario. On the one side, the growth of the population and on the other side the lack of industrial development causes the employment to decline from 0.89 to about 0.84%. This can increase social tensions and augment the problems of society. Due to the sudden growth of the exchange rate of USD to IRR in 2018, the GRP had a dramatic downfall. However, it has gradually returned to a normal situation. In general, it can be said that environmental sustainability has not been completely secured, the social situation deteriorates, and the economic index of the basin did not change in this scenario.
In Scenario 2 (water demand management), socio-economic factors do not differ from the ones in Scenario 1 and the minimum environmental requirement was provided for conservation of bird life in Gavkhuni in most of the years. In contrast, the water need of the river could not be fully satisfied owing to the reduction of water consumption and consequently less release of water from the dam. Whereas the level of surface water resources increased, the instability of groundwater resources is still apparent. Overall, in this scenario, the socio-economic condition did not change compared to the business-as-usual scenario, the sustainability of water resources and consumption slightly improved, while environmental sustainability was not fully achieved.
In Scenario 3 (development of industry), the quantity of GRP nearly doubled in value, and the employment rate reached about 99%, which caused an increase in migration to the basin. Consequently, the population reached six million in 2025. Whereas the growth of GRP and employment is a sign of improvement in residents’ welfare, population growth might produce undesirable effects on other aspects of residents’ life. For instance, it could increase the number of people living in slums. Thus, it cannot be asserted that socio-economic sustainability was obtained in this scenario. The most considerable reduction of water resources occurred in this scenario and Gavkhuni Wetland received water only in wet years. In other words, the sustainability of water resources and consumption and environmental indices intensively deteriorated in this scenario.
In Scenario 4 (development management), a 15% decrease in the irrigated area compared to Scenario 1 had a tremendous impact on water resources and stabilized these resources. On the other hand, 30% of industrial development improved employment up to 94%. Industrial development was not enough to increase the population of the basin. However, the minimum water requirement of the wetland for keeping birds’ life was provided. It can be observed that the environmental, social and economic indices significantly improved.
Through the comparison of scenarios, it is apparent that surface water resources in Scenario 2 and groundwater resources in Scenario 4 improved the most. Its reason could be that the industry and drinking water sectors depend on surface water and major agricultural lands depend on groundwater resources. Moreover, the leverage point for creating jobs and an increase in GRP is the development of the industry, whereas the leverage point for reduction of pressure on water resources is a decrease of irrigated agriculture. The identification of these leverage points assists managers in achieving their intended goals with the least changes. In none of the scenarios, the minimum environmental need for preserving all ecologic functions was met for the Gavkhuni Wetland, because it is located at the end of the river, and in the existing decision-making mechanism is the last receiver of water. To supply the needs of this wetland, the rules governing the management system must be modified, whereby the environment obtains a more prominent place in decision making. The amount of water extracted in the year 2025 is presented in for each of the four scenarios. Since the average of renewable water resources is about 2500 million m3/year in the Zayandehrud basin and the net extraction of water is less than this amount in Scenario 4, this scenario can lead to the sustainability of water resources.
Table 3. Water withdrawal and consumption in 2025 (106 m3/year).
4.3 Discussion
To create a balance between water resources and consumption in the Zayandehrud basin, it has been proposed that water demand management coincides with inter-basin water transfer (Safavi et al. Citation2016). However, the water transfer policy has many environmental and social challenges, of which the most common challenge is population growth. This interaction between the socio-economic system and the hydrology system was discovered in many prior socio-hydrology studies around the world (Di Baldassarre et al. Citation2018, Li et al. Citation2019). In contrast, it has been proven that reducing water allocation could cause emigration and population decline (Roobavannan et al. Citation2017a). The impact of inter-basin water transfer on the socio-economic system has also been reported in the Zayandehrud basin (Madani and Mariño Citation2009, Gohari et al. Citation2013a), but the level of influence had not yet been assessed. In this research, it was found that most immigrants to the Zayandehrud basin came from two provinces, Chahar-Mahal & Bakhtiari and Khoozestan, precisely from where the water resources into Zayandehrud basin were transferred. In other words, it can be claimed that population flows go along with the water flows. The rate of population growth in the Zayandehrud basin is about 1% per year, of which 20% could be attributed to the immigration caused by the inter-basin water transfer into the basin. This lesson, learned from socio-hydrologic studies, contains a warning that has been repeated frequently: remedial efforts to address water scarcity with a heavy focus on infrastructure solutions, may exacerbate the problem through unintended consequences that arise from neglect of social, economic, and environmental factors (Gohari et al. Citation2013a, Di Baldassarre et al. Citation2018, Li et al. Citation2019).
Instead of infrastructure solutions, socio-hydrological studies help to identify solutions from recognizing the relationships between the water system and the socio-economic system. In this regard, socio-economic components such as industry, agriculture, environment, employment, GDP, population, migration, settlement, social sensitivity, and awareness have been considered in socio-hydrologic studies (Di Baldassarre et al. Citation2013, Elshafei et al. Citation2014, Roobavannan et al. Citation2017a, Citation2017b, Li et al. Citation2019). The solutions obtained in this way change the lever points of the system generally towards soft interventions, for instance, diversifying the economy (Roobavannan et al. Citation2017b, Citation2020), designing the location of the settlement away from the river (Di Baldassarre et al. Citation2013), limiting population expansion along with improving water use efficiency (Li et al. Citation2019) and changing the reservoir operation policy (Garcia et al. Citation2016).
Similarly, the core obtained solution in this study is development management. The findings show that it is possible to reduce the cultivated areas of agricultural lands and deal with the development of new industries for increasing the sustainability of water resources and consumptions and improving the social, economic, and environmental situation of the system. In other words, the basin evolves toward industrialization. However, it is clear that the skills, local knowledge, and infrastructure capitals dedicated to agriculture, which have been formed during centuries, should not be neglected. Therefore, the development of agricultural industries (greenhouse, livestock, poultry, and aquaculture) must be prioritized compared to large and medium-sized industries. However, how to reduce agricultural land and its localization requires further studies.
The solutions obtained from socio-economic studies (like reducing agriculture and developing the industry in this study) demonstrate that water resources management is not undertaken only by managers of the water sector, and that managers from other sectors, such as the economy, agriculture, and industry directly influence water management. Managers of the water sector may concentrate on water supply management or water demand management through technical, legal, economic, pricing, and educational activities, while there is a need to review the development policies in a larger context.
The comparison of scenarios shows that choosing appropriate criteria strongly influences decisions. Although all three social, economic, and environmental aspects were covered here, there are still other criteria that are significant in the Zayandehrud basin and must be considered in future research; think of, for instance, public health, desertification, social justice, species diversity, and water quality.
5 Conclusion
Recognising the complexities of water resources systems and their dynamic interaction with the socio-economic system, decisions of water resources management must be made based on a holistic approach. Simultaneous attention to environmental, social, and economic aspects is essential, specifically if the aim is to achieve sustainable development. In this research, a system dynamics model was developed in which the main factors and their interaction in the Zayandehrud basin were simulated. The system dynamics in this study was utilized as a learning tool for increasing our understanding of the behaviour of the system and also as a tool for the evaluation of policy scenarios. The model was examined by behavioural patterns and structural tests. To evaluate policy scenarios, the indices of the volume of groundwater, surface water storage, water flow to Gavkhuni Wetland, and river water flow were used as the environmental criteria, and indices of employment and GRP served as the socio-economic criteria.
In addition to the business-as-usual scenario, three scenarios of water demand management, development of industry, and development management were developed and assessed. The findings show that applying solely the activities related to water demand management cannot achieve sustainability of the water resources system of this basin. On the other hand, the transfer of water into the basin has serious challenges based on previous studies. Hence, it is necessary to revise development policies in this basin where the new industries, specifically agricultural industries would be substituted for some parts of agricultural lands of the basin. By applying development management, not only the socio-economic indices but also sustainability of water resources and their consumption would improve.
Supplemental Material
Download PDF (133.5 KB)Acknowledgements
This paper was a part of the first author’s work during his stay as a visiting scholar at IHE Delft Institute for Water Education. Sajad Enteshari would like to acknowledge the Iranian Ministry of Science, Research, and Technology (MSRT), Isfahan University of Technology (IUT), and IHE Delft for their financial support.
Disclosure statement
No potential conflict of interest was reported by the authors.
Supplementary material
Supplemental data for this article can be accessed here.
References
- Abbasi, F., Sohrab, F., and Abbasi, N., 2017. Evaluation of irrigation efficiencies in Iran. Irrigation and Drainage Structures Engineering Research, 17 (67), 113–128.
- Ahmadi, A., et al., 2019. A dynamic model of water resources management using the scenario analysis technique in downstream of the Zayandehroud basin. International Journal of River Basin Management, 17 (4), 451–463. doi:10.1080/15715124.2018.1505734
- Allen, R.G., et al., 1998. Crop evapotranspiration. Rome, Italy: Food and Agriculture Organization of the United Nations (FAO).
- Ataie, M., 1997. Evaluation of implemented pressurized irrigation systems in Isfahan region. Thesis (MSc). Isfahan University of Technology, Isfahan, Iran.
- Bastan, M., et al., 2018. Sustainable development of agriculture: a system dynamics model. Kybernetes, 47 (1), 142–162. doi:10.1108/K-01-2017-0003
- Brouwer, C. and Heibloem, M., 1986. Irrigation water management: irrigation water needs. Rome, Italy: Food and Agriculture Organization of the United Nations (FAO).
- Brouwer, C., Prins, K., and Heibloem, M., 1989. Irrigation water management: irrigation scheduling training. Rome, Italy: Food and Agriculture Organization of the United Nations (FAO).
- Butler, C. and Adamowski, J., 2015. Empowering marginalized communities in water resources management: addressing inequitable practices in participatory model building. Journal of Environmental Management, 153, 153–162. doi:10.1016/j.jenvman.2015.02.010
- Chao, C., et al., 2017. A dynamic model for exploring water-resource management scenarios in an inland arid area: Shanshan County, Northwestern China. Journal of Mountain Science, 14 (6), 1039–1057. doi:10.1007/s11629-016-4210-1
- Davies, E.G.R. and Simonovic, S.P., 2011. Global water resources modeling with an integrated model of the social–economic–environmental system. Advances in Water Resources, 34 (6), 684–700. doi:10.1016/j.advwatres.2011.02.010
- Di Baldassarre, G., et al., 2013. Socio-hydrology: conceptualising human-flood interactions. Hydrology and Earth System Sciences, 17 (8), 3295–3303. doi:10.5194/hess-17-3295-2013
- Di Baldassarre, G., et al., 2018. Water shortages worsened by reservoir effects. Nature Sustainability, 1 (11), 617–622. doi:10.1038/s41893-018-0159-0
- Elshafei, Y., et al., 2014. A prototype framework for models of socio-hydrology: identification of key feedback loops and parameterisation approach. Hydrology and Earth System Sciences, 18 (6), 2141–2166. doi:10.5194/hess-18-2141-2014
- Felmeden, J., 2014. Agriculture in the Zayandeh Rud catchment. Frankfurt, Germany: Institute for Social-Ecological Research (ISOE).
- Forrester, J.W., 1961. Industrial dynamics. Cambridge, MA: The MIT Press.
- Garcia, M., Portney, K., and Islam, S., 2016. A question driven socio-hydrological modeling process. Hydrology and Earth System Sciences, 20 (1), 73–92. doi:10.5194/hess-20-73-2016
- Giordano, M. and Shah, T., 2014. From IWRM back to integrated water resources management. International Journal of Water Resources Development, 30 (3), 364–376. doi:10.1080/07900627.2013.851521
- Gohari, A., et al., 2013a. Water transfer as a solution to water shortage: A fix that can Backfire. Journal of Hydrology, 491 (1), 23–39. doi:10.1016/j.jhydrol.2013.03.021
- Gohari, A., et al., 2013b. Climate change impacts on crop production in Iran’s Zayandeh-Rud River Basin. Science of the Total Environment, 442, 405–419. doi:10.1016/j.scitotenv.2012.10.029
- Grigg, N.S., 2016. Integrated water resources management-an interdisciplinary approach. London: Springer Nature.
- Guest, J.S., et al., 2010. The use of qualitative system dynamics to identify sustainability characteristics of decentralized wastewater management alternatives. Water Science & Technology, 61 (6), 1637–1644. doi:10.2166/wst.2010.880
- Horlemann, L. and Mohajeri, S., 2017. Reviving the dying giant: integrated water resource management in the Zayandeh Rud catchment, Iran. Berlin: Springer.
- IPCC (Intergovernmental Panel on Climate Change), 2015. Climate change 2014: synthesis report. Geneva, Switzerland: Intergovernmental Panel on Climate Change (IPCC).
- Isfahan Agricultural Jihad Organization, 2017. Statistics and information [online]. Available from: http://agri-es.ir/Default.aspx?tabid=1925 [Accessed 2 Oct 2017].
- Isfahan Industry and Trade Organisation, 2018. Industry statistics and information [online]. Available from: https://esf.mimt.gov.ir/ [Accessed 2 Sep 2018].
- Isfahan RWW. Co., 2017. Statistics on the performance of rural water and wastewater company in Isfahan province [online]. Isfahan Rural Water and Wastewater Company. Available from: http://www.abfar-isfahan.ir [Accessed 15 Dec 2017].
- Isfahan University of Technology and Shahrekord University, 2018. Water requirement of Zayandehrood river and Gawkhooni wetland for their ecological functions. Isfahan, Iran: Isfahan Environmental Protection Agency.
- Isfahan WW. Co., 2017. Statistics and information of water and wastewater company, Isfahan province [online]. Isfahan Water and Wastewater Company. Available from: https://www.abfaesfahan.ir/ [Accessed 2 Dec 2017].
- Kotir, J.H., et al., 2016. A system dynamics simulation model for sustainable water resources management and agricultural development in the Volta River Basin, Ghana. Science of the Total Environment, 573, 444–457. doi:10.1016/j.scitotenv.2016.08.081
- Kotir, J.H., et al., 2017. Systemic feedback modelling for sustainable water resources management and agricultural development : an application of participatory modelling approach in the Volta River Basin. Environmental Modelling and Software, 88, 106–118. doi:10.1016/j.envsoft.2016.11.015
- Li, B., Sivapalan, M., and Xu, X., 2019. An urban sociohydrologic model for exploration of beijing’s water sustainability challenges and solution spaces. Water Resources Research, 55 (7), 5918–5940. doi:10.1029/2018WR023816
- Madani, K., Aghakouchak, A., and Mirchi, A., 2016. Iran’s socio-economic drought : challenges of a water-bankrupt nation. Iranian Studies, 49 (6), 997–1016. doi:10.1080/00210862.2016.1259286
- Madani, K. and Mariño, M.A., 2009. System dynamics analysis for managing Iran’s Zayandeh-rud river basin. Water Resources Management, 23 (11), 2163–2187. doi:10.1007/s11269-008-9376-z
- Mirchi, A., et al., 2012. Synthesis of system dynamics tools for holistic conceptualization of water resources problems. Water Resources Management, 26 (9), 2421–2442. doi:10.1007/s11269-012-0024-2
- Molle, F. and Mamanpoush, A., 2012. Scale, governance and the management of river basins: A case study from Central Iran. Geoforum, 43 (2), 285–294. doi:10.1016/j.geoforum.2011.08.004
- Montanari, A., 2015. Debates-perspectives on socio-hydrology: introduction. Water Resources Research, 51 (6), 4768–4769. doi:10.1002/2015WR017430
- Mooney, C., et al., 2012. Transparency and trade-offs in water planning. Journal of Hydrology, 474, 66–73. doi:10.1016/j.jhydrol.2012.06.040
- Morid, S., 2003. Adaptation to climate change to enhance food security and environmental quality: zayandeh Rud basin, Iran. Tehran, Iran: Tarbiat Modares University.
- Ogilvie, A., et al., 2019. Socio-hydrological drivers of agricultural water use in small reservoirs. Agricultural Water Management, 218, 17–29. doi:10.1016/j.agwat.2019.03.001
- Peña, H., 2011. Social equity and integrated water resources management. Global Water Partnership, Technical Committee (TEC), No. 15.
- Rahaman, M.M. and Varis, O., 2005. Integrated water resources management: evolution, prospects and future challenges. Sustainability: Science, Practice & Policy, 1 (1), 15–21.
- Rastghalam, M., 2013. Water demand management in drought conditions, case study: the Zayandehrud Basin. Thesis (MSc). Isfahan University of Technology.
- Roobavannan, M., et al., 2017a. Allocating environmental water and impact on basin unemployment: role of a diversified economy. Ecological Economics, 136, 178–188. doi:10.1016/j.ecolecon.2017.02.006
- Roobavannan, M., et al., 2017b. Role of sectoral transformation in the evolution of water management norms in agricultural catchments: a sociohydrologic modeling analysis. Water Resources Research, 53 (10), 8344–8365. doi:10.1002/2017WR020671
- Roobavannan, M., et al., 2020. Sustainability of agricultural basin development under uncertain future climate and economic conditions: a socio-hydrological analysis. Ecological Economics, 174, 106665. doi:10.1016/j.ecolecon.2020.106665
- Roozbahani, R., Schreider, S., and Abbasi, B., 2015. Optimal water allocation through a multi-objective compromise between environmental, social, and economic preferences. Environmental Modelling and Software, 64, 18–30. doi:10.1016/j.envsoft.2014.11.001
- Safavi, H.R. and Enteshari, S., 2016. Social tools for resolving the water crisis in the Zayandehrud river basin. In: International conference on water and environment in the new millennium: education and capacity building. Tehran: University of Tehran.
- Safavi, H.R., Golmohammadi, M.H., and Sandoval-solis, S., 2016. Scenario analysis for integrated water resources planning and management under uncertainty in the Zayandehrud River basin. Journal of Hydrology, 539, 625–639. doi:10.1016/j.jhydrol.2016.05.073
- Safavi, H.R., Golmohammadi, M.H., and Sandoval-Solis, S., 2015. Expert knowledge based modeling for integrated water resources planning and management in the Zayandehrud River Basin. Journal of Hydrology, 528, 773–789. doi:10.1016/j.jhydrol.2015.07.014
- Sally, H., et al., 2001. Water supply and demand in four major irrigation systems in the Zayandeh Rud basin, Iran. Karaj: Iranian Agricultural Engineering Research Institute (IAERI).
- Sandoval-Solis, S. and McKinney, D.C., 2014. Integrated water management for environmental flows in the Rio Grande. Journal of Water Resources Planning and Management, 140 (3), 355–364. doi:10.1061/(ASCE)WR.1943-5452.0000331
- Sangestani, M., 2019. Investigation and assessment of the effects of climate changes and implementation of groundwater reclamations in the Zayanderud River Basin. Thesis (MSc). Isfahan University of Technology.
- Sarhadi, A. and Soltani, S., 2013. Determination of water requirements of the Gavkhuni wetland, Iran: A hydrological approach. Journal of Arid Environments, 98, 27–40. doi:10.1016/j.jaridenv.2013.07.010
- Simonovic, S.P., 2009. Managing water resources: methods and tools for a system approach. London: UNESCO.
- Sivapalan, M., Savenije, H.H.G., and Blöschl, G., 2012. Socio-hydrology: A new science of people and water. Hydrological Processes, 26 (8), 1270–1276. doi:10.1002/hyp.8426
- Statistical Center of Iran, 2004. census of the environmental features of industrial units. Tehran: Statistical Center of Iran.
- Statistical Center of Iran, 2016. Tables of seasonal national and regional accounts of Iran (2006-2016). Tehran: Statistical Center of Iran.
- Statistical Center of Iran, 2018a. Population and housing census. Tehran: Statistical Center of Iran.
- Statistical Center of Iran, 2018b. Statistical yearbooks of Isfahan. Tehran: Statistical Center of Iran.
- Sterman, J., 2000. Systems thinking and modeling for a complex world. New York, NY: McGraw-Hill.
- Su, Y., Gao, W., and Guan, D., 2019. Integrated assessment and scenarios simulation of water security system in Japan. Science of the Total Environment, 671, 1269–1281. doi:10.1016/j.scitotenv.2019.03.373
- Tortajada, C., 2014. IWRM revisited: from concept to implementation. International Journal of Water Resources Development, 30 (3), 361–363. doi:10.1080/07900627.2014.937085
- van der Zaag, P., 2005. Integrated water resources management: relevant concept or irrelevant buzzword? A capacity building and research agenda for Southern Africa. Physics and Chemistry of the Earth, 30, 867–871. doi:10.1016/j.pce.2005.08.032
- Walker, W.E., Loucks, D.P., and Carr, G., 2015. Social responses to water management decisions. Environmental Processes, 2 (3), 485–509. doi:10.1007/s40710-015-0083-5
- Walters, P. and Javernick-will, A.N., 2015. Long-term functionality of rural water services in developing countries: a system dynamics approach to understanding the dynamic interaction of factors. Environmental Science & Technology, 49, 5035–5043. doi:10.1021/es505975h
- Winz, I., Brierley, G., and Trowsdale, S., 2008. The use of system dynamics simulation in integrated water resources management. Water Resources Management, 23 (7), 1301–1323. doi:10.1007/s11269-008-9328-7
- Yekom Consulting Engineering Co., 2013. Updating integrated water resources studies in Iran, Gavkhooni basin report. Tehran: Water and Wastewater Macro Planning Office.
- Zayandab Consulting Co., 2009. Determination of resources and consumptions of water in the Zayandehrud River Basin. Isfahan: Isfahan Regional Water Company.
- Zomorodian, M., et al., 2018. The state-of-the-art system dynamics application in integrated water resources modeling. Journal of Environmental Management, 227, 294–304. doi:10.1016/j.jenvman.2018.08.097