
 ?Mathematical formulae have been encoded as MathML and are displayed in this HTML version using MathJax in order to improve their display. Uncheck the box to turn MathJax off. This feature requires Javascript. Click on a formula to zoom.
ABSTRACT
Groundwater has become an alternative water supply for various sectors of the population and the economy, and its extraction is increasing worldwide. The water poverty index (WPI) is a holistic tool that enables the establishment of links between poverty, social marginalization, environmental integrity, water availability and health. The index includes five components – water resources, access, capacity, environment and use – which are evaluated on a scale of 0 to 100. The objective of this research is to calculate the WPI by applying remote perception techniques to the environment component. Through multi-temporal analysis, we estimate the variability of soil cover in a semi-arid area of San Luis Potosí in Mexico, where the available surface water and groundwater is mainly for agriculture. The overall result for the studied area was a WPI of 56, which reflects contradictions in the management of the resource that is abundant.
Editor S. Archfield Guest editor S. Pande
Introduction
Global population dynamics, which have led more than half of the world’s 7 billion people to live in urban areas (UN Citation2014), have resulted in pressure on water resources and different types of users (public-urban, agricultural and industrial) competing for their use. Governments must guarantee populations the human rights of a sufficient supply of water that is healthy, acceptable, accessible and affordable, as well as adequate food that is quantitatively and qualitatively suitable and sufficient (FAO Citation2010). In terms of industrial use, both government and businesses present significant challenges to establishing a system of production that prioritizes efficiency and care in water use rather than maximum production.
Given this scenario, the deterioration and reduction of water sources significantly limit access to water. For example, most wastewater is discharged directly into the environment without adequate treatment, reducing the availability of surface water, in addition to causing deterioration of aquatic ecosystems, spreading waterborne diseases, and producing negative repercussions on economic productivity (agriculture, for example).
For this reason, groundwater has become an alternative water supply for various social and economic sectors, providing drinking water to at least 50% of the world’s population and 43% of water to irrigated agriculture. It is expected that by 2050, global water extraction will increase by 55% (WWDR Citation2017). Deficiencies in water legislation and management further exacerbate this issue. As stated in the United Nations Report on Water Resources in the World in 2015, the global water crisis is a crisis of governance more than one of available resources (WWDR Citation2015).
The holistic tool called the Water Poverty Index (WPI) enables interest groups to establish direct public policies, identify where problems exist, and propose appropriate measures in the matter of water availability for different uses. The methodology under which this index was developed allows for the establishment of links among poverty, social marginalization, environmental integrity, water availability, and health. The WPI shows that it is not the quantity of available resources that determines a country’s level of poverty, but rather how effectively those resources are used (Sullivan Citation2001, Citation2002b, Sullivan et al. Citation2002a, Citation2003).
The WPI was applied to 140 countries, taking into account five components – water resources, access, capacity, use and the environment – on a scale of 0 to 100 (Lawrence et al. Citation2002). In this study, Finland, followed by Canada and Iceland, received the highest scores of 78, 77.8 and 77.1, respectively, while Ethiopia, Niger and Haiti obtained scores of 35 each. The highest-rated countries are rich or developed nations, and although their scores in the water resources component were less than 20 points, they make better use of water and pay more attention to conservation. In this report, Mexico received 57 points, a score that can be justified by the heterogeneity of the natural availability of water that depends on rainfall and climate, but also by the way it is used and managed in the country. The methodology has continued to be used in different parts of the world, with modifications and even some simplification of the components (Abraham et al. Citation2005, Cook et al. Citation2006, Jiménez Citation2007, El-Gafy Citation2008, Cho et al. Citation2010, Gine and Pérez-Foguet Citation2010, Jemmali and Matoussi Citation2013, Van der Vyver Citation2013, Jemmali and Sullivan Citation2014, Jemmali and Abu-Ghunmi Citation2016, Pan et al. Citation2017, Thakur et al. Citation2017, Hatem Citation2018, Kallio et al. Citation2018, Nadeem et al. Citation2018, Jemmali Citation2018).
The WPI has been applied in different regions of the state of San Luis Potosí that vary not only in terms of climate characteristics and resource availability, but also in terms of socioeconomic conditions. The first application was in the San Luis Potosí Valley, in the Central Region (López-Álvarez et al. Citation2013); the second was in the Valles River Basin in the Huasteca Region (López-Álvarez et al. Citation2015), and the third was in the Santo Domingo aquifer in the Altiplano Region (López-Álvarez et al. Citation2019). The WPI is a flexible and perfectible tool, to the extent that some authors have proposed modifications to improve and narrow down the methodology proposed by Sullivan and his collaborators. Thus, its components are in the process of being standardized, as is the case for the WPI applied in arid zones in Mexico where water quality was added as a component (López-Álvarez et al. Citation2013, Citation2015, Citation2019).
The objective of this research is to calculate the WPI for the Rio Verde Aquifer (RVA), located in the Middle Region of San Luis Potosí, with semi-warm climatic conditions, where surface water and groundwater are highly available and are used mainly for agriculture, but the water quality is not good enough for human consumption. In this work, one of the most important modifications is the characterization and calculation of the environment component using remote sensing techniques. The variability of land cover is estimated through a multi-temporal analysis.
The RVA covers an area of 2770 km2 and is part of Hydrological Region 26 “Rio Panuco,” Alto Panuco Hydrological Subregion, Tampaon River basin. Its main stem is the Rio Verde (). The average annual precipitation and temperature are 668.0 mm and 21.5°C, respectively, and the potential evaporation is around 1685 mm per year. There are three types of climate in the aquifer: in the northern zone the climate is dry-semi-warm, while in the central region, the semi-dry-semi-warm climate predominates, and the southern zone has a semi-warm-subhumid climate. All three zones receive rainfall in summer (CONAGUA Citation2015).
Figure 1. Location of the Río Verde aquifer, San Luis Potosí
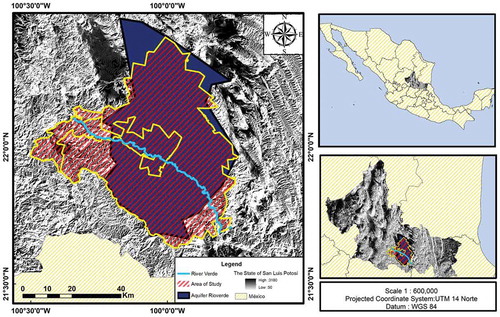
Within the RVA are the municipalities of Rioverde and Ciudad Fernández (RV-CF), as well as small regions of Cerritos, Villa Juárez, Ciudad del Maíz, Alaquines and Cárdenas. The municipalities of RV-CF and their surrounding areas (127,000 inhabitants) make use of most of the hydrogeological unit of the Rio Verde and, therefore, these municipalities will be considered for the calculation of the WPI.
Materials and methods
The composite index approach is based on the premise that a combination of relevant variables can provide a more complete perspective in a situation than one can by itself. The variables that make up the WPI are represented mathematically as follows:
where WPIi, is the Water Poverty Index, resulting from multiparametric expression with a value between 0 and 1, weighted by the six components: resources (R); access (A); use (U); capacity (C); environment (E) and water quality (Q) (see ). The components of the WPI are weighted based on their relative importance, using functions of weight w, applied to each component Xi. EquationEquation (1)(1)
(1) is expressed in a developed form as:
Table 1. Key components in the Water Poverty Index (WPI) (adapted from Lawrence et al. Citation2002)
This method in a certain iterative way enables the validation and evaluation of the consistency of the analytical results and provides the basis to modify and reevaluate the weights assigned to the parameters. Each component influences the WPI, expressed in effective weights. The effective weight Wxi can be calculated for each component according to EquationEquation (3)(3)
(3) (Ramos Citation2002):
where Xri and Xwi are the scores for each component Xi and their theoretical weights, and Wi is the sum of theoretical weights.
Comparison of the values of the different variables that make up the subcomponents can be done through normalization, in this case with the minimum-maximum method used in different studies (Sullivan and Meigh Citation2003, van Ty et al. Citation2010, Jemmali and Abu-Ghunmi Citation2016). Normalization allows comparable data to be obtained in a standard range of 0 to 1.
The results of each component are plotted on a polygon, where the edges represent 100% of each component. With normalization, the maximum value is 1 and the minimum is 0 (in the middle); therefore, the ideal polygon is the one where all the components of the WPI reach values of 1 and thus form a hexagon. Conversely, values less than 1 move away from the hexagon and form an irregular polygon, representing deficiencies in the components.
Environment (E)
Water, as mentioned by Scoones (Citation1998), is a key component of the natural capital rights of households, but also of healthy ecosystems, and little attention has been paid to the water needs of nature itself (Sullivan Citation2002b). In this sense, economic development has been boosted by promoting agricultural or industrial production, causing disturbances to water systems, generating not only their deterioration but also their depletion.
In this case, agricultural development has increased the extension of farmland at different times; in this area, irrigation practices have their roots in the 17th century (Escobar-Ohmstede Citation2013) and are currently the main user of water resources. One way to evaluate the impact these practices have had is by using vegetation indices.
The purpose is to evaluate the environment component with remote sensing techniques, which is a novel proposal that is efficient, fast, and affordable. The new estimate allows constant monitoring of changes that occur in large areas of land due to the use of satellite data and implementation of vegetation coverage indices. The advantage of applying remote sensors is that they increase the capacity for monitoring and analyzing spatio-temporal transformations, giving the possibility, even, of making forecasts based on patterns identified, for example, by the loss of natural plant coverage due to land-use changes.
In different investigations, the normalized difference vegetation index (NDVI, Rouse et al. Citation1974) or soil adjusted vegetation index (SAVI, Huete Citation1988) have been used; this study proposes an integrative methodology of four spectral indices for characterizing plant cover: the NDVI, the SAVI, the leaf area index (LAI, Breda Citation2003), and the chlorophyll index (Gitelson et al. Citation2003).
The spectral indices (NDVI, SAVI, LAI, and CIgreen) were selected due to (a) their ability to detect vegetation cover and (b) their complementary capacities that enable increasing the level of detection certainty. Each of those indices provides information to the base index. The NDVI was used as a reference index to identify the distribution of vegetation as well as differentiate other types of surface coverage such as soil and water. The SAVI supports correcting spectral values according to the effects of soil reflection.
For its part, the LAI provides the density of the vegetation present – that is, it is an indicator of the amount of biomass per area – while CIgreen is a parameter that specifies the amount of chlorophyll in the leaves and the tree canopy. The satellite data used was acquired by the Landsat 7 platform through the US Geological Survey portal (https://earthexplorer.usgs.gov/).
The images correspond to the period of study between 2006 and 2016 in the months of February. Radiometric and atmospheric corrections were applied according to Chandler et al. (Citation2009) and Chuvieco (Citation1991). Finally, indices were calculated as follows: NDVI = (NIR – Red)/(NIR + Red); SAVI = ((NIR – Red)/(NIR + Red) + L) × (1 + L), with L = 0.5; LAI = 1/0.91 × (ln (0.69 – SAVI)/0.59); and CIgreen = (Red/Green) – 1. The spectral bands used for land cover estimation were: Band 2 or Green (0.52–0.60 µm), Band 3 or Red (0.63–0.69 µm) and Band 4 or near infrared (NIR, 0.77–0.90 µm).
The integration of the indices was done using weighting of weights (Urbano-Peña Citation2017) as follows:
where E represents the result of the component; n indicates the total number of indices; i is the index (1, NDVI; 2, SAVI; 3, LAI; 4, CIgreen); faci is the weighting factor for the index map; and INDEXi, represents the map of the calculated index. The values of faci are calculated semi-empirically from the correlation matrix of the normalized indices and, based on their variability, the weight of each index is assigned. The evaluation scale of E is from 0 to 1.
Resource (R)
The resource component is constituted considering the sources of surface and groundwater that are available in the study area. An annual volume of 231.1 hm3 of groundwater is harvested, made up of 95.8 hm3 of extraction of the RVA, of which 81.9 hm3 (85.5%) is for agricultural use, and 13.9 hm3 (14.5%) is destined for urban use. An annual volume of 135.3 hm3 of water from the Media Luna Spring is added to the extracted volume, and it is used by the DR-049, in the Municipality of Rioverde (DOF Citation2014), which constitutes one of the most important agricultural regions of the state of San Luis Potosí and the main economic activity in the study area (CONAGUA Citation2015).
In terms of surface water, the main tributary streams in the El Refugio-Ciudad Fernández region are Arroyo Morales, Arroyo Grande, Arroyo El Sauz and Arroyo San Rafael. The volume used from this source is 3.8 hm3 per year, with just over 90% used for agriculture (Urbano-Peña Citation2017).
For this component, surface water (Ws) and groundwater (Gw) are considered as subcomponents. The weight assigned to each subcomponent is related to the percentage of use, as seen in the following mathematical expression:
Access (A)
The RVA concentrates 67.67% of the population, while RV-CF holds the remaining 33.33% of inhabitants. In Rioverde, 90% of inhabitants have access to drinking water, while Ciudad Fernández’s drinking water only reaches 78% of the population; 85% of the population has access to drinking water (Urbano-Peña Citation2017). In terms of access to sanitation, the population has a drainage coverage of 84%. Furthermore, there is a wastewater treatment plant in Rioverde that also receives wastewater from Ciudad Fernández. The percentage of treatment is 84% (Urbano-Peña Citation2017).
This subcomponent is calculated based on the hectares destined for crops in the area and the number of them that have access to water for irrigation. The arable land in the RVA is 44 347 ha, of which 32% has access to irrigation water (Urbano-Peña Citation2017). In this way, the component considers the percentage of the population that has access to safe water for their basic needs (Aap), the percentage of water receiving sanitation (As) and the agricultural area with irrigation (Ai). The expression that defines this component is:
The allocation of weights for the subcomponents was obtained through a weight analysis (Ramos Citation2002, Urbano-Peña Citation2017).
Capacity (C)
The basis for the development of the capacity component is the human development index (HDI) because its variables have a direct influence on water access and quality. The HDI in the research area (UNDP/Mexico Citation2014) was applied at the municipal level; however, in lieu of the municipal gross domestic product (GDP) per capita, which is unavailable, the total net income per capita per household is used, based on the National Household Income and Expenditure Survey of 2017 of the National Institute of Statistics and Geography (INEGI Citation2017).
Both Rioverde and Ciudad Fernández are classified as medium-sized urban municipalities. The former concentrates 57.8% of its population in its municipal seat and the latter 73.5%. The rest of the inhabitants reside in towns with populations of less than 2500 people. Both municipalities have a high degree of migration to the United States, which provides remittance income for 18.7% of households (CONABIO Citation2015).
Other sources of income for the population of these municipalities include the provision of services and commerce (due to tourism activity) and agricultural activity. Regarding education, the population receives only 7.1 years of schooling, and 76.7% of the population have not concluded their primary education.
The capacity component is made up of the income index (Ii); the mortality rate of children under 5 years of age (Mi); the education index (Ie) and the Gini coefficient (CG). The capacity is evaluated through the expression:
Use (U)
The use component considers three subcomponents: water for domestic use (Ud), water for industrial use (Ui), and water for agricultural use (Ua). However, within the RVA, there is no significant industrial activity; the main economic activity with a major influence on the development of the RVA municipalities is agriculture.
Thus, agricultural use represents a volume of 81.9 hm3 (85.5%), whereas 13.9 hm3 (14.5%) goes to public-urban use, with an average drinking water supply to inhabitants of 200 L/inhabitant/d (Urbano-Peña Citation2017). This component is determined based on the following equation:
The weight assigned for the subcomponents is based on the percentage of water use that is counted in the study area.
Water quality (Q)
Water quality has become a factor directly related to availability. Physical surface water or groundwater availability is not enough; today more than ever, quality is an attribute that must be considered in order to manage the risks associated with it. Although quality depends on both natural and anthropogenic factors, the contamination of water by human action is the main cause of the degradation of water quality throughout the world.
In the region studied, geology has a significant impact on water quality and soil type due to the evaporite formations that generate a large amount of sulfates and hardness in the water. This condition causes the eastern portion of the RVA to have issues with high salinity concentrations (Ballín-Cortés et al. Citation2004, Hernández-Martínez Citation2008). In addition to this, the lack of capacity for wastewater treatment in the municipalities of this area increases the problems of contamination in the bodies of water (Hernández-Martínez Citation2008).
For the quality component, water quality was evaluated based on the water quality index (WQI) for human consumption and the sodium adsorption ratio (SAR) as an indicator of water quality for agriculture. The WQI is a tool that enables the level of water contamination for human consumption to be determined, and it is evaluated based on the reference levels of Official Mexican Standard 127 (NOM-127-SSA1-1994). This index is the weighted sum of multiple physicochemical parameters (Brown and Mccleland Citation1974). Its value ranges from 0 to 100; the closer this value is to 100, the better the water quality. Its mathematical expression is defined by:
where Ci is the percentage value assigned to the parameters due to their concentration; Pi is the weight assigned to each parameter; and k is a constant, which takes a value of 1 for clear water without apparent contamination, 0.75 for clear water with slight color, foam, or slight unnatural turbidity; 0.50 for water that appears to be contaminated, and 0.25 for black water that presents fermentation and odors. Overall, it is evaluated on a scale of 0 to 1, where 1 represents excellent quality and values less than 0.5 represent serious pollution problems.
To evaluate the quality of agricultural use, the Wilcox diagram (Ayers and Westcot Citation1985) was used. The construction of the diagram considers the electrical conductivity (EC) and the SAR (Richards Citation1954) for each of the samples. EC indicates the risk of soil salinity; that is, the greater the salt concentration in the soil, the higher the osmotic pressure and the lower the capacity of plants to absorb the water due to the excess of ions. The SAR (EquationEquation 10(10)
(10) ) reflects the exchange of sodium ions (Na+) with calcium (Ca2+) and magnesium ions (Mg2+), and a high concentration of sodium in the water would result in the loss of structure and permeability of the soil (Pérez León Citation2011):
Waters can be grouped according to their sodium contents, as a percentage (% Na). Below 20% is considered excellent for use in agricultural irrigation, 20–40% is good, 40–60% is admissible, and 60–80% is doubtful. Values higher than 80% are considered inadequate (Wilcox Citation1955). The quality component is evaluated using both the WQI for domestic use (WQId) and the WQI for agricultural use (WQIagr), whose weights are considered based on the percentage of use:
For this component, 44 water samples were collected and analyzed from wells, dug wells, and springs distributed in the study area, to measure the cations of calcium (Ca2+), magnesium (Mg2+), sodium (Na+), potassium (K+) and boron (B3+) and major anions of chlorides (Cl−), sulfates (SO42−), phosphates (PO43−) and nitrates (NO3−). The pH, EC, temperature, redox potential (PR), dissolved oxygen (DO) and alkalinity were measured in each sample in situ.
Results and discussion
Environment component
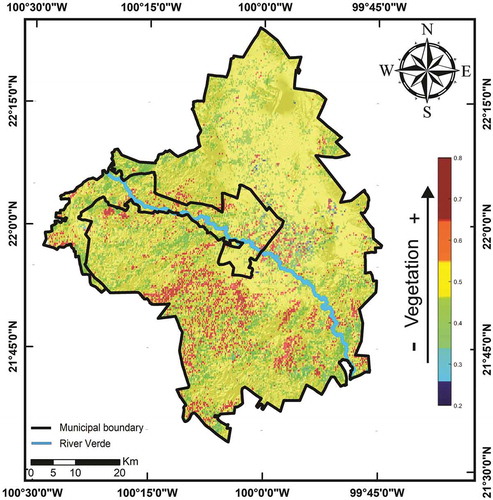
Human activities generate changes in land use, directly impacting natural cycles such as water and vegetation. The environmental services offered by nature directly related to water have a vital impact on soils, vegetation cover, surface runoff, catchment and recharge for water tables. The methodology proposed for the evaluation of this component allows the comparison of vegetation indices and their spatial-temporal changes. displays the average values of each index, which show an increase over the course of the evaluation period (10 years). This suggests an increase in plant cover that can be attributed to the increase in vegetation and agricultural area.
Table 2. Changes in vegetation indices normalized difference vegetation index (NDVI), soli adjusted vegetation index (SAVI), leaf area index (LAI) and chlorophyll index (CIgreen) 2006–2016
Subsequently, through a linear correlation, a matrix was obtained () that indicated the relationship between each vegetation index and its degree of influence for the allocation of weights in the normalized weighting (faci) of each index. Finally, EquationEquation (4)(4)
(4) was applied to calculate the value of the environment component. The value of this component is 0.49, and the spatial distribution of the resulting Component E is shown in .
Table 3. Correlation matrix for the normalized difference vegetation index (NDVI), soli adjusted vegetation index (SAVI), leaf area index (LAI) and chlorophyll index (CIgreen) indices
Figure 2. Spatial distribution resulting from components of the study area
Resource component
The study area benefits from its climatic and topographic conditions, as well as geohydrological features leading to water resource availability and distribution. Karsticity in the RVA gives origin to the water of the existent springs; recharge comes from the mountainous areas to the north and west, and in the plains, water circulates through the karstic environment, and in some areas, passes to the granular medium (Ballín-Cortés et al. Citation2004).
This condition generates a physical availability of water in a way that has made agricultural activity viable without competing with the demand for water for the population – until the present. This condition is reflected in the evaluation of this component with a score of 0.68.
Access component
Adequate access to drinking water and sanitation is a decisive factor in reducing mortality and morbidity among the population under 5 years of age and in reducing the incidence of water-borne diseases (CONAGUA Citation2011). On the other hand, it is important to ensure access to water for irrigation, since this favors the increase of income to producers and a decrease in the cost of food for all consumers (FAO Citation2001).
The access component registered a value of 0.72 due to the high drinking water and sanitation coverage provided by the RV-CF conurbation’s hydro-sanitary infrastructure. Just over a third of agricultural land has access to water for irrigation.
Capacity component
In general, the RV-CF population shows a condition of medium marginalization and low economic well-being, since 73.3% of the population has incomes below the poverty line and therefore cannot satisfactorily access food, education, health, housing, transportation, and recreation (CONABIO Citation2015). The Ii for the studied population is 0.65, the Mi is 0.01, the Ie is 0.58, and the CG is 0.42 (Urbano-Peña Citation2017).
The resulting value for the capacity component was 0.52. This value can be explained from the fact that the population has a medium degree of marginalization and low social backwardness; however, 61.80% of the population lives in poverty (CONABIO Citation2015).
Use component
The study area is known for protected agriculture, horticulture, and fruit growing (COPLADE Citation2016); the primary sector in the Middle Zone contributes 34.5% of the regional GDP, a situation that is possible due to the availability of water for irrigation and that makes it the main consumer of surface and groundwater.
In the RVA, 85% of the population has access to drinking water; however, the rest of the population – which is dispersed outside the conurbation – has a poor supply, which is reflected in the score of 0.38 for the use component.
Quality component
Availability is limited not only in terms of quantity but also in the quality of water that can be used for consumption and food production. By analyzing 44 water samples, WQIs for human consumption and agricultural use were calculated. In the first case, EquationEquation (9)(9)
(9) was applied. In the case of quality for human consumption, we obtained a maximum value of 84.8, for samples 14 and 15 corresponding to the San Diego dam and the El Nacimiento spring, respectively. The minimum values were 7.8 and 7.3, for samples 29 and 39, which correspond to two wells for agricultural use.
shows that 70% of the samples are of a quality that indicates restrictions for their use. The water that is extracted in these points belongs to the granular aquifer, where evaporites (gypsum, anhydrite, and dolomite) are predominant, while the best water quality is in the southwest, close to the mountain area, where recharge influences the quality of the water that is extracted.
Figure 3. Classification of water according to Wilcox
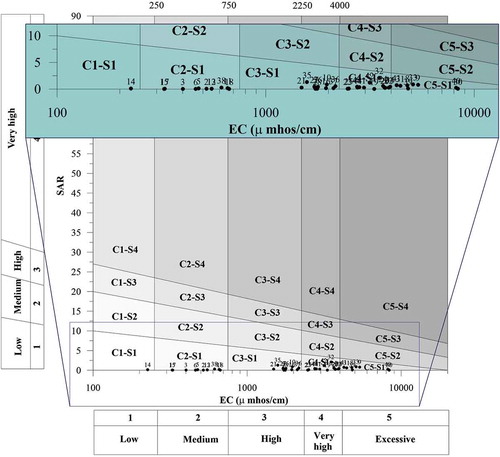
In terms of calculating water quality for agricultural use, all of the sampled sites fall within the S1 classification () – that is, they present a low sodicity hazard since they have SAR values of less than 10 meq/L. In terms of the EC classification, two groups can be observed; the first, which represents 25% of the samples, falls between C1 and C2, with low to medium sodicity hazard (). The other group is between C3 and C5, with high to excessive sodicity hazard. The water quality of this group of samples is related to the interaction with evaporite rocks in which the groundwater circulates. By substituting the values in EquationEquation (11)(11)
(11) and solving it, the resulting final value is 0.51.
Once the value for each component of the WPI has been calculated, each component’s score and assigned weight is presented in . The overall result of the Water Poverty Index for the RVA in the Middle Zone of San Luis Potosí was 56 points, plotted in the resulting polygon ().
Table 4. Water poverty index values obtained for each component for the Rio Verde Aquifer
Figure 4. Hexagon of the standard Water Poverty Index of the Rio Verde aquifer
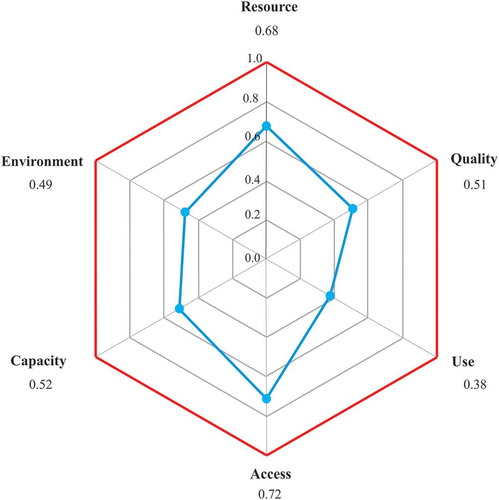
As can be seen, the components with the highest scores are resource and access, while the lowest are environment and use. Quality and capacity are around the average. From these results, it is determined that resource administrators must work on the capacity and use components for better management of the resource for the population. On the other hand, although the environment score was relatively low, it is necessary to consider that any modification to the use of the soil can cause deterioration to the environment; however, it has been observed that agriculture has increased in recent years except for adding fertile soil, which has increased vegetation.
Conclusions
This study shows the development and application of the WPI in a semi-arid zone in the central part of Mexico. In this work, the methodology for evaluating the environment component was improved, allowing for the comparison of vegetation indices and their spatial-temporal changes.
The main advantage of applying the WPI methodology is to simplify, quantify and communicate key information; however, its main limitation is access to data. In this case, the information to evaluate the index was obtained by searching government or official sources, or they were constructed empirically, as in the case of the quality and environment components.
The results show an increase in plant cover over a 10-year evaluation period; however, this can also be attributed to the increase in agricultural area, a situation that is not favorable for the environment, since agriculture has historically displaced natural vegetation, a situation that is reflected in the resulting value of 0.461.
The recharge to the hydrogeological system comes from the mountain ranges of the north and west in the karstic environment, and the flow is directed toward the center of the valley, preferably by the granular medium through which it emerges as springs in the zone of the Media Luna. This availability favors agricultural activity, without creating competition with population water demand; this is consistent with the score obtained for the resource component (0.68).
The conurbation of RV-CF concentrates the hydro-sanitary infrastructure and registers a high coverage; however, just over a third of the agricultural area has access to water for irrigation, which is why the access component received a score of 0.72.
In general, the population has a medium degree of marginalization and low social backwardness; however, 61.80% of the population lives in poverty, so the resulting value for the capacity component was 0.52.
The study area’s economic activities are mainly protected agriculture, horticulture and fruit growing; the primary sector in the Middle Zone contributes 34.5% of the regional GDP, a situation that is possible due to irrigation water availability, and that makes it the main consumer of surface and underground water. Eighty-five percent of the population has access to drinking water, while the remaining population – dispersed outside the conurbation – has a poor supply, a situation that is reflected in the score of 0.38 for the use component.
In terms of quality, a maximum value of WQI of 84.8 was obtained for samples from the San Diego dam and the El Nacimiento spring. Scores of <8 were recorded for two wells for agricultural use. In the northeast, 70% of the samples have quality scores indicating restrictions for human consumption, due to interaction with evaporites. The best water quality is in the southwest, close to the recharge zone in the mountains (which are composed mainly of limestone).
Water quality for the valley’s agricultural use is classified as S-1, with low sodicity hazard. In the case of the EC classification, two groups can be observed, one between C1 and C2 – with low to medium sodicity hazard – which includes 25% of the samples. The other group comprises 75% of the samples; they are classified from C3 to C5, indicating high to excessive sodicity hazard. In general, the quality of water for human use and agricultural irrigation obtained a final score of 0.51.
The overall result of the WPI for the RVA in the Middle Zone of San Luis Potosí was 56 points, which reflects some contradictions in the management of this resource.
The WPI polygon shows that although water is an abundant resource and the population has access to it, the environment has deteriorated, the resource quality is not good enough for human consumption, and it is limited for agricultural use. This situation suggests the establishment of systematic water quality monitoring to identify fluctuations in physical, chemical, and even biological parameters, since this area is a major economic hub for agribusiness, maquiladoras, and tourism.
On the other hand, it is important to establish that the physical availability of water does not depend merely on its presence, but also on socioeconomic aspects, public policy, legislation, and environmental factors; in other words, the problem of water scarcity for both domestic and productive use is one of poor water governance. The United Nations Development Programme (UNDP) asserts that to improve water governance it is essential to break the vicious circle of world poverty.
The Middle Zone of San Luis Potosí obtained a score of 56 points on the WPI, reflecting the fact that the majority of the population lives in a medium degree of poverty and marginalization, and is dispersed outside the metropolitan area where supply is deficient. In other words, given that the score is the result of poor management of the resource, possible solutions must consider the different dimensions, scales, and stakeholders involved in water issues.
Disclosure statement
No potential conflict of interest was reported by the authors.
References
- Abraham, E., Fusari, M., and Salomón, M., 2005. Water Poverty index: application and methodological adjustment at the local and community level. Case study. Lavalle department. Mendoza (Argentina). In: A. Fernández Cirelli and E. Abraham, eds. Uso y Gestión del Agua en Tierras Secas. Vol. XI El Agua en Iberoamérica. Argentina: CYTED Área IV. Desarrollo Sostenible, 25–40.
- Ayers, S. and Westcot, D., 1985. Water quality for agriculture. Rome, Italia: Food and Agriculture Organization of the United Nations.
- Ballín-Cortés, J.R., et al., 2004. Evaluation of the agricultural impact on groundwater in the zone of Rioverde, S. L. P. Technical brochure. San Luis Potoí: Autonomous University of San Luis Potosí.
- Breda, N.J.J., 2003. Ground-based measurements of leaf area index: A review of methods, instruments and current controversies. Journal of Experimental Botany, 54, 2403–2417. doi:10.1093/jxb/erg263
- Brown, R. and Mccleland, N., 1974. Water quality index. Application in The Kansas River Basin. Kansas City: U. S. Environmental Protection Agency, Region VII.
- Chander, G., Markham, B.L. and Helder, D.L., 2009. Summary of current radiometric calibration coefficients for Landsat MSS, TM, ETM+, and EO-1 ALI sensors. Remote Sensing of Environment, 113 (5), 893–903 doi:10.1016/j.rse.2009.01.007
- Cho, D.I., Ogwang, T., and Opio, C., 2010. Simplifying the water poverty index. Social Indicators Research, 98 (2), 257–267. doi:10.1007/s11205-009-9501-2
- Chuvieco, E., 1991. Space remote sensing fundamentals. 1st ed. Madrid: Rialp edits.
- CONABIO, 2015. Population and demography. National commission for the knowledge and use of biodiversity. Atlas of Nature and Society. Available from: http://www.biodiversidad.gob.mx/atlas/social/SLP/Pd/index.html [Accessed 10 December 2018].
- CONAGUA, 2011. Statistics on water in Mexico [online]. Chapter 6: water, health and environment. National Water Comission. Available from: http://www.conagua.gob.mx/CONAGUA07/Contenido/Documentos/SINA/Capitulo_6.pdf [Accessed 29 March 2019].
- CONAGUA, 2015. Update of the annual average availability of water in the aquifer of Río Verde (2415). Mexico: Comisión Nacional del Agua, Estado de San Luis Potosi.
- Cook, S., et al., 2006. Water poverty mapping in the Volta basin: looking for linkages between water and poverty. Ghana: Water and food, Basin Focal Project Workshop Report.
- COPLADE, 2016. State development plan 2015–2021 [online]. State Development Planning Committee. Available from: http://www.slp.gob.mx/plan2015-2021/assets/plan2016_completo.pdf [Accessed 2 March 2019].
- DOF, 2014. Agreement by which technical studies are disseminated of national groundwater of the aquifer Rio Verde, code 2415, in the State of San Luis Potosí, Northern Gulf administrative hydrological region. Secretary of the Interior of Mexico.
- El-Gafy, I.K.E.-D., 2008. The water poverty index as an assistant tool for drawing strategies of the Egyptian water sector. Ain Shams Engineering Journal, 9 (2), 173–186. doi:10.1016/j.asej.2015.09.008
- Escobar-Ohmstede, A., 2013. Changes in the hydroagrarian landscape. Is the revolution a detonating? The case of San Luis Potosí (1910–1940). Relaciones, 136, 265–315.
- FAO (Food and Agriculture Organization of the United Nations), 2001. Irrigation water management: irrigation methods. Training manual no. 5. Available from: http://www.fao.org/tempref/agl/AGLW/fwm/Manual5.pdf [Accessed 10 December 2018].
- FAO (Food and Agriculture Organization of the United Nations), 2010. Right to adequate food. Informative brochure No. 34. [online]. United Nations Human Rights. Office of the High Commissioner. Available from: https://www.ohchr.org/Documents/Publications/FactSheet34sp.pdf [Accessed 11 December 2018].
- Gine, R. and Pérez-Foguet, A., 2010. The enhanced water poverty index: targeting the water poor at different scales [online]. WISA 2010 Biennial Conference. Available from: https://upcommons.upc.edu/bitstream/handle/2117/9752/WISA2010.pdf [Accessed 15 December 2018].
- Gitelson, A.A., Gritz, Y., and Merzlyak, M.N., 2003. Relationships between leaf chlorophyll content and spectral reflectance and algorithms for non-destructive chlorophyll assessment in higher plant leaves. Journal of Plant Physiology, 160 (3), 271–282. doi:10.1078/0176-1617-00887
- Hatem, H., 2018. Water Poverty in Africa: A Review and Synthesis of Issues, Potentials, and Policy Implications. Social Indicators Research, 136 (1), 335–358. doi:10.1007/s11205-012-0218-2
- Hernández-Martínez, J.L., 2008. Effect of geochemical evolution on groundwater quality in the central portion of the middle zone of the state of San Luis Potosí. Thesis (MSc). Autonomous University of San Luis Potosi.
- Huete, A.R., 1988. A soil-adjusted vegetation index (SAVI). Remote Sensing of Environment, 25 (3), 295–309. doi:10.1016/0034-4257(88)90106-X
- INEGI, 2017. National household income and expenditure survey of 2017. National Institute of Statistics and Geography. Available from: https://www.inegi.org.mx/programas/enh/2017/ [Accessed 20 March 2019].
- Jemmali, H., 2018. Water poverty in Africa: A review and synthesis of issues, potentials, and policy implications. Social Indicators Research, 136 (1), 335–358. doi:10.1007/s11205-016-1521-0
- Jemmali, H. and Abu-Ghunmi, L., 2016. Multidimensional analysis of the water-poverty nexus using a modified water poverty index: a case study from Jordan. Water Policy, 18 (4), 826–843. doi:10.2166/wp.2016.147
- Jemmali, H. and Matoussi, M.S., 2013. A multidimensional analysis of water poverty at local scale: application of improved water poverty index for Tunisia. Water Policy, 15 (1), 98–115. doi:10.2166/wp.2012.043
- Jemmali, H. and Sullivan, C.A., 2014. Multidimensional analysis of water poverty in MENA region: an empirical comparison with physical indicators. Social Indicators Research, 115 (1), 253–277. doi:10.1007/s11205-012-0218-2
- Jiménez, M.C., 2007. Construction of the water poverty index for surface water resources. Case study for 24 municipalities of the River basin Bogotá. Cundinamarca Colombia. Thesis. Pontificia Universidad Javeriana.
- Kallio, M., Guillaume, J. H. A., Kummu, M. and Virrantaus, K., 2018. Spatial variation in seasonal water poverty index for Laos: an application of geographically weighted principal component analysis. Social Indicators Research, 140 (1), 1131–1157. doi:10.1007/s11205-017-1819-6
- Lawrence, P., Meigh, J., and Sullivan, C.A., 2002. The water poverty index: an international comparison. Keele Economics Research Papers. Keele, UK: Keele Economics Department.
- López-Álvarez, et al., 2013. Calculation of the water poverty index in semi-arid areas: San Luis Potosí Valley case. Revista Internacional de Contaminación Ambiental, 29 (4), 249–260.
- López-Álvarez, B., et al., 2015. Water poverty index in subtropical zones: the case of Huasteca Potosina, Mexico. Revista Internacional de Contaminación Ambiental, 31 (2), 173–184.
- López-Álvarez, B., et al., 2019. Water poverty index Iin Arid zones: the Barril Aquifer, Santo Domingo, San Luis Potosi. Revista Internacional de Contaminación Ambiental, 35 (1), 35–46. doi:10.20937/RICA.2019.35.01.03
- Nadeem, A.M., Cheo, R., and Shaoan, H., 2018. Multidimensional analysis of water poverty and subjective well-being: a case study on local household variation in Faisalabad, Pakistan. Social Indicators Research, 138 (1), 207–224. doi:10.1007/s11205-017-1652-y
- Pan, A., Bosch, D., and Ma, H., 2017. Assessing water poverty in China using holistic and dynamic principal component analysis. Social Indicators Research, 130 (2), 537–561. doi:10.1007/s11205-015-1191-3
- Pérez León, J.M., 2011. Manual for determining the quality of water for agricultural irrigation. Veracruz University.
- Ramos, J.A., 2002. Validation of aquifer vulnerability maps and environmental impact: turbio River case, Guanajuato Thesis. (PhD). National Autonomous University of México.
- Richards, L.A., 1954. Diagnosis and improvement of saline and alkali soils. Soil Sciences, 78 (2), 154. doi:10.1097/00010694-195408000-00012
- Rouse, J.W., et al., 1974. Monitoring vegetation systems in the great plains with ERTS [online]. Goddard Space Flight Center 3d ERTS-1 Symp., Vol. 1, Sect. A. Available from: https://ntrs.nasa.gov/archive/nasa/casi.ntrs.nasa.gov/19740022614.pdf [Accessed 20 September 2018].
- Scoones, I., 1998. Sustainable rural livelihoods: a framework for analysis. IDS Working Paper No.72. Brighton: IDS.
- Sullivan, C.A., 2001. The potential for calculating a meaningful water poverty index. International water resources association. Water International, 26 (4), 471–480. doi:10.1080/02508060108686948
- Sullivan, C.A., et al., 2002a. Derivation and testing of the water poverty index phase 1. Final report May 2002. Wallingford: Center for Ecology and Hydrology, 603.
- Sullivan, C.A., 2002b. Calculating a water poverty index. World Development, 30 (7), 1195–1210. doi:10.1016/S0305-750X(02)00035-9
- Sullivan, C.A., et al., 2003. The water poverty index: development and application at the community scale. Natural Resources Forum, 27 (3), 189–199. doi:10.1111/1477-8947.00054
- Sullivan, C.A. and Meigh, J., 2003. Considering the water poverty index in the context of poverty alleviation. Water Policy, 5 (5), 513–528. doi:10.2166/wp.2003.0033
- Thakur, J.K., et al., 2017. ArticleWater poverty in upper Bagmati River Basin in Nepal. Water Science, 31 (1), 93–108. doi:10.1016/j.wsj.2016.12.001
- UN, 2014. The demographic situation in the world in 2014 [online]. 695 United Nations Department of Economic and Social Affairs. Population Division. Available from: http://www.un.org/en/development/desa/population/events/pdf/other/4/World%20Population%20Situation_2014_10%20key%20findings_es.pdf [Accessed 15 November 2018].
- UNDP, 2014. Municipal human development index in Mexico: new methodology [online]. United Nations Development Program. Available from: https://www.undp.org/content/dam/mexico/docs/Publicaciones/705PublicacionesReduccionPobreza/InformesDesarrolloHumano/UNDPMX-PovRedIDHmunicipalMexico-032014.pdf [Accessed 23 November 2018].
- Urbano-Peña, M.A., 2017. Water poverty index in the Cerritos-Villa Juárez and Rioverde aquifers of the Middle Zone of San Luis Potosí. Thesis (MSc). Instituto Potosino de Investigación Científica y Tecnológica, San Luis Potosí.
- Van der Vyver, 2013. Water poverty index calculation: additive or multiplicative function? Journal of South African Business Research, 2013 (1), 1–11. doi: 10.5171/2013.615770
- van Ty, T.V., et al., 2010. Evaluation of the state of water resources using modified water poverty index: a case study in the SREPOQ river basin, Vietnam–Cambodia. International Journal of River Basin Management, 8 (3–4), 305–317. doi:10.1080/15715124.2010.523004
- Wilcox, L.V., 1955. Circular 969. In: Classification and use of irrigation waters. Washington, 19. DC: US Department of Agriculture.
- WWDR, 2015. Water for a sustainable world, data and figures [online]. The United Nations World Water Development Report 2015. Available from: http://www.unesco.org/new/fileadmin/MULTIMEDIA/HQ/SC/images/WWDR2015Facts_Figures_SPA_web.pdf [Accessed 15 January 2019].
- WWDR, 2017. The United Nations world water development report, 2017: wastewater: the untapped resource [online]. World Water Assessment Programme. Available from: https://unesdoc.unesco.org/ark:/48223/pf0000247153 [Accessed 15 January 2019].