
 ?Mathematical formulae have been encoded as MathML and are displayed in this HTML version using MathJax in order to improve their display. Uncheck the box to turn MathJax off. This feature requires Javascript. Click on a formula to zoom.
ABSTRACT
This study aims to analyse the effect of the Arctic Oscillation Index (AOI) on drought indices in northern Iraq. The Standardized Precipitation Evapotranspiration Index (SPEI) for 3-, 6- and 12-month time scales was calculated to determine the behaviour of the meteorological drought for the period 1983–2014. Average drought characteristics were found for three periods: 1983–1993, 1994–2004 and 2005–2014. The SPEI demonstrated similar patterns for the 3- and 6-month time scales in terms of the worst drought years for the first and second periods. The relationship between SPEI and AOI exhibited higher correlation in the 12-month time scale than in the 3- and 6-month time scales for all regions. In particular, the AOI had a more significant impact on SPEI 12-month time scale for Mosul and Duhok regions compared with the other regions.
Editor A. Castellarin Associate editor A. van Loon
1 Introduction
Drought is a natural phenomenon that affects the economic, social (human lives) and environmental aspects of a region. This phenomenon is often associated with lower than usual precipitation, often combined with high wind, high temperature or low moisture levels, all of which have been frequently experienced worldwide (Wilhite Citation2006). Research has revealed that temperature plays an important role in the severity and duration of droughts (Abramopoulos et al. Citation1988, Hu and Willson Citation2000, Rebetez et al. Citation2006). Northern Iraq is classified as a semi-arid area, with the region’s temperature data demonstrating an increasing trend in the most recent years (Mahmood Agha and Şarlak Citation2016). The temperature in this region thus plays an essential role in research on drought characteristics. The Standard Precipitation Evapotranspiration Index (SPEI) index, based on precipitation and potential evapotranspiration (PET), is used in this study.
Previous studies have been conducted on drought indices in different parts of the world, including the Middle Eastern countries. Ali et al. (Citation2019) evaluated the performance of the Locally Weighted Standardized Precipitation Index (LWSDI) with SPEI in the Pakistan region. Their analysis, which involved 10 stations, revealed that the correlation between LWSDI and SPEI is significantly high, except for one station. Merabti et al. (Citation2018) monitored and assessed drought characteristics in Northeast Algeria from 1979 to 2013 using the Standard Precipitation Index (SPI) and Reconnaissance Drought Index (RDI). They found that the two indices produce similar results for dry sub-humid climates. In addition, RDI detects high values of drought in arid zones due to the influence of PET. Li et al. (Citation2015) studied drought characteristics in Southwest China for the period 1982–2012 using SPEI. The results showed that the area was exposed to moderate and severe droughts after 2005, and droughts were aggravated during 2010–2012. Al-Qinna et al. (Citation2011) evaluated the severity, magnitude and spatial distribution of drought from 1970 to 2005 in the Hashemite Kingdom of Jordan. Their results showed that the three quantities increased over time and caused normal drought to become extreme drought, especially in the last decade. Morid et al. (Citation2006) used rainfall data to evaluate drought in Tehran, Iran. They utilized seven drought indices to analyse drought in the region for a period of 32 years. The results showed that SPI and the effective drought index exhibit the same performance in the detection of drought onset and consistent spatial and temporal variations. Numerous studies in neighbouring countries have suggested that low rainfall, high temperature and frequent drought can be attributed to climate change and global warming (Sönmez et al. Citation2005, Abbaspour et al. Citation2009, Zarghami et al. Citation2011, Sen et al. Citation2012, Shadeed Citation2013, Kelley et al. Citation2015).
Iraq is one of the regions of the Middle East most vulnerable to drought, although most studies there have been undertaken using the SPI only. Awchi and Kalyana (Citation2017) analysed meteorological drought based on SPI at different time scales (SPI-3, SPI-6, SPI-12 and SPI-24, i.e. 3-, 6-, 12-, and 24-month scales) in the period 1937–2010 by referring to nine meteorological stations in northern Iraq. Their results showed that severe drought events are extremely harmful to the western part of northern Iraq due to low annual rainfall rates. Awchi and Jasim (Citation2017) evaluated meteorological drought in Iraq using SPI-12 from 22 meteorological stations for the period 1970–2010 and discovered that the worst droughts occurred in several parts of the study area during 1997–2001 and 2007–2010. Al-Timimi and Al-Jiboori (Citation2013) evaluated the spatial and temporal variations of drought characteristics using SPI-3 for a 32-year period. They reported that the worst dry year was 2008. Rasheed (Citation2010) used 12-month SPI to analyse drought in northern Iraq for the period 1941–2002 and found that the percentage of wet and drought conditions reached 44% and 56% in all periods, respectively. Moreover, moderate wet and drought conditions were more common than other conditions. However, thus far, few studies using SPEI have been conducted in Iraq.
There have been many studies reviewing climate variability and global climate patterns. Vast areas (e.g. the Northern Hemisphere, NH) can be influenced by teleconnection patterns, which explain much of the variability and trends of climate at the regional scale (Iqbal et al. Citation2016). Several studies, such as those of Ghasemi and Khalili (Citation2008) in Iran, Türkes and Erlat (Citation2009) in Turkey, Syed et al. (Citation2010) in Central–Southwest Asia, Afzal et al. (Citation2013) in Pakistan, Panda and Kumar (Citation2014) in India, Almazroui et al. (Citation2015) in Saudi Arabia and Mahmood Agha and Şarlak (Citation2016) in Iraq, have investigated the relationship between climate and teleconnection patterns.
In this study, climate data recorded between 1983 and 2014 were obtained from nine meteorological stations in Iraq. The main purpose is to provide a detailed description of drought events in northern Iraq using SPEI. A drought analysis is insufficient to ensure a complete climatic understanding of the occurrence of droughts; hence, a characterization of the atmospheric circulation variability was performed in this work as a supplement. A second objective of this work is to investigate the impact of the Arctic Oscillation Index (AOI) on SPEI, which has not been done for this study region to the best of the authors’ knowledge.
2 Materials and methods
2.1 Study area and dataset
The study area is located in northern Iraq and shares a border with Turkey, Iran and Syria. It covers an area of 63 353 km2, at latitudes 35°–37°22′N and longitudes 41°55′–46°35′E (). Northern Iraq is surrounded by mountainous areas in the northeast that reach an altitude of 3611 m a.s.l.
Figure 1. Location of the study area and meteorological stations in northern Iraq
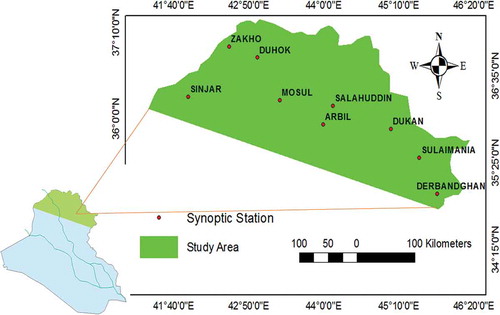
The temperature in the study area varies depending on the geographical location. Rain is very seasonal, starting in November and ending in April. Historical records of monthly precipitation and temperature for nine climate stations were acquired from the Iraqi Meteorological Organization and the Seismology and General Directorate of Agriculture in Kurdistan Region.
The AOI is the dominant mode of winter atmospheric low-frequency variability in the extra-tropical NH. The AOI represents the pressure difference between the Arctic and middle latitudes of the NH, as it considers the first empirical orthogonal function of NH winter sea-level pressure data. According to Thompson and Wallace (Citation1998), about 23% of the extended winter variance can be explained by the AOI. Recorded data of the AOI for the period 1983–2014 were acquired from the US National Oceanic and Atmospheric Administration website.Footnote1
2.2 Standardized Precipitation Evapotranspiration Index (SPEI)
Several indices have been used to detect and monitor droughts. Generally, drought indices are utilized to determine the onset, evolution and end of droughts. Drought in Iraq has received minimal attention (Mahmood Agha Citation2017). The SPEI, which is the main index used in this study, depends on rainfall and PET. Vicente-Serrano et al. (Citation2010) introduced SPEI at different time scales. In the computation of SPEI, firstly, water deficit D is identified for month i by the following equation:
where Pi is monthly precipitation and PETi is monthly potential evapotranspiration. In this study, the Thornthwaite method is used to estimate the PET, which depends solely on observed temperature data (Thornthwaite Citation1948).
Secondly, the probability density function of a three-parameter log-logistic distributed variable is calculated as follows (Vicente-Serrano et al. Citation2010):
where α, and
are the scale, shape and origin parameters, respectively, estimated with the L-moment method.
The L-moment procedure is the most robust and easy approach by which to obtain the parameters of the log-logistic distribution (Ahmad et al. Citation1988):
where is the gamma function of
, and w0, w1 and w2 are probability-weighted moments (PWMs).
The PWM method was applied based on the plotting-position approach (Hosking and Wallis Citation1997). The PWMs of order s are calculated as follows:
where Pi is a frequency estimator that can be obtained as follows (calculated using the approach of Hosking and Wallis):
where i is the range of observations arranged in increasing order and N is the number of data points.
The probability distribution function of D according to the log-logistic distribution is then obtained as follows:
Finally, the F(D) values are converted into standardized values to obtain SPEI (Abramowitz and Stegun Citation1965):
where C0 = 2.515517, C1 = 0.802853, C2 = 0.010328, d1 = 1.432788, d2 = 0.189269 and d3 = 0.001308.
Time scales play a crucial role in studying the severity and duration of droughts. The purpose of this research is related to the selection of appropriate time scales (Masud et al. Citation2015). In this study, the SPEI was calculated at 3-, 6- and 12-month time scales.
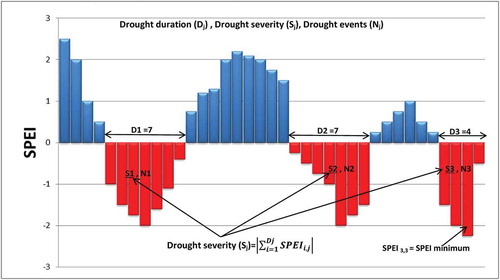
The threshold of drought events is zero, which means that drought occurs when the value of SPEI is lower than zero. Drought duration (D) is expressed in terms of the continuous sequence of SPEI values (i.e. the number of sequential months for SPEI values is smaller than the threshold value). The minimum number of consecutive values is already starting when two consecutive values are below the threshold. Drought severity (S) corresponds to the cumulative sum of all SPEI over the drought period (i.e. absolute sum of SPEI values during the event), the average of drought events over the study period is called the average severity of drought (Savg), and the drought event with the highest severity over the study period is called the maximum severity of drought (Smax) (Masud et al. Citation2015). The procedure for defining drought events and their characteristics is presented in .
Figure 2. Illustration of drought characteristics using the Standardized Precipitation Evapotranspiration Index (SPEI)
In this study, the spatial and temporal variabilities of the SPEI are calculated for three periods, i.e. the SPEI time series is divided into three equal parts – 1983–1993, 1994–2004 and 2005–2014 – to investigate the impact of period change on drought characteristics. The SPEI values for drought category classification are given in .
Table 1. Classification of drought by Standardized Precipitation Evapotranspiration Index (SPEI) values (McKee et al. Citation1993)
2.3 Evaluation strategy
The AOI is considered one of the most dominant large-scale fluctuations between the Arctic and the northern middle latitudes (He et al. Citation2017). The relationship between the monthly AOI and the monthly SPEI values for the three time scales from 1983 to 2014 was statistically tested using correlation coefficient to determine the impact of the large-scale atmospheric pattern on drought or wet conditions in northern Iraq. The Pearson correlation coefficient (r) was applied to check the nature and magnitude of relationships between SPEI and the corresponding AOI. The statistical significance of the correlation coefficients was tested using the Student’s t-test (Türkeş and Erlat Citation2008).
The Welch t-test or (unequal variances t-test) is used when two independent groups are involved in the analysis. This procedure is applied to compare the means of comparison two groups. In cases where the two samples have unequal variances, Welch’s t-test is more reliable. In this study, Welch’s t-test was performed to detect the presence of variations in the duration and severity of drought for the three periods (1983–1993, 1994–2004, 2005–2014). The t statistic can be obtained using EquationEquation (12)(12)
(12) Welch (Citation1947):
where Nj is the sample size in group j (j =1, 2, 3) and is the sample mean in group j. The degrees of freedom (v) associated with this variance estimate can be calculated as follows:
where are the degrees of freedom associated with the first and second variance estimates, respectively.
3 Results
3.1 Characteristics of drought
The number of events, average severity and duration of drought for the 3-, 6- and 12- month SPEI are presented in . The average severity of drought (Savg) for the 3-month SPEI ranged between 3.3 and 4.3, with the highest value from Dukan station (Savg = 4.3). The longest duration of drought (Davg = 5.7) was also obtained for this station. The SPEI-6 of Zakho station, which is located in the northern region of the study area, exhibited a greater magnitude of drought than the other stations. The highest value of SPEI during the study period was given by Mosul station. The highest Savg and Davg in the 12-month SPEI were consistent with those in the 3-month SPEI. Salahaddin region is exposed to the highest number of events (N) in the study area for 3-, 12-month SPEI. The number of events (N) for the 12-month SPEI ranged between 10 and 17.
Table 2. Number of events (N), average drought severity (Savg) and average drought duration (Davg) for 3-, 6- and 12-month Standardized Precipitation Evapotranspiration Index (SPEI-3, SPEI-6 and SPEI-12, respectively) for the period 1983–2014 in the study area
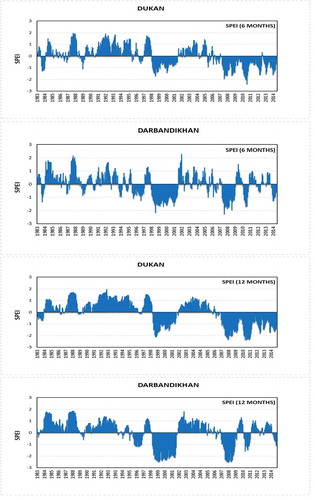
In general, the maximum drought severity (Smax) for the 3-, 6-, and 12-month time scales at most of the stations was observed in the period 1998–2012. The highest Smax was obtained in Dukan and Darbandikhan, where drought began, respectively, in 2007 and 1998 and ended in 2012 and 2001, for the 6- and 12-month time scales. shows the time series of 6- and 12-month SPEI for Dukan and Darbandikhan stations.
Figure 3. Time series of 6- and 12-month Standardized Precipitation Evapotranspiration Index (SPEI-6 and SPEI-12) for Dukan and Darbandikhan stations
The minimum SPEI (SPEImin), Savg and Davg for 3-, 6- and 12-month SPEI were computed for the periods 1983–1993, 1994–2004 and 2005–2014 (). For the SPEI-3, the minimum SPEI in the third, more recent period was higher than those in the earlier periods for all stations. Maximum values of Savg and Davg were detected in the second period in Darbandikhan, Sulaimania and Salahaddin stations, whereas the remaining six stations exhibited the maximum Savg and Davg in the third period. The minimum value of SPEI-6 ranged between −2.07 and −2.51, indicating that for most of the stations the highest absolute value of SPEI was detected in the third period. In terms of Savg and Davg, six of the nine stations displayed a high value in the third period. Amongst all stations, Darbandikhan was exposed to the strongest and longest drought in the second period (Savg = 13 and Davg = 13.33). With regard to 12-month SPEI, the highest absolute values (−2.35 to −2.97) were observed during the third period for all stations, except Sulaimania and Zakho.
Table 3. Values of minimum SPEI (SPEImin), average drought severity (Savg) and average drought duration (Davg) for 3-, 6-, 12-month Standardized Precipitation Evapotranspiration Index (SPEI-3, SPEI-6 and SPEI-12) for the three study periods
The Savg and Davg values varied with the change in period. Welch’s t-test was used to analyse the differences amongst the periods (). Applying Welch’s t-test between the first and second periods, and the first and third periods, showed that all calculated P values for Savg and Davg are less than 0.05, indicating that statistically significant differences exist amongst them. These differences were also found in the rainfall reduction and temperature increase in the second and third periods (Mahmood Agha and Şarlak Citation2016). In contrast, the differences between the second and third periods are not statistically significant. The Welch’s t-test results for Savg are consistent with those of Davg for the three time scales.
Table 4. Comparison of P values for average drought severity (Savg) and average drought duration (Davg) for 3-, 6-, 12-month Standardized Precipitation Evapotranspiration Index (SPEI-3, SPEI-6 and SPEI-12) between the first (1983–1993), second (1994–2004) and third (2005–2014) periods studied
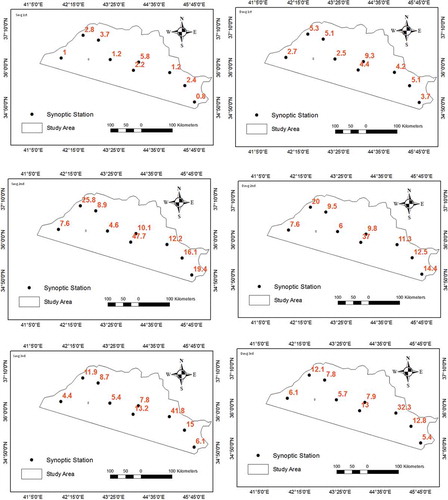
The Savg and Davg results were mapped spatially for the three periods, as presented in . As indicated by the 3-month SPEI, the spatial distributions of Savg and Davg for the first period (1983–1993) demonstrate an increasing trend from the southern part of the study area to the northern part. The maps for the second period (1994–2004) show that the Sulaimania and Drerbandghan regions are more exposed to droughts with the highest magnitudes amongst all regions, whereas the map for the third period (2005–2014) displays the opposite pattern. According to the 6-month SPEI, the trend of Savg and Davg maps is similar to that of the 3-month SPEI and respectively range within 1.15–13 and 2.7–13.3. In addition, the highest values of Savg and Davg for the third period were observed in the southern part of the study area and decreased towards the northern part. The behaviour of the maps for the second and third periods according to the 12-month SPEI is identical to that for the two previous time scales. However, the first period shows an opposite pattern (). shows that the western region had lower values of Savg compared with the other regions for all periods; the values ranged from 0.8 to 47.7. The spatial distributions of Davg exhibited a rising trend from the northern parts to the southern and south-eastern parts of the study area for the second and third periods.
Figure 4. Average drought severity (Savg) and average drought duration (Davg) for 3-month Standardized Precipitation Evapotranspiration Index (SPEI-3) for the periods 1983–1993 (top), 1994–2004 (middle) and 2005–2014 (bottom)
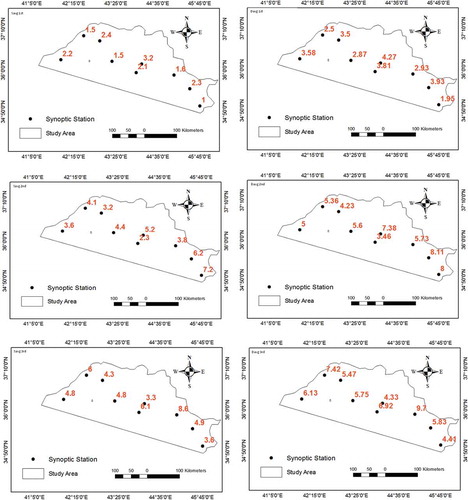
Figure 5. Average drought severity (Savg) and average drought duration (Davg) for 6-month Standardized Precipitation Evapotranspiration Index (SPEI-6) for the periods 1983–1993 (top), 1994–2004 (middle) and 2005–2014 (bottom)
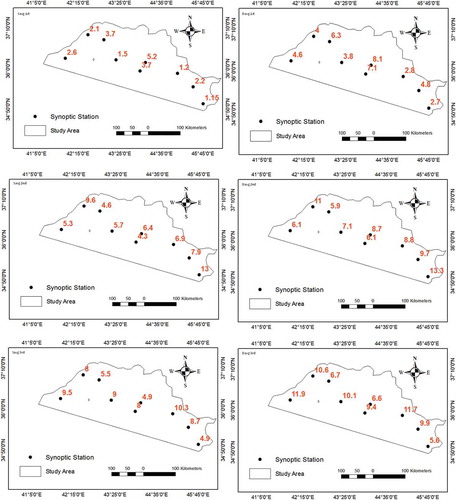
Figure 6. Average drought severity (Savg) and average drought duration (Davg) for 12-month Standardized Precipitation Evapotranspiration Index (SPEI-12) for the periods 1983–1993 (top), 1994–2004 (middle) and 2005–2014 (bottom)
3.2 Analysis of correlation between AOI and SPEI
present the results of the correlation analyses between the AOI and SPEI indices for 3-, 6- and 12-month time scales from January to December. The results show that the majority of the correlations in January, February, April, May and October were negative and ranged from 67% to 100% for all stations. In contrast, positive correlations were obtained between AOI and SPEI in all time scales for the remaining months.
Table 5. Correlation (correlation coefficient, r) between the monthly Atlantic Oscillation Index (AOI) and 3-month Standardized Precipitation Evapotranspiration Index (SPEI-3) for the stations studied. Bold formatting indicates that the r is statistically significant at the 95% confidence level
Table 6. Correlation (correlation coefficient, r) between the monthly Atlantic Oscillation Index (AOI) and 6-month Standardized Precipitation Evapotranspiration Index (SPEI-6) for the stations studied. Bold formatting indicates that the r is statistically significant at the 95% confidence level
Table 7. Correlation (correlation coefficient, r) between the monthly Atlantic Oscillation Index (AOI) and 12-month Standardized Precipitation Evapotranspiration Index (SPEI-12) for the stations studied. Bold formatting indicates that the r is statistically significant at the 95% confidence level
Moreover, the correlations between the AOI and SPEI at all three time scales in January, February, March, July, October and December were statistically insignificant at the 5% significance level for all but three stations. Positive correlations were determined for August in Sulaimania, Duhok and Dukan, and for November in Arbil, Salahaddin and Mosul.
According to the SPEI obtained for the 3-month time scale, the correlations between the monthly SPEI and the corresponding AOI were significantly negative in five and three stations in November and August, respectively. The correlations between monthly SPEI and the AOI in Darbandikhan and Sulaimania stations in January and in Dukan in May were significantly negative (). The strongest negative (−0.46) and positive (0.47) correlations were determined in Arbil station in August and September, respectively.
Negative correlations between SPEI for the 12-month time scale and the corresponding AOI were obtained in five, three, and two stations during April, May and September, respectively. Of the nine stations, four exhibited positive correlations between SPEI and AO in November. The strongest positive (0.39) and negative (–0.51) correlations were obtained in Sulaimania and Duhok stations, respectively. The correlation coefficient indicated that 26% of the variance in SPEI for the 12-month time scale during December (April) can be attributed to AO.
4 Discussion
The analysis of drought and its relationship with teleconnection patterns is of great importance in the field of climate change. The relationship between the Arctic oscillation and drought for the Iraq region has not previously been studied. Therefore, this paper investigated the drought characteristics using SPEI and the relationships between monthly SPEI and the corresponding AOI in northern Iraq for the period 1983–2014.
Our results show that the Dukan region was exposed to the strongest drought in the 3- and 12-month time scales, and the Zakho region experienced the worst drought in the 6-month time scale in the period 1983–2014. These results are consistent with a study by Awchi and Jasim (2017), who found, using the SPI index, that the largest accumulated rainfall deficit was in Dukan region. The results show Dukan to have been exposed to the highest level of maximum drought severity, Smax. This may be explained by the possibility that drought severity is associated with the variability of rainfall. When an area is exposed to drought, its impact is greater at stations that have higher amounts of rainfall. Therefore, the drought impact on Dukan compared to the other stations is greater due to the higher rainfall it has experienced. The second possibility is that Dukan station is affected by other factors that may have a significant impact, such as desertification, global warming, population growth or rapid urbanization.
Based on the SPEI-3 values, the highest percentage of drought months for the total period of study is detected at Sulaymaniyah (53%), while a value of 50% of drought months was the highest percentage observed for Duhok using SPI-3 (Yenigun and Ibrahim Citation2019). The reason for this difference is that SPI depends on precipitation only, whereas the SPEI depends on precipitation and evapotranspiration.
Based on the SPEI-12, the second period experienced the strongest and longest drought amongst all periods for most of the sites (seven out of nine). These findings are inconsistent with those obtained from the Savg and Davg of SPEI in the 3- and 6-month time scales, which explains that the impact of evapotranspiration was more evident at the 12-month time scale than at the other scales. Overall, this study found that the worst drought in the study region occurred in the third period, followed by the second period, which is in agreement with the findings of the Intergovernmental Panel on Climate Change (IPCC Citation2007) which indicated that global surface temperature (since 1850) had changed markedly by 1995. Our findings reveal that there are differences in the spatial distribution of the severity of drought with time, and the reason for this is the desertification progress that is tending towards northern Iraq, as well as the ‘greenhouse effect’ (Şarlak and Mahmood Agha Citation2018).
The results of the AOI forcing suggest that the most influential months were April and November, and this corresponds to the results of previous studies in neighbouring regions, such as Iran and Turkey. For example, (Vazifehkhah and Kahya Citation2018) concluded that the corresponding AOI is significantly correlated with drought in winter, followed by drought in spring. Further, Tabari et al. (Citation2014) found a poor correlation between the AOI and winter evapotranspiration in northwest Iran, which is in good agreement with the results obtained for the Dukan station.
Generally, the results of the correlation analysis were positive in some months and negative in others. This is in agreement with the results of previous studies, such as those of Ghasemi and Khalili (Citation2006) and Tabari et al. (Citation2014) in Iran and Turkes and Erlat (Citation2008) and Vazifehkhah and Kahya (Citation2018) in Turkey. Turkes and Erlat (Citation2008) found that the relationship between January–February temperature over Turkey and the corresponding AOI was significantly negative for most parts of Turkey. This study, however, found that there is no significant relationship between January–February SPEI at different time scales and the AOI. The reason for this is the dependency of SPEI on precipitation and evapotranspiration.
The values of SPEI-3 and SPEI-6 have larger variability frequencies; therefore, they produced a shorter cycle. While the SPEI-12 was more stable, it was able to more clearly reflect the long-term characteristics of drought fluctuation, which is in agreement with those found by Wang et al. (Citation2016). This explains why the relationship between SPEI and AOI exhibited higher correlation at the 12-month time scale of SPEI than at the 3-month time scale.
5 Conclusions
Authors wish to express their thanks to the College of engineering, University of Mosul for supporting the current study.In this paper, we analysed the drought characteristics in northern Iraq using the climate data of nine meteorological stations from the period 1983–2014. The SPEIs for the 3-, 6- and 12-month time scales were computed based on precipitation and PET. In general, the results show that the average severity and duration of drought for all periods increase with the increase in time scale of SPEI.
Three periods were compared at the three time scales. According to the results of the 3- and 6-month SPEI, the worst droughts were experienced by the entire study area during the third period (2005–2014), followed by the second period (1994–2004). The highest values of Savg and Davg were obtained in the second period because this period has relatively low rainfall and high evapotranspiration. The Arbil and Dukan regions experienced the highest degree of drought during the second period, whereas the Sulamania and Derbandghan regions experienced the worst during the third period.
Spatial distribution indicated that the southern region was exposed to the worst drought during the third and second periods compared with the other regions, while the northern region experienced the strongest and longest drought during the first period. Consequently, we can state that the study area may be affected by other factors, such as atmospheric circulation, the heat island effect, desertification and the greenhouse effect.
Our results show that the AOI influences the drought index in several months. Approximately 22% and 21% of the variance in the 6-month SPEI during August and September, respectively, can be attributed to the AOI. Moreover, 26% of the variance in the 12-month SPEI during April is influenced by the AOI. The AOI exerts a considerable effect on the drought index for Mosul and Duhok stations, in which significant correlations were obtained in six and four months of the year, respectively.
Finally, the results obtained give us an indication of the behaviour of meteorological drought as well as the effects of AOI on drought over the study area. These results may be important for future studies, especially since studies of this type are lacking in the surrounding regions.
Acknowledgements
Authors wish to express their thanks to the College of engineering, University of Mosul for supporting the current study.
Disclosure statement
No potential conflict of interest was reported by the authors.
Notes
References
- Abbaspour, K.C., et al., 2009. Assessing the impact of climate change on water resources in Iran. Water Resources Research, 45 (10). doi:10.1029/2008WR007615
- Abramopoulos, F., Rosenzweig, C., and Choudhury, B., 1988. Improved ground hydrology calculations for global climate models (GCMs): soil water movement and evapotranspiration. Journal of Climate, 1 (9), 921–941. doi:10.1175/1520-0442(1988)001<0921:IGHCFG>2.0.CO;2
- Abramowitz, M. and Stegun, I.A., 1965. Handbook of mathematical functions. New York, NY: Dover Publications.
- Afzal, M., et al., 2013. Influence of North Atlantic Oscillations and Southern Oscillations on winter precipitation of Northern Pakistan. Pakistan Journal of Meteorology, 9 (18), 1–8.
- Ahmad, M.I., Sinclair, C.D., and Werrity, A., 1988. Log-logistic flood frequency analysis. Journal of Hydrology, 98 (3–4), 205–224. doi:10.1016/0022-1694(88)90015-7
- Ali, Z., Hussain, I., and Faisal, M., 2019. Annual characterization of regional hydrological drought using auxiliary information under global warming scenario. Natural Hazards Earth System Sciences Discussions. doi:10.5194/nhess-2018-373
- Almazroui, M., et al., 2015. Atmospheric circulation patterns in the Arab region and its relationships with Saudi Arabian surface climate: a preliminary assessment. Atmospheric Research, 161–162, 36–51. doi:10.1016/j.atmosres.2015.03.014
- Al-Qinna, M.I., et al., 2011. Drought analysis in Jordan under current and future climates. Climatic Change, 106 (3), 421–440. doi:10.1007/s10584-010-9954-y
- Al-Timimi, Y.K. and Al-Jiboori, M.H., 2013. Assessment of spatial and temporal drought in Iraq during the period 1980–2010. International Journal of Energy and Environment, 4 (2), 291–302.
- Awchi, T.A. and Kalyana, M.M., 2017. Meteorological drought analysis in northern Iraq using SPI and GIS. Sustainable Water Resources Management, 3 (4), 451–463. doi:10.1007/s40899-017-0111-x
- Awchi., T.A. and Jasim, A.I., 2017. Rainfall data analysis and study of meteorological draught in Iraq for the period 1970–2010. Tikrit Journal of Engineering Sciences, 24 (1), 110–121. doi:10.25130/tjes.24.1.2017.12
- Ghasemi, A.R. and Khalili, D., 2006. The influence of the Arctic Oscillation on winter temperatures in Iran. Theoretical and Applied Climatology, 85 (3–4), 149e164. doi:10.1007/s00704-005-0186-4
- Ghasemi, A.R. and Khalili, D., 2008. The effect of the North Sea-Caspian pattern (NCP) on winter temperatures in Iran. Theoretical and Applied Climatology, 92 (1–2), 59–74. doi:1007/s00704-007-0309-1
- He, S., et al., 2017. Impact of Arctic Oscillation on the East Asian climate: a review. Earth-Science Reviews, 164, 48–62. doi:10.1016/j.earscirev.2016.10.014
- Hosking, J.R.M. and Wallis, J.R., 1997. Regional frequency analysis: an approach based L-moments. Cambridge, UK: Cambridge University Press.
- Hu, Q. and Willson., G.D., 2000. Effects of temperature anomalies on the palmer drought severity index in the central United States. International Journal of Climatology, 20 (15), 1899–1911. doi:10.1002/1097-0088(200012)20:15<1899::AID-JOC588>3.0.CO;2-M
- IPCC (Intergovernmental Panel on Climate Change), 2007. Climate change 2007: synthesis report. Geneva, Switzerland: Intergovernmental Panel on Climate Change.
- Iqbal, M.A., et al., 2016. Analysis of recent changes in maximum and minimum temperatures in Pakistan. Atmospheric Research, 168, 234–249. doi:10.1016/j.atmosres.2015.09.016
- Kelley, C.P., et al., 2015. Climate change in the Fertile Crescent and implications of the recent Syrian drought. Proceedings of the National Academy of Sciences, 112 (11), 3241–3246. doi:10.1073/pnas.1421533112
- Li, X., et al., 2015. Use of the standardized precipitation evapotranspiration index (SPEI) to characterize the drying trend in southwest China from 1982–2012. Remote Sensing, 7 (8), 10917–10937. doi:10.3390/rs70810917
- Mahmood Agha, O.M.A., 2017. Climate trends and behavior of drought indices: case study of Iraq. Thesis (PhD). Gaziantep University.
- Mahmood Agha, O.M.M., and Şarlak, N., 2016. Spatial and temporal patterns of climate variables in Iraq. Arabian Journal of Geosciences, 9 (4), 302. doi:10.1007/s12517-016-2324-y
- Masud, M.B., Khaliq, M.N., and Wheater, H.S., 2015. Analysis of meteorological droughts for the Saskatchewan River Basin using univariate and bivariate approaches. Journal of Hydrology, 522, 452–466. doi:10.1016/j.jhydrol.2014.12.058
- McKee, T.B., Doesken, N.J., and Kleist, J., 1993. The relationship of drought frequency and duration of timescales. In: Eighth conference on applied climatology. Anaheim CA: American Meteorological Society. 179–186.
- Merabti, A., et al., 2018. Comparing SPI and RDI applied at local scale as influenced by climate. Water Resources Management, 32 (3), 1071–1085. doi:10.1007/s11269-017-1855-7
- Morid, S., Smakhtin, S., and Moghaddasi, M., 2006. Comparison of seven meteorological indices for drought monitoring in Iran. International Journal of Climatology, 26 (7), 971e985. doi:10.1002/joc.1264
- Panda, D.K. and Kumar, A., 2014. The changing characteristics of monsoon rainfall in India during 1971–2005 and links with large scale circulation. International Journal of Climatology, 34 (15), 3881–3899. doi:10.1002/joc.3948
- Rasheed, A.M.M., 2010. Analysis of rainfall drought periods in the North of Iraq using standard precipitation index (SPI). AL-Rafdain Engineering Journal (AREJ), 18 (2), 60–72. doi:10.33899/rengj.2010.28187
- Rebetez, M., et al., 2006. Heat and drought 2003 in Europe: a climate synthesis. Annals of Forest Science, 63 (6), 569–577. doi:10.1051/forest:2006043
- Şarlak, N. and Mahmood Agha, O.M., 2018. Spatial and temporal variations of aridity indices in Iraq. Theoretical and Applied Climatology, 133 (1–2), 89–99. doi:10.1007/s00704-017-2163-0
- Sen, B., et al., 2012. Projecting climate change, drought conditions and crop productivity in Turkey. Climate Research, 52, 175–191. doi:10.3354/cr01074
- Shadeed, S., 2013. Spatio-temporal drought analysis in arid and semi-arid regions: a case study from palestine. Arabian Journal for Science and Engineering, 38 (9), 2303–2313. doi:10.1007/s13369-012-0504-y
- Sönmez, F.K., et al., 2005. An analysis of spatial and temporal dimension of drought vulnerability in Turkey using the standardized precipitation index. Natural Hazards, 35 (2), 243–264. doi:10.1007/s11069-004-5704-7
- Syed, F.S., et al., 2010. Regional climate model simulation of winter climate over Central–Southwest Asia, with emphasis on NAO and ENSO effects. International Journal of Climatology, 30, 220–235. doi:10.1002/joc.1887
- Tabari, H., Talaee, P.H., and Willems, P., 2014. Links between Arctic Oscillation (AO) and inter-annual variability of Iranian evapotranspiration. Quaternary International, 345, 148–157. doi:10.1016/j.quaint.2014.02.011
- Thompson, D.W. and Wallace, J.M., 1998. The Arctic Oscillation signature in the wintertime geopotential height and temperature fields. Geophysical Research Letters, 25 (9), 1297–1300. doi:10.1029/98GL00950
- Thornthwaite, C.W., 1948. An approach towards rational classification of climate. Geographical Review, 38 (1), 55–64. doi:10.2307/210739
- Türkeş, M. and Erlat, E., 2008. Influence of the Arctic Oscillation on the variability of winter mean temperatures in Turkey. Theoretical and Applied Climatology, 92 (1–2), 75–85.
- Turkes, M. and Erlat, E., 2008. Influence of the Arctic Oscillation on the variability of winter mean temperatures in Turkey. Theoretical and Applied Climatology, 92 (1–2), 75e85.
- Türkes, M. and Erlat, E., 2009. Winter mean temperature variability in Turkey associated with the North Atlantic Oscillation. Meteorology and Atmospheric Physics, 105 (3–4), 211–225. doi:10.1007/s00703-009-0046-3
- Vazifehkhah, S. and Kahya, E., 2018. Hydrological drought associations with extreme phases of the North Atlantic and Arctic Oscillations over Turkey and northern Iran. International Journal of Climatology, 38 (12), 4459–4475. doi:10.1002/joc.5680
- Vicente-Serrano, S.M., Beguería, S., and López-Moreno, J.I., 2010. A multiscalar drought index sensitive to global warming: the standardized precipitation evapotranspiration index. Journal of Climate, 23 (7), 1696–1718. doi:10.1175/2009JCLI2909.1
- Wang, Y., et al., 2016. Estimation of variability characteristics of regional drought during 1964–2013 in Horqin Sandy Land, China. Water, 8 (11), 543. doi:10.3390/w8110543
- Welch, B.L., 1947. The generalization of “Student’s” problem when several different population variances are involved. Biometrika, 34 (1–2), 28–35. doi:10.1093/biomet/34.1-2.28
- Wilhite, D.A., 2006. Drought monitoring and early warning: concepts, progress and future challenges. Geneva, Switzerland: World Meteorological Organization, WMO 1006.
- Yenigun, K. and Ibrahim, W.A., 2019. Investigation of drought in the northern Iraq region. Meteorological Applications, 26 (3), 490–499.
- Zarghami, M., et al., 2011. Impacts of climate change on runoffs in East Azerbaijan, Iran. Global and Planetary Change, 78 (3–4), 137–146. doi:10.1016/j.gloplacha.2011.06.003