
 ?Mathematical formulae have been encoded as MathML and are displayed in this HTML version using MathJax in order to improve their display. Uncheck the box to turn MathJax off. This feature requires Javascript. Click on a formula to zoom.
ABSTRACT
The farmers in the Bow River Basin (BRB), Canada, have adopted water conservation strategies to reduce water needs. This reduction, however, encouraged the expansion of irrigation, which may rebound agricultural water demands. This paradox requires an understanding of human adaptation to drought by mapping individual farmers’ water conservation decisions to the dynamics of the basin-wide water demand. We develop an agent-based agricultural water demand (ABAD) model, simulating farmers’ behavior in adopting new on-farm irrigation systems and/or changing crop patterns in response to drought conditions in the BRB. ABAD demonstrates (1) how farmers’ attitude toward profits, risk aversion, environmental protection, social interaction, and irrigation expansion explains the dynamics of the water demand and (2) how the conservation program may paradoxically lead to the rebound phenomenon. ABAD, subject to its conceptualization limitations, can be used for exploration and scenario analysis of future agricultural water demand in response to water conservation programs in the BRB.
Editor S. Archfield Associate editor S. Pande
1 Introduction
As extreme events, such as drought, have become increasingly widespread, human behaviors have evolved, impacting both water supply and demand (Sivapalan and Blöschl Citation2015, Gonzales and Ajami Citation2017). Policymakers have managed water demand in many regions for adaptation to drought. Water demand in many urban areas has decreased due to drought-related actions (Quesnel and Ajami Citation2017, Booysen et al. Citation2019). In the same way, farmers have adapted to drought using several strategies, including water-saving technologies and changing crop patterns, to reduce agricultural water demand. However, this reduction can result in farmers’ motivation to expand the irrigation area, which might result in rebounding agricultural water demand as an emergent phenomenon. Such rebound phenomena have been observed in Spain and China (Berbel and Mateos Citation2014; Song et al. Citation2018). Farmers have carried out these water conservation activities for several socio-economic reasons, including conservation purposes, maximizing profits, risk aversion, environmental protection, and social influence (Nowak Citation1992, Wheaton et al. Citation2005, Hoag et al. Citation2012). These socio-economic factors change over time (Elshafei et al. Citation2014, Liu et al. Citation2014, Garcia et al. Citation2016, Roobavannan et al. Citation2018) through feedback loops between hydrological and human systems, leading to considerable complexity for water management modeling (Razavi et al. Citation2020). The co-evolutionary dynamics between hydrological and human systems have been recently investigated using socio-hydrological models, highlighting the role of humans in human and natural systems. The socio-hydrological models can provide a better understanding of complex phenomena in agricultural water demand due to evolving farmers’ behavior (Van Emmerik et al. Citation2014), thereby enabling policymakers to enhance long-term water planning.
The socio-hydrological models have increasingly focused on an interaction between human and hydrological systems (Sivapalan et al. Citation2012, Pande and Sivapalan Citation2017, Roobavannan et al. Citation2018). Studies have investigated the endogeneity of humans within water systems in several ways: by incorporating socio-economic drivers (Giacomoni et al. Citation2013, Elshafei et al. Citation2014, Veena Srinivasan Citation2015), or employing concepts such as social memory (Di Baldassarre et al. Citation2013, Gonzales and Ajami Citation2017) and collective behaviors (Garcia et al. Citation2016, Du et al. Citation2017). In contrast to these studies that account for the two-way interactions of water and humans, other studies have investigated only cause-and-effect mechanisms between hydrological and human systems (Yoshikawa et al. Citation2014, Zhang et al. Citation2014, Quesnel and Ajami Citation2017, Roby et al. Citation2018).
Many socio-hydrological studies have focused on agricultural water systems (Becu et al. Citation2003, Berger and Troost Citation2014, Kandasamy et al. Citation2014, Pande and Savenije Citation2016). However, investigating the dynamics of agricultural water demand in response to drought conditions through socio-hydrological modeling remains elusive. To model agricultural water demand, the traditional models consider the effects of water conservation policies (e.g. changing crop patterns and water-saving technologies) through different scenarios (Tubiello and Fischer Citation2007, Hejazi et al. Citation2014). However, these traditional models cannot explain the complexity of co-evolving human–hydrological systems, because the scenarios are considered explicitly in modeling (Sivapalan et al. Citation2012b); i.e. they are an exogenous set of variables that are not dynamically updated based on feedback from the human interaction with the water system. Therefore, to capture the complexity of co-evolving human-hydrological systems, agricultural water demand modeling needs to be simulated through socio-hydrological modeling.
System dynamics and Agent-Based Models (ABMs) have attracted attention as tools for developing socio-hydrological models that account for the feedback loops between human and hydrological systems (An Citation2012, Di Baldassarre et al. Citation2013, Berglund Citation2015; Garcia et al. Citation2016, Gonzales and Ajami Citation2017). System dynamics as a top-down approach is used when there is comprehensive knowledge about the entire system and its governing equations. Using this knowledge, researchers attempt to replicate the system structure by modeling system behavior. On the other hand, agent-based modeling, as a bottom-up approach, starts a simulation at the level of an autonomous entity, an agent, which might be a member of a heterogeneous group. By simulating all agents and their possible interaction, researchers attempt to explore possible emergent behaviors and system pathways. Therefore, to account for both heterogeneity and possible interactions in a complex socio-hydrological system, we use agent-based modeling in this study.
A considerable amount of literature has been published on the application of ABMs in agricultural systems (Groeneveld et al. Citation2017, Kremmydas et al. Citation2018). Conventional agent-based models have been built based upon optimization (maximization of benefits; e.g. Schreinemachers and Berger Citation2006, Citation2011, Ng et al. Citation2011), heuristics (decisions only based on past experience; e.g. Kerridge et al. Citation2001, Barreteau et al. Citation2004), or surveys (e.g. Dia Citation2002, Castella et al. Citation2005) in support of decision-making in a range of contexts including farming (Kremmydas et al. Citation2018). However, many researchers have argued that these principles are based on simplified rules or rational behavior (Jager et al. Citation2000, Parker et al. Citation2003, Wilensky and Rand Citation2015). For example, the “rational choice” theory has been frequently used to explain human decision-making about natural resources, including hydro-economy, as it is simple and straightforward to translate into mathematical equations (Schlüter et al. Citation2017, Kremmydas et al. Citation2018). However, this theory is based on idealized assumptions that are inconsistent with empirical evidence of human decision-making (Siebenhüner Citation2000, Van Den Bergh et al. Citation2000, Hukkinen Citation2014, Levine et al. Citation2015). Using an agent-based model, Wens et al. (Citation2020) indicated that the theory of “rational choice” underestimates farmers’ profits compared to historical data in response to drought conditions; thus, farmers’ adaptation to drought cannot be explained by economic factors alone. The authors noticed that human adaptation to drought can be better explained by the theory of bounded rationality. In this study, we use the theory of bounded rationality to address the shortcomings of the “rational choice” theory. This theory implies that humans make decisions with limited rationality; therefore, they look for satisficing solutions rather than optimal ones. In this regard, agent-based modeling enables us to make great use of such social theories as this approach starts simulations at the level of an individual agent.
This study builds on the methodology previously developed by Dziubanski (Citation2018) and Dziubanski et al. (Citation2019), and applies it in the context of droughts. Dziubanski (Citation2018) and Dziubanski et al. (Citation2019) built an ABM model to simulate flooding in which the “city agent” subsidizes “farmer agents” to convert their irrigated land to conservation in Iowa, USA. These farmer agents decide to switch to conservation based on factors relating to profits, past land use, and willingness. Using different scenarios, Dziubanski (Citation2018) and Dziubanski et al. (Citation2019) showed how flooding could be controlled while human responses co-evolve as a result of changing hydrological conditions. This study modifies and adapts that study to investigate the rebound phenomenon in agriculture in the drought context as a significant gap in socio-hydrology. Many of the previously developed socio-hydrological models are “stylized” in that they lack necessary analyses for credible model development, such as calibration, validation, parameter uncertainty, and sensitivity analysis. Therefore, our study intends to contribute to this area.
In this study, we look at the change in cropping patterns, irrigation systems, and their effects on agricultural water demand in the Bow River Basin (BRB), located in Alberta, Canada, as it has experienced drought in recent years. The objective of this paper is to better understand the complexity of a socio-hydrological system in terms of farmers’ adaptation to drought under water-saving technologies and changing crop patterns. To fulfill this purpose, we develop an agent-based model for simulating individual farmers, as agents, and their interactions in their community.
2 History of drought and drought policies in Alberta – case study
BRB, one of the important sub-basins of the South Saskatchewan River, Canada, accounts for 43% of the river’s 9.5 billion cubic meters of average annual flow (Bow River Basin Council Citation2010). This river basin’s major water users are agricultural districts, the city of Calgary, industries, and hydropower. The hydrological system of BRB is made up of three main parts: mountains, foothills, and prairies (see Fig. S1 in the Supplementary material). The main water sources are snowmelt (contribution of 80% to the annual streamflow), rain, groundwater, and glacial melt (Turner et al. Citation2005), with the annual precipitation of 412 millimeters in Calgary (78% of this precipitation is rain) (Bow River Basin Council Citation2010). With the full allocation of this limited water supply, the BRB authority has not accepted new applications for water allocations since 2006 (Alberta Queen’s Printer Citation2000).
The province of Alberta, including BRB, has been impacted several times by considerable droughts in the past nine decades (). The Alberta drought in the 1930s, which caused the decade to be known as the “Dirty Thirties,” was very severe, resulting in severe impacts on Alberta’s crops and in considerable emigration (Alberta Environment and Parks Citation2017). Starting in 1979, another series of droughts, as severe as the 1930s drought, devastated parts of Alberta: 1984 marked the driest year since 1916 (Alberta Environment and Parks Citation2017), and the 2001–2002 drought caused Can$5.8 billion in damage and 41 000 job losses in agriculture (CBC News Citation2009). Alberta experienced a severe drought in 2009–2010 that caused an emergency situation in 10 counties of central Alberta, when they suffered from the lowest precipitation in 50 years (Alberta Environment and Parks Citation2017). Alberta recently experienced other droughts, in 2015 and 2017 (“Citation2017 Annual Report of Agroclimate Conditions Across Canada – Agriculture and Agri-Food Canada (AAFC),” 2017; King Citation2015).
Figure 1. Timeline of droughts in Alberta and the related political actions
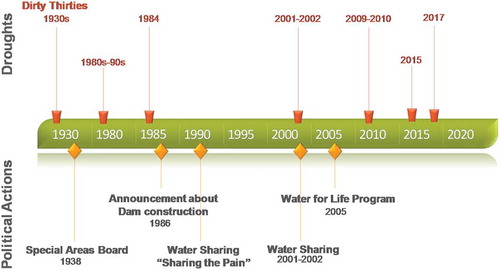
As a result of these droughts, both the government and local people adapted their behavior to address the drought situations (), impacting water demand in industrial, urban, and agricultural sectors. In the 1930s, the government of Alberta created the Special Areas Board to govern the areas affected by the drought (Drought in 20th Century Alberta Citation2018). Because of the decreased water supply caused by the droughts of the 1980s and 1990s, major water users in the BRB decided to share the available water under the idea of “sharing the pain,” although they could have used their water licenses based on the priority systems under the Water Resource Act (Amec Citation2009). In addition to this water sharing, the government of Alberta announced the construction of the Oldman River Dam in 1986 (Drought in 20th Century Alberta Citation2018), and water sharing also arose in the basin during the 2001–2002 drought (Nicol and Klein Citation2006, Amec Citation2009). Because of water shortage in 2001–2002, it was determined that the water storage only supported the water license holders with priorities before 1950, resulting in the suspension of water diversions for the remaining water license holders. The water users in the Oldman River basin finally decided to share the available water and the economic consequences. The experience of the drought in the 1980s and 2001 indicated that “the well-being of water users in the region as-a-whole takes precedence over individual prosperity” (Amec Citation2009).
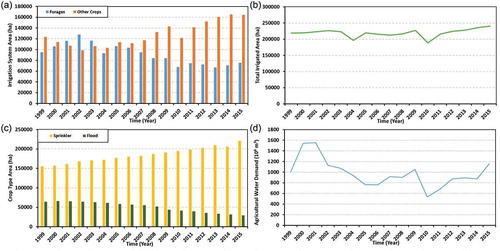
To achieve water security objectives, the government of Alberta announced the Water for Life Program in 2005 (Alberta Irrigation Projects Association (AIPA) Citation2015). This program emphasized the need to decrease the water demand by 30% through conservation, productivity, and efficiency by the year 2015 relative to the levels in 2005, which was achieved through several measures, including upgrading on-farm irrigation systems and changing crop patterns (Alberta Irrigation Projects Association (AIPA) Citation2015). This program was renewed in 2008 to run until 2018 (Alberta Environment Citation2008). The government of Alberta partially subsidized the farmers to switch from less efficient irrigation systems like flood irrigation to more efficient ones like sprinklers; therefore, the areas under flood irrigation systems continuously decreased until 2015 ()). In addition to the irrigation system improvement, the goal of the Water for Life Program was achieved by changing the crop types to those requiring less water to grow. The crop patterns in BRB were switched from forage to other crops like cereals, oilseeds, and specialty crops (e.g. potato), which require 150 to 200 mm less water during the growing season ()). Although this policy enabled farmers to initially reduce their water demand, farmers were motivated to use the saved water to expand their irrigation ()), thereby gradually rebounding agricultural water demand ()). It is worth mentioning that the sudden drop in 2010 is due to an extremely wet year (Diaz et al. Citation2016). This emergent pattern in water demand occurred due to not only hydrological factors (i.e. drought) but also socio-economic effects (i.e. water conservation).
Figure 2. (a) The crop type areas in BRB from 2005 to 2015; (b) the total irrigated area in BRB from 2005 to 2015; (c) the irrigation system areas in BRB from 2005 to 2015; and (d) the agricultural water demand in BRB from 1999 to 2015 (Source: Alberta Agriculture and Forestry Citation2015)
Previous studies have shown important socio-economic factors in water conservation decisions in BRB, using surveys of farmers (Kulshreshtha and Brown Citation1993, Citation1994, Nicol et al. Citation2008). Kulshreshtha and Brown (Citation1993) showed the importance of economic and environmental protection factors in the farm-level decision to adopt a new irrigation system. They indicated that the farmers adopt a new irrigation system if they have a positive attitude toward the economics of irrigation as well as environmental quality (e.g. soil salinity). In addition, Kulshreshtha and Brown (Citation1994) revealed the significance of government grants, as an economic motivation, and of farmers’ neighbors in the farmers’ decision-making. This finding is consistent with that of Ramirez (Citation2013), who showed the key influence of social networks on agricultural technology adoption. In addition, the results of the past studies (Kulshreshtha and Brown Citation1993, Citation1994) were supported by the finding of Nicol et al.(Citation2008), who particularly emphasized that the level of economic factors is an important element in Alberta’s Water for Life Program. Moreover, this study showed that irrigation expansion is another motivation for farmers in Alberta’s Water for Life Program. The complexity of this behavior motivated us to map the relationship between the macro-scale outcomes (i.e. the dynamics of water demand) and micro-scale decisions (i.e. individual farmers’ water conservation decisions) in BRB using an agent-based modeling approach.
3 A conceptual model for complex agricultural water systems
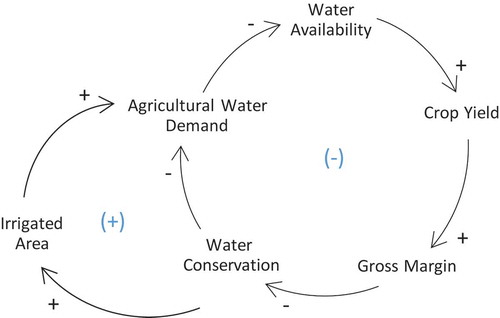
According to the observations in BRB, we conceptualized only the feedback mechanisms associated with the potential rebound phenomenon to capture the co-evolutionary dynamics of social and hydrological systems. Feedback loops emerge in complex agricultural water systems because water conservation affects water availability in a river basin, which in turn affects water conservation. Upgrading the irrigation system and changing cropping patterns are considered water conservation measures in this study, which are partially subsidized by policymakers. shows two causal loops in the complex agricultural water system. The causal loop diagram, the foundational structure of systems thinking, represents the causes, the effects, and their relations in a system (Ford and Ford Citation1999). This diagram, which depicts a closed chain, can be a balancing loop (−) or a reinforcing loop (+). The odd numbers of negative links lead to a balancing loop; on the other hand, the even numbers of negative links result in a reinforcing loop. These negative links represent the opposite direction of a change between two variables, while the positive links show the same direction of change. The first loop shows the relations between water availability, crop yield, gross margin, water conservation, and agricultural water demand. This causal loop shows how water conservation affects water availability in a river basin. Drought as an extreme event (not shown in the figure) affects water availability, leading to a decrease in farmers’ crop yields and gross margins. As a result, farmers adapt to a new situation by water conservation through policymakers’ subsidy and self-finance, resulting in a decrease in water demand. However, this water conservation, which can increase water availability in a river basin, might encourage farmers to increase their irrigated area. This increase in the irrigated area could increase agricultural water demand, resulting in a reduction in water availability through the other loop. Using systems thinking, these feedback loops can finally result in rebounding water demand in the system. Therefore, this complex behavior should be considered in agricultural water demand modeling.
Figure 3. Feedback loops in a complex agricultural water system
4 Methods
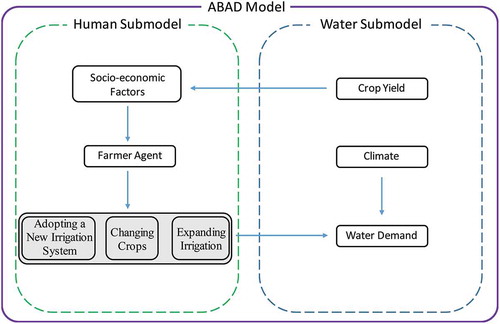
An agent-based agricultural water demand (ABAD) simulates yearly agricultural water demand from 1999 to 2015, and it has two submodels: the human submodel and the water submodel. In this study, we used Netlogo as a tool because of its important features: open source code, free availability, supportive documentation and community, and a good connection with R. The connection of Netlogo with R paves the way for further model analyses (e.g. calibration and sensitivity analysis) as Netlogo provides limited capabilities for analyzing ABMs.
4.1 Model overview
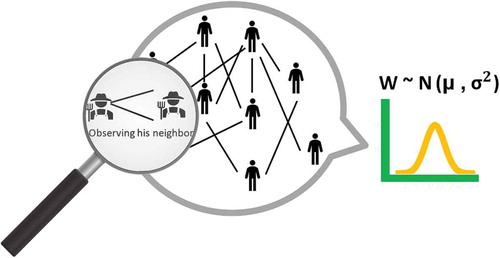
The human submodel focuses on the agricultural sector (only irrigated areas), including individual farmers as agents (). In this study, we did not capture alternative forms of production (e.g. the farmers’ ability to change to dryland or pasture) in response to low water availability, and this is one of the study limitations. We selected 2000 agents based on the number of the farms in BRB with a random social network and specific characteristics sampled from probability distributions. This social network implies that the connected farmers observe their neighbors’ decisions. These connections were selected randomly during the model setup. In fact, in the model setup, each agent randomly creates a connection with another agent in the community, leading to a social network. In response to their profits, the agents decide to conserve water at the beginning of each year as they envision any forthcoming insufficient water availability. The agents make three different decisions: adopting an improved new on-farm irrigation system (i.e. a sprinkler system in this study), changing crops, and area to be irrigated. These decisions have interactions in that if an agent saves water via a new irrigation system, he/she may choose to use it to expand the irrigation.
Figure 4. The agent-based agricultural water demand (ABAD) model framework
Following the mentioned local studies in BRB and the other previous studies (Nowak Citation1992, Wheaton et al. Citation2005, Hoag et al. Citation2012, Arbuckle Jr Citation2013, Du et al. Citation2017, Pfrimmer et al. Citation2017), we determined several socio-economic factors, relevant to farmers’ water conservation decisions: conservation purposes, future profits, past profits, risk aversion, environmental protection, social interaction, and willingness to expand irrigation. The conservation purposes account for water conservation targets set by the government. The future profit is based on the expected gross margin of 1 ha of conservation. An agent decides to conserve water if he/she earns more benefits by conservation. This benefit can be received by the government subsidy and market. The past profit is based on the same idea; however, the economic evaluation is based on the past information of an agent (or the agent’s memory). The risk aversion shows the degree to which an agent changes his/her past decision on water conservation. Therefore, if an agent is risk averse, this agent continues his/her last decision on water conservation (only if it does not cause losses). The environmental protection factor implies the extent to which an individual farmer conserves water for environmental protection regardless of economic consequences. The social interaction accounts for the extent to which an agent is affected by neighbors. All these socio-economic factors lead to a final decision on water conservation. When individual farmers conserve water, a proportion of the saved water may be used for irrigation expansion. In this regard, the irrigation expansion factor shows the amount of the saved water that is used for irrigation expansion.
We assumed, following the work of Dziubanski (Citation2018), Dziubanski et al. (Citation2019), and Roobavannan et al. (Citation2018), that farmers assign different weights to their different factors to make a final yearly decision. These weights show the extent to which farmers emphasize each of their socio-economic factors. Considering these weights for each farmer in this study in the agent-based modeling framework allowed us to appropriately capture the heterogeneity of farmers’ decision-making in their community. In other words, each farmer has a specific set of weights for decision-making in the ABAD model.
To account for the uncertainty associated with human decision-making, ABMs are generally developed using stochastic models given that human decision-making is presumably stochastic (Cohen et al. Citation2007, Acuna and Schrater Citation2008, Steyvers et al. Citation2009). Indeed, compared with physical systems that are generally defined by deterministic physical laws (e.g. gravity), social systems are more stochastic due to their uncertain and complex governing mechanism. In contrast to a deterministic model, a stochastic model generally generates different outputs for a specific set of model inputs. This stochasticity is reproduced in the model by sampling from probability distributions for some variables representing human decision-making factors. In this study, the stochasticity was captured when farmers intend to change their crops for the next year regarding the future economic values of crops. Even though farmers are influenced by future economic values of crops given the market prediction, they have different perceptions of crop prices and costs over time, which were defined by the stochastic process (i.e. sampling from assumed distributions from moment to moment, further discussed in section 4.3).
4.2 Model input
The inputs to the human submodel are based on yearly socio-economic data from 1999 to 2015. The yearly irrigated area, irrigation system area, crop patterns, and agricultural water demand data were used from the Alberta Government information (Alberta Agriculture and Forestry, Citation2015). The information on the conservation goal of the Water for Life Program was obtained from the Alberta Water Council report (Alberta Irrigation Projects Association (AIPA) 2015). The yearly crop yield data were represented by lumped values, which were obtained from Statistics Canada (Citation2021). These time series account for the trend over time, but we are not simulating crop yield in this study; this is one of the study limitations. We assumed that the crop yields for sprinkler and flood irrigation are the same. The data on the subsidy were obtained from the Canadian Agricultural Partnership (Citation2019). The subsidy for adopting sprinklers covers 40% of the cost of the irrigation system, and the rest of the cost should be self-financed (Canadian Agricultural Partnership Citation2019). The production cost and crop price data were represented by a lumped value and obtained from the Alberta government (Alberta Agriculture and Forestry Citation2015; see Table S1 in the Supplementary material for the items of production costs). It is worth mentioning that there is a positive correlation between crop prices and production costs in our case study. In other words, crops with high prices are associated with high production costs.
The inputs to the water submodel are the meteorological data: radiation at the crop surface, soil heat flux density, psychometric constant, mean daily air temperature at 2 m height, the wind speed at 2 m height, saturation vapor pressure, actual vapor pressure, the slope of the vapor pressure curve, and the crop coefficient. We used the daily meteorological data produced by the Water and Global Change (WATCH) from 1999 to 2015, which are available at http://www.eu-watch.org.
4.3 Human submodel
The farmers’ decisions (i.e. adopting sprinklers, changing crop patterns, and area to be irrigated) are made separately by individual agents, but influenced by other agents (all equations for the human submodel are shown in ). The decision on the area to be irrigated includes expanding irrigation through adopting sprinklers (Equation 1) as it increases the irrigated area in the river basin, which was defined in the decision on changing crop patterns (Equation 4). In other words, when individual farmers adopt technology to reduce their water demand, they use the saved water to expand their irrigation. Therefore, two main formulations were defined for the three decisions, which are based on the mentioned socio-economic factors. This study modified the formulation of a previous study by Dziubanski (Citation2018) and Dziubanski et al. (Citation2019), which was applied to water conservation in a flood situation. We applied the modified formulation in drought conditions and added another decision-making formulation on adopting sprinklers, which interacted with crop-changing decisions (Equations 1 and 4).
Table 1. Summary of the main equations, variables, and factors in the human submodel of the agent-based agricultural water demand (ABAD) model
Equations 1 and 4 have five and six mentioned socio-economic factors (weights) plus one implicit factor, which is discussed in equations 12 and 13, resulting in seven different factors (weights) in total. The different weights reflect the degree to which each socio-economic factor plays a role in a final decision for each individual farmer. In this study, we assumed the weights are independent of each other. Following the previous studies (Marino et al. Citation2008, Bertella et al. Citation2014, Du et al. Citation2017), we assumed each different weight for individual agents is sampled from a normal distribution of the community. Although these weights were set to be the same for all individuals by Dziubanski (Citation2018) and Dziubanski et al. (Citation2019), in our study, each of the weights was randomly sampled from a normal distribution with the mean and variance for the whole community being calibration parameters of the model (). As this model has seven factors for decision-making, we need two parameters for sampling each weight (i.e. mean and standard deviation), resulting in 14 parameters in the ABAD model ( and ). The remainder of the methods section explains the main socio-economic components in farmers’ decision-making.
Table 2. Descriptions of and units for the agent-based agricultural water demand (ABAD) parameters
Figure 5. Individual farmers make their decisions about sprinklers and crop changes, given their different socio-economic factors. “W” shows a weight for a socio-economic factor. For each individual, a weight for the socio-economic factor is sampled from a normal distribution of the community (i.e. N(µ, )). The lines between the individuals represent their social interaction with each other. In other words, a line shows both farmers observe each other for their decisions
4.3.1 Risk-aversion factor
The risk-aversion factor, in Equations (1) and (4), implies the extent to which individual farmers change their last decisions on water conservation. Therefore, if an agent is risk averse, this agent continues the previous practice (last year’s decision) for the current year. The past profit factor is based on the memory of the agent regarding their past gross margins of 1 ha of conservation. Following Dziubanski (Citation2018) and Dziubanski et al. (Citation2019), the past profit was formulated by a quadratic function (see Equations S1–S8 in the Supplementary material). The decisions, based on past profit, were restricted by the conservation goal of the program (i.e. the Water for Life Program). For adopting sprinklers, an agent evaluates the net income from adopting 1 ha of this irrigation system. Similarly, for changing crops, an agent calculates the net income from irrigating 1 ha of forage crops versus the other crops: oilseeds, cereals, and specialty.
4.3.2 Past profit factor
An agent calculates the net income from adopting 1 ha of a sprinkler system based on the incentive, the subsidy, and the cost (Equations 7 and 8). The incentive to farmers is a profit, which can be earned because of adopting sprinklers. In this study, this incentive is a function of specialty, given the past report in our case study (Alberta Irrigation Projects Association (AIPA) Citation2015). As an improvement on the past study by Dziubanski (Citation2018) and Dziubanski et al. (Citation2019), we also considered stochasticity in Equation (8) by assuming a uniform distribution because different farmers can have different perceptions about this value. In our case study, one incentive for farmers to adopt sprinklers is the potential to irrigate more lands and to plant crops like specialty crops, and therefore, we assume the gross margin of specialty crops as an incentive in this study (Equation 8). An agent calculates the net income from irrigating 1 ha of forage crops versus the other crops regarding their gross margin difference between forage and other crops (Equations 9–11). After calculating the net income from each of the two main formulations (adopting sprinklers and changing crop patterns), an agent considers the first, second, and third quartiles of his/her historical net income distribution as the satisfaction points based on the theory of bounded rationality. This agent considers all positive historical net income from the year 1999 to the current year of simulation if he/she observes the positive net income in the current year. Similarly, the agent considers all negative historical net income from the year 1999 to the current year if he/she observes the negative net income in the current year. If the positive current net income equals the third quartile of the positive historical income, an agent carries out the maximum conservation, which was restricted to both his/her available irrigated area and the degree to which a farmer follows a conservation target set by the government. Additionally, if the positive current net income equals the second quartile of the positive historical income, an agent carries out the conservation on half of his/her irrigated land. However, we assumed that an agent does not conserve water if he/she observes a small net income, less than the first quartile. Similarly, an agent behaves similarly when observing the negative net income in the current year. These water conservation decisions were defined based on the second-degree polynomial equation (see Equation S1–S2 in the Supplementary material).
4.3.3 Future profit factor
Future profit factor was defined based on the expected crop price and production cost for the future. Therefore, an agent calculates future profits ( and
), similar to the past profits; however, in the formulations of the future profits, the crop price and production cost are their future values. Instead of deterministic equations, we sampled these future economic variables from a normal distribution with a variance of Can$1. In other words, sampling from a normal distribution represents how the perception of one farmer is different from that of another regarding future prices and costs. The small value was chosen in this case study because heterogeneity in farmers’ decisions about future profits in this region is inconsiderable. In this study, the mean of the distribution equals the historical mean of price and production cost trend for each crop.
4.3.4 Environmental protection factor
The decision based on the environmental protection factor was defined to imply how much an agent favors environmental protection. This decision is a function of the conservation target factor. Given our modification of the study by Dziubanski (Citation2018) and Dziubanski et al. (Citation2019), the environmental protection factor was calculated for the conservation decisions based on Equations (12) and (13).
4.3.5 Social interaction factor
Individual agents’ decisions are often influenced by the action of their neighbors, due to their own insufficient information (Schelling Citation1973, Watts Citation2002, Kearns et al. Citation2009, Centola Citation2010). The social interaction factor implies the degree to which an agent is influenced by their neighbors’ decisions. We modified the formulation of Dziubanski (Citation2018) and Dziubanski et al. (Citation2019) and added the social interaction factor to the decision-making process. Following the work of Du et al. (Citation2017), we used a weighted average of a farmer’s neighbors to calculate the social influence on farmers (Equations 14 and 15), with a random social network during model setup. Based on the initialized social network at the start time of simulation, the social interaction with n agents and m neighbors was calculated for the conservation decisions based on Equations (14) and (15).
4.4 Water submodel
While the crop patterns and the adoption of new irrigation systems were simulated by the human submodel for the whole river basin, a lumped water submodel simulated the monthly agricultural water demand in BRB. Due to the availability of annual water demand data for our case study, we aggregated the monthly water demand to calculate the annual water demand for the purpose of model calibration and validation.
Using the Penman-Monteith method, daily reference evapotranspiration (ET0) (mm/day) and crop evapotranspiration (ETc) (mm/day) were calculated as follows (Food and Agriculture Organization of the United Nations (FAO) Citation1998):
where (MJ/m2.day) is net radiation at the crop surface,
(MJ/m2.day) is soil heat flux density,
(kPa/°C) is psychometric constant, T (°C) is mean daily air temperature at 2 m height,
(m/s) is the wind speed at 2 m height,
(kPa) is saturation vapor pressure,
(kPa) is actual vapor pressure,
(kPa/°C) is the slope of the vapor pressure curve, and
is the crop coefficient. We obtained the meteorological data from the WATCH forcing data (Weedon et al. Citation2014). Therefore, we calculated the water demand for a crop from irrigation (
) (mm/month) as follows (United States Department of Agriculture Citation1970):
where (106 m3/month) is the simulated total agricultural water demand of the river basin in million m3,
(mm/month) is the effective precipitation, SF is the soil water storage factor,
(mm/month) is precipitation,
(mm/month) crop evapotranspiration for crop c, D (mm) is assumed to be the maximum crop’s root depth,
(ha) is the crop area (i.e. forage or other crops),
is the flood irrigation system efficiency,
is the sprinkler system efficiency,
is the total efficiency, and
is the conversion factor
.
5 Design of experiments
We performed all the analyses on the average of the model response (as a metric) with 20 replicates, given the stochastic nature of our model. Using such metrics with a number of replicates (e.g. 10, 20, 50) is a common way to deal with the stochastic nature of ABMs (e.g. Segovia-Juarez et al. Citation2004, Salecker et al. Citation2019). Using the average of the model response with 20 replicates can also address the uncertainty in the size and level of connectedness of social networks in the ABAD model. Basing an analysis on many replicates is a common method in the sensitivity analysis of ABMs (e.g. Segovia-Juarez et al. Citation2004, Salecker et al. Citation2019).
5.1 Global sensitivity analysis
One challenge of the ABAD model is the high number of model parameters (i.e. 14 parameters) relative to the limited data available (i.e. 17 years). To address this challenge in the calibration and validation parts, we conducted a global sensitivity analysis on the ABAD model’s output to the potential ranges of the model parameters for identifying the most influential model parameters to be calibrated. We used the variogram-based framework, Variogram Analysis of Response Surfaces (VARS), which encompasses two commonly used approaches in global sensitivity analysis, namely derivative-based and variance-based approaches (Razavi and Gupta Citation2016a, Citation2016b). Using variograms, VARS provides a set of metrics, named IVARS. Following Razavi and Gupta (Citation2016a), we used IVARS50, representing the integration of a variogram over the first 50% of the parameter perturbation scales. In this study, for parameter sensitivity analysis, we used Nash–Sutcliffe efficiency (NSE) on the annual agricultural water demand (NSE(Water Demand)) as a model response with the following sampling settings: number of stars = 100 and sampling resolution = 0.1 (see Razavi and Gupta (Citation2016a) for further information on VARS sampling strategy). This sampling setting resulted in 12 700 model runs.
According to , the first five parameters (,
,
,
, and
) are the means for the corresponding socio-economic factors, with their lower and upper bounds assumed to be 0 and 1 (see the details of the parameter ranges in Table S2, Supplementary material). These factors will be normalized to sum to one before being plugged into the model. The upper bound of conservation target per year (
) was defined based on the long-term conservation target in the Water for Life Program: on average each year, we aimed to have 0.5% of the total irrigated land under the water conservation program (Alberta Irrigation Projects Association (AIPA) Citation2015). In addition, we assumed the upper bound of the mean for the irrigation expansion factor (
) based on the historical data. Accordingly, while changing crop patterns, individual agents expand their irrigated area (above or below the historical value). Importantly, we assumed large boundaries for all standard deviations to fully investigate the model.
In this study, crop yields are the main input data, as farmers mainly make decisions based on this information. Therefore, in addition to the sensitivity analysis of the model parameters, we perturbed the data on crop yields to assess the sensitivity of the model to this input. Using the method of Papalexiou (Citation2018), we generated 1000 different realizations (i.e. time series) for different crop yields given a normal distribution with the same mean and variance of the historical data.
5.2 Multi-objective optimization
To address the challenge of properly constraining the model with limited data, a general challenge to both socio-hydrological models and agent-based models (Windrum et al. Citation2007, Ligtenberg et al. Citation2010, An Citation2012, Noël and Cai Citation2017, Pande and Sivapalan Citation2017), we used multiple, rather than single, model outputs for the calibration and validation of the ABAD model. Regarding the three main types of outputs in ABAD (i.e. water demand, irrigation system area, and cropping patterns), we calibrated the model based on two of these outputs (i.e. water demand and irrigation system area) and validated it based on the third output (i.e. cropping patterns). We used the Nondominated Sorting Genetic Algorithm II (NSGA-II) as the multi-objective optimization method. NSGA-II was proposed as an efficient multi-objective optimization method for complex and high-dimensional problems (Deb et al. Citation2002). While we acknowledge that other optimization methods may have a better performance for finding optimum solutions, the NSGA method is a common approach that has been used for optimizing ABMs by many studies (Lee et al. Citation2016, Crooks et al. Citation2018). To account for the effect of variability within the optimization process and to find robust solutions, we ran optimization with 20 trials and the following setting: population size = 100, generations = 20, crossover probability = 0.7, crossover distribution index = 5, mutation probability = 0.2, mutation distribution index = 10. This optimization setting resulted in 40 000 model runs. We used a value of 0.5 for NSE as a satisfactory threshold (Moriasi et al. Citation2007) to filter the optimization results.
5.3 Parameter uncertainty analysis
To address the equifinality issues, we investigated the different parameter sets that properly fit the observation data through parameter uncertainty analysis. Our purpose with this analysis is to evaluate whether there exist unique parameter sets that lead to the observed data. In this regard, using the same setting with the experiment on multi-objective optimization (section 5.2), we ran the optimization with 20 trials and investigated the parameter sets that correspond to values of more than 0.5 for NSE of water demand and flood irrigation system area. We assumed this value for the experiment as a satisfactory model performance, following the literature (Moriasi et al. Citation2007). Finally, we try to validate the result using qualitative data, namely existing reports and interviews in our case study.
6 Results
6.1 Sensitivity analysis
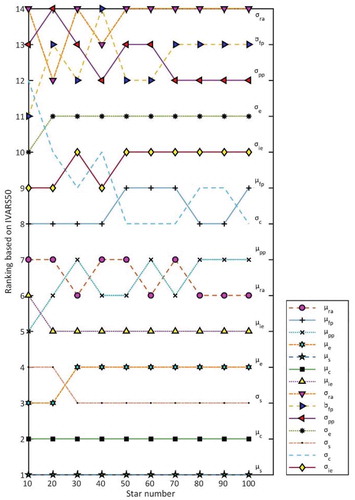
shows the parameter sensitivity analysis of the ABAD model based on IVARS50. The results show that the mean for the social interaction factor () and the conservation goal factor (
), and the standard deviation for social interaction factor (
), are the most sensitive parameters controlling NSE(Water Demand), while the standard deviations for risk-aversion factor (
), future profit factor (
), and past profit factor (
) are the least important parameters for this purpose. Compared to other factors, the social interaction factor (
) highly affects NSE(Water Demand). However, most of the standard deviation parameters, which show the heterogeneity in the community, are the least sensitive, implying that the heterogeneity in socio-economic factors – excluding social interaction – control less NSE(Water Demand), compared to other factors.
Figure 6. Parameter sensitivity analysis of the agent-based agricultural water demand (ABAD) model versus star number (star-sampling is a sampling strategy to improve the computation of a full range of sensitivity information (more details in Razavi and Gupta Citation2016b)) based on IVARS50: rank 1 represents the most influential parameter, while rank 14 represents the least influential parameter. Here, the global sensitivity of NSE(Water Demand) to the model parameters is assessed
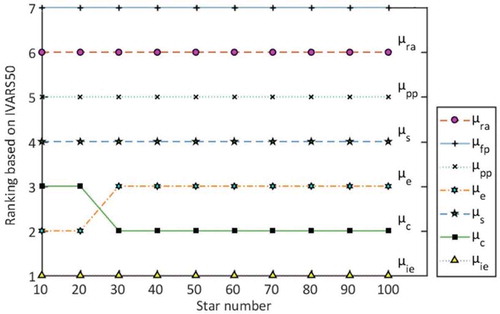
The result of the sensitivity analysis shows the dominant importance of the all-mean parameters as well as the standard deviations of social interaction (). In addition, to provide a better understanding of the importance of the standard deviations, we performed another sensitivity analysis with a narrower and more realistic range (see Table S3 in the Supplementary material for the parameter ranges of the sensitivity analysis). The result of this analysis indicates that all standard deviations drop in importance (see Fig. S2 in the Supplementary material for the result of the sensitivity analysis). Besides, to the best of our knowledge, the heterogeneity (represented here by standard deviation) in this case study is not large. In other words, farmers make their decisions in a similar manner. Therefore, we reduced the number of the model parameters to seven, namely the means of distributions of behavioral parameters (see Table S4 in the Supplementary material for the new setting for parameter sensitivity analysis). In this regard, following the past studies (Marino et al. Citation2008, Du et al. Citation2017) and a good understanding of our case study, we fixed the rest of the parameters (all standard deviation parameters) to 0.01 for the calibration and validation purposes. We arbitrarily assumed this low value as an indicator of a small standard deviation in this study. The decrease in the number of parameters enables us to avoid over-fitting issues in this study that can arise due to the limitation on data availability. However, this issue can be challenging in other case studies, in cases where the farmers’ behavior is highly diverse, and it should be investigated further in future studies.
After fixing the variance parameters, the possible change in the results of the sensitivity analysis of mean parameters motivated us to conduct another experiment with the new setting (See Table S4 in the Supplementary material). The new results show that the mean for irrigation expansion is the most sensitive parameter in the model after we fixed the less sensitive parameters (i.e. all standard deviations) (). This means that the mean value of the irrigation expansion factor highly affects the results of NSE(Water Demand). shows the parameter sensitivity analysis including all parameters with large standard deviations, compared with the reduced set of seven parameters. The comparison shows that the social interaction factor plays a crucial role in the irrigation system growth and crop changing, leading to the water demand for agriculture, in a diverse society.
Table 3. The comparison of parameter sensitivity analysis with all parameters and with the seven selected parameters. The parameters with low values are the most sensitive parameters
Figure 7. Parameter sensitivity analysis of the agent-based agricultural water demand (ABAD) model parameters based on NSE(Water Demand) with a new setting
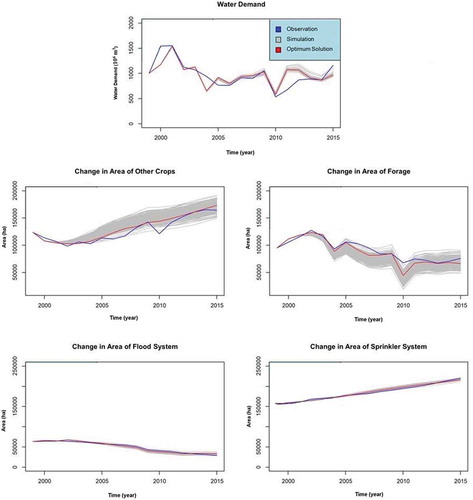
Regarding the sensitivity of the model to input data, shows the envelope of the variability of model outputs under the crop yield uncertainty. This result implies that the forage and other crop areas are more sensitive, compared to other outputs, to the change in crop yield. This result also shows that the variability of the crop yields highly affects the change in crop patterns, as crop yield is important to farmers for their decision-making.
Figure 8. The effect of crop yield uncertainty on the model outputs
6.2 Multi-objective calibration and validation
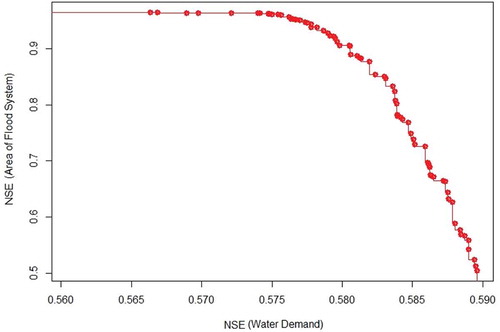
After screening the uninfluential model parameters by SA, we calibrated the remaining parameters with the new setting (See Table S4 in the Supplementary material). shows the Pareto front based on two objective functions, i.e. NSE(Water Demand) and NSE(Area of Flood Irrigation System). The best solutions for the optimization have NSE values of 0.98 and 0.59 for the Area of Flood Irrigation System and Water Demand, respectively.
Figure 9. Pareto front results based on Nash–Sutcliffe efficiency (NSE) of water demand and area of flood system
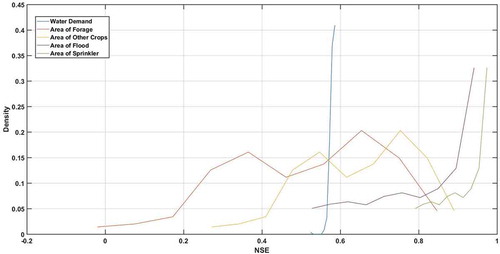
shows the probability distribution function (PDF) plots of model performance based on the multi-objective functions. Given the results of 20 trials in multi-objective optimization, we derived a PDF for each NSE of the model outputs (water demand, flood irrigation system area, sprinkler irrigation system area, forage area, and other crop areas). Two of these PDFs (water demand and forage area), which were filtered by the value of 0.5 for NSE, were used for the purpose of calibration. The other three PDFs were used for the validation. This result demonstrates that the PDF of water demand shows the smallest variability, indicating that all model performances on water demand are relatively robust. However, the PDFs of the other model performance metrics show large variability.
Figure 10. Probability distribution function (PDF) plots of Nash–Sutcliffe efficiency (NSE) values for different model outputs based on all the Pareto-front points of the 20 trials in bi-objective optimization. “Water demand” and “area of flood” were used as the optimization objective functions, and the other outputs were used for validation
shows the result of one optimum solution given calibration and validation results. This optimum solution generated NSE(Water Demand) = 0.57 and NSE(Area of the Flood) = 0.96. We choose this model for further analysis in section 6.3. The performance of the model for this solution is acceptable, given the NSE for different outputs. The optimum solution shows a good performance on the water demand output, although the model does not fully capture the observed data in the years 2000, 2004, 2011, and 2012. However, the model implies a much better performance on the outputs of the human submodel. One reason for the better performance of the human submodel is that the outputs of the human submodel (area of crops and irrigation systems) have more linear behavior than water demand. The model captures the overall nonlinear behavior of the forage and other crop areas with a satisfactory NSE. In addition, the model outputs on irrigation system areas are well fitted to the observed data, which is due to the relatively linear behavior of these state variables.
Figure 11. The result of an optimum solution based on multi-objective optimization and the model performance for calibration and validation
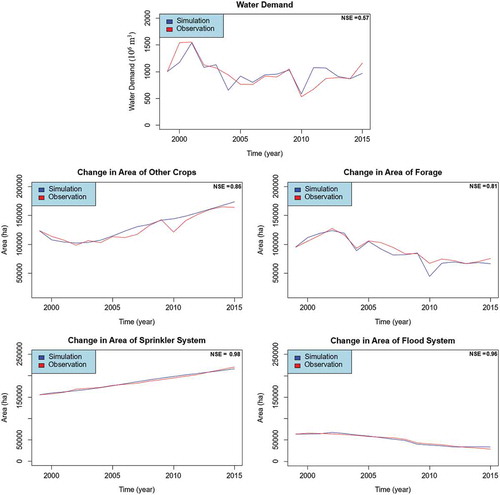
The result of the model optimal solution shows that the model is more sensitive to gradual trends rather than abrupt changes over time. For example, the model cannot simulate the abrupt changes in the area of other crops in 2010 (). However, capturing overall trends in socio-hydrological models can satisfy the goal of socio-hydrology as the purpose of such models is not to merely predict the future, but rather to explore co-evolving trajectories of human and water systems (Srinivasan et al. Citation2017). Nevertheless, modifying the hydrological submodel to become a spatially distributed one is likely to enhance the model’s ability to capture the abrupt changes.
6.3 Parameter uncertainty
The results of the parameter uncertainty imply that three out of seven parameters are more identifiable (smaller range of variability in ) in this study (i.e.,
, and
). The mean of the risk-aversion factor (
) assumes a low value, implying that the farmers are, on average, risk takers in this case study. The risk aversion values are meaningful given the existing reports in the province of Alberta (Statistics Canada Citation2016, Alberta Agriculture and Forestry Citation2017), and the study by Kulshreshtha and Brown (Citation1994), who showed the level of risk aversion is controlled by the age and education of farmers. Accordingly, as a large number of farmers in Alberta are educated and less than 55 years old (Statistics Canada Citation2016, Alberta Agriculture and Forestry Citation2017), they may be more prone to taking risks.
Figure 12. The result of parameter uncertainty analysis based on multi-objective optimization
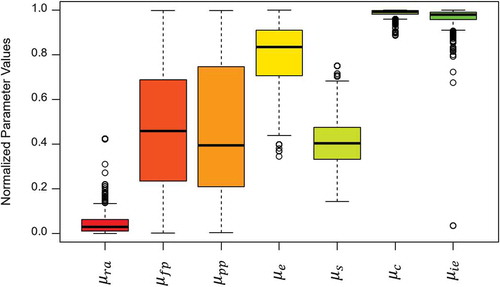
Additionally, the mean of the conservation goal factor () stands out as a high value, showing that the farmers highly follow the conservation target of the program (i.e. the Water for Life Program). This result is supported by the report of the Alberta Irrigation Projects Association (Alberta Irrigation Projects Association (AIPA) Citation2015), confirming that “efficiency gains amounted to 26%, measured by the reduction in diversions ….” The mean of the irrigation expansion factor (
appears as a high value, implying that adopting sprinklers explains the irrigation expansion in BRB. Although this finding may contain uncertainty (e.g. due to the model structure), it is also supported by the past report and interviews (Kulshreshtha and Brown Citation1994, Alberta Irrigation Projects Association (AIPA) Citation2015). The report by the Alberta Irrigation Projects Association (Alberta Irrigation Projects Association (AIPA) Citation2015) shows that technology is an incentive to farmers for shifting crops from forage to other crops. In addition, Kulshreshtha and Brown (Citation1994) show that, by reviewing different surveys, irrigation expansion in the South Saskatchewan River Basin is the result of a change in technology. The results of the parameter uncertainty analysis are closely aligned with the different reports and interviews in our case study, which further validates the ABAD model.
On the other hand, the results for the parameter uncertainty show that the means of future profit (, past profit (
, environmental protection (
, and social interaction (
are not quite identifiable in this study. Although it is difficult to identify the exact sources of the uncertainty, this issue is essentially based on the model structure, forcing dataset, or model and observation errors.
7 Conclusion
A better understanding of co-evolving human behaviors with hydrologic systems can enable policymakers to enhance their long-term planning, as these behaviors affect the watershed system. An irrigation system improvement is one of the adaptation decisions that not only affects agricultural water demand but also leads to changing crop patterns and irrigation expansion. To assess the effects of both water-saving technologies and changing cropping patterns on estimates of agricultural water demands, we developed an agent-based agricultural water demand (ABAD) model for the Bow River Basin (BRB) in Alberta, Canada. In comparison with traditional water demand models, which consider the role of humans through exogenous scenarios, the ABAD model attempts to endogenize the relationship between the human and the hydrological systems. The ABAD model revealed a mapping between the basin-scale rebound phenomenon and the socio-economic factors in individual farmers’ water conservation decisions, which can help in understanding the rebound phenomenon and possibly control it through future long-term water policies. Some conclusions and highlights of this study are:
The social interaction factor plays a crucial role in water demand when farmers’ behavior is highly diverse in a society. The social interaction between farmers highly affects the adoption of technology, aligned with the previous study (Nicol et al. Citation2008, Ramirez Citation2013), and it is an effective factor in the rebound phenomenon.
The irrigation expansion factor is highly important in water demand in BRB, where the heterogeneity in farmers’ behavior is not large. Consistent with previous studies (Scheierling et al. Citation2006, Soto-García et al. Citation2013, Berbel and Mateos Citation2014, Graveline et al. Citation2014), this study suggests that irrigation expansion should be restricted to avoid the rebound phenomenon. However, this policy is completely contrary to the main targets of Alberta’s Water for Life Program (Alberta Irrigation Projects Association (AIPA) Citation2015). Therefore, continuing to pursue the purpose of this target could lead to repeated occurrences of the rebound phenomenon. It is also worth mentioning that the irrigation expansion would not be a critical issue in wet years if the irrigated area decreases in dry years.
The conservation goal factor implies a significant role in any level of heterogeneity. This implies that farmers pay significant attention to the mentioned factors for agricultural water demand. However, the conservation program does not provide any guarantees to avoid the rebound phenomenon; this is also supported by a previous study (Ward and Pulido-Velazquez Citation2008).
This research has raised a few questions worthy of further research. In contrast to many universal laws in physics defined by straightforward mathematical equations, translating human decision-making theories to mathematical equations requires assumptions on modeling details. This research used the theory of bounded rationality for simulating farmers’ decision-making, with certain assumptions on modeling conceptualizations. Future studies need to assess the structural sensitivity of the ABAD model. In other words, it is important to evaluate the model performance under the theory of bounded rationality compared to other social theories in the BRB. Moreover, further research is needed, to collect more data on the socio-economic factors of the ABAD model for further model calibration and validation. We believe that socio-hydrological issues are place-specific; therefore, developing a generalized model or transferable methods is not a straightforward task. However, as the ABAD model is built based on a general social theory (i.e. bounded rationality theory), applying this model to other case studies can be helpful for further comparative analysis and the contribution to a generalized model. This model can be integrated with water management models e.g. Modsim Decision Support System (Modsim-DSS) to provide a better understanding of the role of water conservation policy in future long-term planning in the BRB.
This research also investigated the feedback mechanism that can lead to the agricultural rebound phenomenon. Regarding the issue of rebounding agricultural water demand, future studies could explore the most important socio-economic factors in the rebound phenomenon in BRB and investigate how they co-evolve with a hydrological system over time, using sensitivity analysis and scenario analysis. Additionally, it could be investigated how this phenomenon can lead to a system collapse or tipping point in the future due to the limitation on water availability. Addressing these challenges can give us insights to decelerate the effect of rebounding water demand in this complex socio-hydrological system, as this phenomenon occurred due to unintended water management consequences.
Supplemental Material
Download PDF (320.1 KB)Acknowledgements
The first author thanks Shervan Gharari for his help with the preparation of the meteorological data from the WATCH forcing data. This research is funded by the PhD Excellence Scholarship from the School of Environment and Sustainability at the University of Saskatchewan. Also, this research is financially supported by the Integrated Modeling Program for Canada (IMPC) as a part of the Global Water Futures (GWF) program, funded by the Canada First Research Excellence Fund (CFREF) project. We appreciate constructive feedback from Drs Saket Pande and David Dziubanski, and from two anonymous reviewers.
Disclosure statement
No potential conflict of interest was reported by the authors.
Supplementary material
Supplemental data for this article can be accessed here.
References
- Acuna, D. and Schrater, P. (2008). Bayesian modeling of human sequential decision-making on the multi-armed bandit problem. In Proceedings of the 30th annual conference of the cognitive science society (Vol. 100, pp. 200–300). Washington, DC: Cognitive Science Society.
- Alberta Agriculture and Forestry, 2015. Cost and return benchmarks for crops and forages : irrigated soil zone - Open Government. Edmonton. Available from: https://open.alberta.ca/publications/agriprofit-cost-and-return-benchmarks-for-crops-and-forages-irrigated-soil-zone [Accessed 1 Feb 2021].
- Alberta Agriculture and Forestry, 2017. Agriculture statistics yearbook. Edmonton. Available from: https://open.alberta.ca/publications/1927-4106 [Accessed 2 Feb 2021].
- Alberta Agriculture and Forestry, 2015. Alberta irrigation information. Lethbridge. Available from: https://open.alberta.ca/publications/3295832 [Accessed 2 Feb 2021].
- Alberta Environment, 2008. Water for life: a renewal. Available from https://open.alberta.ca/dataset/16e373f7-35c6-438c-8028-b9ab7e3e2fee/resource/bd7930bf-da3b-449a-8630-ef0b11dde99e/download/waterforlife-renewal-nov2008.pdf [Accessed 5 Jan 2021].
- Alberta Environment and Parks, 2017. Bow River Water Management Project : advice to Government on water management in the Bow River Basin. Edmonton. Available from: https://open.alberta.ca/publications/bow-river-water-management-project-advice-to-government-on-water-management-in-the-bow-river-basin#summary.
- Alberta Irrigation Projects Association (AIPA), 2015. Irrigation Sector 2005–2015 conservation, efficiency, productivity report. Available from: http://www.aipa.ca/wp-content/uploads/2013/11/AIPA-CEP-Final-Version-1.pdf [Accessed 5 Jan 2021].
- Alberta Queen’s Printer, Dec 2000. Water Act, 135.
- Amec, 2009. South Saskatchewan river Basin in Alberta: water supply study. Lethbridge, Alberta: Alberta Agriculture and Rural Development. Available from: https://www1.agric.gov.ab.ca/$Department/deptdocs.nsf/all/irr13053/$FILE/ssrb_main_report.pdf [Accessed 2 Feb 2021].
- An, L., 2012. Modeling human decisions in coupled human and natural systems: review of agent-based models. Ecological Modelling, 229, 25–36. doi:10.1016/j.ecolmodel.2011.07.010
- Annual Report of Agroclimate Conditions Across Canada - Agriculture and Agri-Food Canada (AAFC), 2017. Available from: http://www.agr.gc.ca/eng/programs-and-services/drought-watch/2017-annual-report-of-agroclimate-conditions-across-canada/?id=1519400741748 [ Accessed 25 Dec 2018]
- Arbuckle Jr, J.G., 2013. Farmer attitudes toward proactive targeting of agricultural conservation programs. Society & Natural Resources, 26 (6), 625–641. doi:10.1080/08941920.2012.671450.
- Barreteau, O., et al., 2004. Suitability of multi-agent simulations to study irrigated system viability: application to case studies in the Senegal River Valley. Agricultural Systems, 80 (3), 255–275. doi:10.1016/j.agsy.2003.07.005.
- Becu, N., et al., 2003. Agent based simulation of a small catchment water management in northern Thailand: description of the CATCHSCAPE model. Ecological Modelling, 170 (2–3), 319–331. doi:10.1016/S0304-3800(03)00236-9.
- Berbel, J. and Mateos, L., 2014. Does investment in irrigation technology necessarily generate rebound effects? A simulation analysis based on an agro-economic model. Agricultural Systems, 128, 25–34. doi:10.1016/j.agsy.2014.04.002
- Berger, T. and Troost, C., 2014. Agent‐based modelling of climate adaptation and mitigation options in agriculture. Journal of Agricultural Economics, 65 (2), 323–348. doi:10.1111/1477-9552.12045.
- Berglund, E.Z., 2015. Using agent-based modeling for water resources planning and management. Journal of Water Resources Planning and Management, 141 (11), 4015025. doi:10.1061/(ASCE)WR.1943-5452.0000544.
- Bertella, M.A., et al., 2014. Confidence and the stock market: an agent-based approach. PloS One, 9 (1), e83488. doi:10.1371/journal.pone.0083488.
- Booysen, M.J., Visser, M., and Burger, R., 2019. Temporal case study of household behavioural response to Cape Town’s “Day Zero” using smart meter data. Water Research, 149, 414–420.
- Bow River Basin Council. (2010). Bow River Basin state of the watershed summary. Available from: http://www.brbc.ab.ca/brbc-documents/publications/66-web-based-state-of-the-watershed-2010-booklet [Accessed 5 Jan 2021].
- Canadian Agricultural Partnership, 2019. Irrigation efficiency Lethbridge. Available from: https://cap.alberta.ca/CAP/program/IRR_EFFICIENCY [ Accessed 2 Jan 2019]
- Castella, J.-C., Trung, T.N., and Boissau, S., 2005. Participatory simulation of land-use changes in the northern mountains of Vietnam: the combined use of an agent-based model, a role-playing game, and a geographic information system. Ecology and Society, 10 (1). doi:10.5751/ES-01328-100127.
- CBC news. (2009). Parched Prairies: latest drought a sign of things to come? - Canada - CBC News. Available from: http://www.cbc.ca/news/canada/parched-prairies-latest-drought-a-sign-of-things-to-come-1.845429 [ Accessed 29 Dec 2017]
- Centola, D., 2010. The spread of behavior in an online social network experiment. Science, 329 (5996), 1194–1197. doi:10.1126/science.1185231.
- Cohen, J.D., McClure, S.M., and Yu, A.J., 2007. Should I stay or should I go? How the human brain manages the trade-off between exploitation and exploration. Philosophical Transactions of the Royal Society B: Biological Sciences, 362 (1481), 933–942. doi:10.1098/rstb.2007.2098.
- Crooks, A., et al., 2018. Agent-based modelling and geographical information systems:a practical primer. SAGE Publications Limited.
- Deb, K., et al., 2002. A fast and elitist multiobjective genetic algorithm: NSGA-II. IEEE Transactions on Evolutionary Computation, 6 (2), 182–197. doi:10.1109/4235.996017.
- Di Baldassarre, G., et al., 2013. Socio-hydrology: conceptualising human-flood interactions. Hydrology and Earth System Sciences, 17 (8), 3295–3303. doi:10.5194/hess-17-3295-2013.
- Dia, H., 2002. An agent-based approach to modelling driver route choice behaviour under the influence of real-time information. Transportation Research Part C: Emerging Technologies, 10 (5–6), 331–349. doi:10.1016/S0968-090X(02)00025-6.
- Diaz, H., Hurlbert, M., and Warren, J., 2016. Vulnerability and adaptation to drought: the Canadian Prairies and South America. Calgary: University of Calgary Press.
- Drought in 20th Century Alberta, 2018. Available from: https://albertawater.com/history-of-drought-in-alberta/drought-in-20th-century-alberta [ Accessed 24 Dec 2018]
- Du, E., et al., 2017. Exploring the role of social media and individual behaviors in flood evacuation processes: an agent-based modeling approach. Water Resources Research, 53 (11), 9164–9180. doi:10.1002/2017WR021192.
- Dziubanski, D. (2018). Investigating the impacts of human decision-making and climate change on hydrologic response in an agricultural watershed. Iowa State University. Available from: https://lib.dr.iastate.edu/cgi/viewcontent.cgi?article=7581&context=etd [Accessed 5 Jan 2021].
- Dziubanski, D., Franz, K.J., and Gutowski, W., 2019. Linking economic and social factors to peak flows in an agricultural watershed using socio-hydrologic modeling. Hydrol. Earth Syst. Sci. Discuss, 2019, 1–55. doi:10.5194/hess-2019-484
- Elshafei, Y., et al., 2014. A prototype framework for models of socio-hydrology: identification of key feedback loops and parameterisation approach. Hydrology and Earth System Sciences, 18 (6), 2141–2166. doi:10.5194/hess-18-2141-2014.
- Food and Agriculture Organization of the United Nations (FAO), 1998. FAO irrigation and drainage paper no. 56. Rome: Food and Agriculture Organization of the United Nations, 56 (97), e156.
- Ford, A. and Ford, F.A., 1999. Modeling the environment: an introduction to system dynamics models of environmental systems. Washington, DC: Island press.
- Garcia, M., Portney, K., and Islam, S., 2016. A question driven socio-hydrological modeling process. Hydrology and Earth System Sciences, 20 (1), 73–92. doi:10.5194/hess-20-73-2016.
- Giacomoni, M.H., Kanta, L., and Zechman, E.M., 2013. Complex Adaptive Systems Approach to Simulate the Sustainability of Water Resources and Urbanization. Journal of Water Resources Planning and Management, 139 (5), 554–564. doi:10.1061/(ASCE)WR.1943-5452.0000302.
- Gonzales, P. and Ajami, N., 2017. Social and structural patterns of drought-related water conservation and rebound. Water Resources Research, 619–634. doi:10.1002/2017WR021852.
- Graveline, N., et al., 2014. Hydro-economic modeling of water scarcity under global change: an application to the Gállego river basin (Spain). Regional Environmental Change, 14 (1), 119–132. doi:10.1007/s10113-013-0472-0.
- Groeneveld, J., et al., 2017. Theoretical foundations of human decision-making in agent-based land use models – a review. Environmental Modelling and Software, 87, 39–48. doi:10.1016/j.envsoft.2016.10.008
- Hejazi, M., et al., 2014. Long-term global water projections using six socioeconomic scenarios in an integrated assessment modeling framework. Technological Forecasting and Social Change, 81, 205–226. doi:10.1016/j.techfore.2013.05.006
- Hoag, D., Luloff, A.E., and Osmond, D.L., 2012. Lessons learned from the NIFA-CEAP: how farmers and ranchers make decisions on conservation practices. Raleigh, NC: NC State University.
- Hukkinen, J.I., 2014. Model of the social–ecological system depends on model of the mind: contrasting information-processing and embodied views of cognition. Ecological Economics, 99, 100–109. doi:10.1016/j.ecolecon.2014.01.017
- Jager, W., et al., 2000. Behaviour in commons dilemmas: homo economicus and homo psychologicus in an ecological-economic model. Ecological Economics, 35 (3), 357–379. doi:10.1016/S0921-8009(00)00220-2.
- Kandasamy, J., et al., 2014. Socio-hydrologic drivers of the pendulum swing between agricultural development and environmental health: a case study from Murrumbidgee River basin, Australia. Hydrology and Earth System Sciences, 18 (3), 1027–1041. doi:10.5194/hess-18-1027-2014.
- Kearns, M., et al., 2009. Behavioral experiments on biased voting in networks. Proceedings of the National Academy of Sciences, 106 (5), 1347–1352. doi:10.1073/pnas.0808147106.
- Kerridge, J., Hine, J., and Wigan, M., 2001. Agent-based modelling of pedestrian movements: the questions that need to be asked and answered. Environment and Planning. B, Planning & Design, 28 (3), 327–341. doi:10.1068/b2696.
- King, C. (2015). Prairie drought - past, present and future | AG150. Available from: https://www.ag150.ca/past/prairie-drought-past-present-and-future-2216 [ Accessed 25 Dec 2018]
- Kremmydas, D., Athanasiadis, I.N., and Rozakis, S., 2018. A review of agent based modeling for agricultural policy evaluation. Agricultural Systems, 164, 95–106. doi:10.1016/j.agsy.2018.03.010
- Kulshreshtha, S.N. and Brown, W.J., 1993. Role of farmers‘ attitudes in adoption of irrigation in Saskatchewan. Irrigation and Drainage Systems, 7 (2), 85–98. doi:10.1007/BF00880869.
- Kulshreshtha, S.N. and Brown, W.J., 1994. Adoption of irrigation: a review of the south Saskatchewan river irrigation district. Canadian Water Resources Journal, 19 (2), 125–140. doi:10.4296/cwrj1902125.
- Lee, J. et al, 2016. The complexities of agent-based modeling output analysis. 2015, 1–26. doi:10.18564/jasss.2897
- Levine, J., Chan, K.M.A., and Satterfield, T., 2015. From rational actor to efficient complexity manager: exorcising the ghost of homo economicus with a unified synthesis of cognition research. Ecological Economics, 114, 22–32. doi:10.1016/j.ecolecon.2015.03.010
- Ligtenberg, A., et al., 2010. Validation of an agent-based model for spatial planning: a role-playing approach. Computers, Environment and Urban Systems, 34 (5), 424–434. doi:10.1016/j.compenvurbsys.2010.04.005
- Liu, Y., et al., 2014. Socio-hydrologic perspectives of the co-evolution of humans and water in the Tarim River basin, Western China: the Taiji–Tire model. Hydrology and Earth System Sciences, 18 (4), 1289–1303. doi:10.5194/hess-18-1289-2014
- Marino, S., et al., 2008. A methodology for performing global uncertainty and sensitivity analysis in systems biology. Journal of Theoretical Biology, 254 (1), 178–196. doi:10.1016/j.jtbi.2008.04.011
- Moriasi, D.N., et al., 2007. Model evaluation guidelines for systematic quantification of accuracy in watershed simulations. Transactions of the ASABE, 50 (3), 885–900. doi:10.13031/2013.23153.
- Ng, T.L., et al., 2011. An agent-based model of farmer decision-making and water quality impacts at the watershed scale under markets for carbon allowances and a second-generation biofuel crop. Water Resources Research, 47 (9), 9. doi:10.1029/2011WR010399
- Nicol, L.A., Bjornlund, H., and Klein, K.K., 2008. Improved technologies and management practices in irrigation—implications for water savings in Southern Alberta. Canadian Water Resources Journal, 33 (3), 283–294. doi:10.4296/cwrj3303283
- Nicol, L.A. and Klein, K.K., 2006. Water market characteristics: results from a survey of Southern Alberta irrigators. Canadian Water Resources Journal/Revue Canadienne Des Ressources Hydriques, 31 (2), 91–104. doi:10.4296/cwrj3102091
- Noël, P.H. and Cai, X., 2017. On the role of individuals in models of coupled human and natural systems: lessons from a case study in the Republican River Basin. Environmental Modelling and Software, 92 (March1993), 1–16. doi:10.1016/j.envsoft.2017.02.010
- Nowak, P., 1992. Why farmers adopt production technology overcoming impediments to adoption of crop residue management techniques will be crucial to implementation of conservation compliance plans. Journal of Soil and Water Conservation, 47 (1), 14–16.
- Pande, S. and Savenije, H.H.G., 2016. A sociohydrological model for smallholder farmers in Maharashtra, India. Water Resources Research, 52 (3), 1923–1947. doi:10.1002/2015WR017841.
- Pande, S. and Sivapalan, M., 2017. Progress in socio‐hydrology: a meta‐analysis of challenges and opportunities. Wiley Interdisciplinary Reviews: Water, 4, 4.
- Papalexiou, S.M., 2018. Unified theory for stochastic modelling of hydroclimatic processes: preserving marginal distributions, correlation structures, and intermittency. Advances in Water Resources, 115, 234–252. doi:10.1016/J.ADVWATRES.2018.02.013.
- Parker, D.C., et al., 2003. Multi-agent systems for the simulation of land-use and land-cover change: a review. Annals of the Association of American Geographers, 93 (2), 314–337. doi:10.1111/1467-8306.9302004.
- Pfrimmer, J., et al., 2017. Motivations for enrollment into the conservation reserve enhancement program in the James River Basin of South Dakota. Human Dimensions of Wildlife, 22 (4), 382–389. doi:10.1080/10871209.2017.1324069.
- Quesnel, K.J. and Ajami, N.K., 2017. Changes in water consumption linked to heavy news media coverage of extreme climatic events. Science Advances, 3 (10), e1700784. doi:10.1126/sciadv.1700784.
- Ramirez, A., 2013. the influence of social networks on agricultural technology adoption. procedia - social and behavioral sciences, 79, 101–116. doi:10.1016/j.sbspro.2013.05.059.
- Razavi, S., et al., 2020. Anthropocene flooding: challenges for science and society. Hydrological Processes, 34 (8), 1996–2000. doi:10.1002/hyp.13723.
- Razavi, S. and Gupta, H.V., 2016a. A new framework for comprehensive, robust, and efficient global sensitivity analysis: 1. Theory. Water Resources Research, 52 (1), 423–439. doi:10.1002/2015WR017558.
- Razavi, S. and Gupta, H.V., 2016b. A new framework for comprehensive, robust, and efficient global sensitivity analysis: 2. Application. Water Resources Research, 52 (1), 440–455. doi:10.1002/2015WR017559.
- Roby, N.A., et al., 2018. A novel search algorithm for quantifying news media coverage as a measure of environmental issue salience. Environmental Modelling and Software, 101, 249–255. doi:10.1016/j.envsoft.2017.12.012.
- Roobavannan, M., et al., 2018. Norms and values in sociohydrological models. Hydrology and Earth System Sciences, 22 (2), 1337–1349. doi:10.5194/hess-22-1337-2018.
- Salecker, J., et al., 2019. The nlrx r package: A next‐generation framework for reproducible NetLogo model analyses. Methods in Ecology and Evolution, 10 (11), 1854–1863.
- Scheierling, S.M., Young, R.A., and Cardon, G.E., 2006. Public subsidies for water-conserving irrigation investments: hydrologic, agronomic, and economic assessment. Water Resources Research, 42 (3), 3. doi:10.1029/2004WR003809.
- Schelling, T.C., 1973. Hockey helmets, concealed weapons, and daylight saving: a study of binary choices with externalities. Journal of Conflict Resolution, 17 (3), 381–428. doi:10.1177/002200277301700302.
- Schlüter, M., et al., 2017. A framework for mapping and comparing behavioural theories in models of social-ecological systems. Ecological Economics, 131, 21–35. doi:10.1016/j.ecolecon.2016.08.008.
- Schreinemachers, P. and Berger, T., 2006. Land use decisions in developing countries and their representation in multi-agent systems. Journal of Land Use Science, 1 (1), 29–44. doi:10.1080/17474230600605202.
- Schreinemachers, P. and Berger, T., 2011. An agent-based simulation model of human–environment interactions in agricultural systems. Environmental Modelling and Software, 26 (7), 845–859. doi:10.1016/j.envsoft.2011.02.004.
- Segovia-Juarez, J.L., Ganguli, S., and Kirschner, D., 2004. Identifying control mechanisms of granuloma formation during M. tuberculosis infection using an agent-based model. Journal of Theoretical Biology, 231 (3), 357–376. doi:10.1016/j.jtbi.2004.06.031.
- Siebenhüner, B., 2000. Homo sustinens—towards a new conception of humans for the science of sustainability. Ecological Economics, 32 (1), 15–25.
- Sivapalan, M. and Blöschl, G., 2015. Time scale interactions and the coevolution of humans and water. Water Resources Research, 51 (9), 6988–7022. doi:10.1002/2015WR017896.
- Sivapalan, M., Savenije, H.H.G., and Blöschl, G., 2012. Socio-hydrology: a new science of people and water. Hydrological Processes, 26 (8), 1270–1276. doi:10.1002/hyp.8426.
- Song, J., et al., 2018. The agricultural water rebound effect in China. Ecological Economics, 146 (December 2017), 497–506. doi:10.1016/j.ecolecon.2017.12.016.
- Soto-García, M., et al., 2013. Effect of water scarcity and modernisation on the performance of irrigation districts in south-eastern Spain. Agricultural Water Management, 124, 11–19. doi:10.1016/j.agwat.2013.03.019
- Srinivasan, V., 2015. Reimagining the past – use of counterfactual trajectories in socio-hydrological modelling: the case of Chennai, India. Hydrology and Earth System Sciences, 19 (2), 785–801. doi:10.5194/hess-19-785-2015.
- Srinivasan, V., et al., 2017. Prediction in a socio-hydrological world. Hydrological Sciences Journal, 62 (3), 338–345. doi:10.1080/02626667.2016.1253844.
- Statistics Canada, 2016. Census of agriculture. Available from: https://www150.statcan.gc.ca/t1/tbl1/en/tv.action?pid=3210001101&pickMembers%5B0%5D=1.10 [accessed 5 Jan 2021].
- Statistics Canada, 2021. Table 32-10-0359-01 estimated areas, yield, production, average farm price and total farm value of principal field crops, in metric and imperial units. Available from: https://www150.statcan.gc.ca/t1/tbl1/en/tv.action?pid=3210035901&cubeTimeFrame.startYear=1999&cubeTimeFrame.endYear=2020&referencePeriods=19990101%2C20200101 [Accessed 2 Feb 2021].
- Steyvers, M., Lee, M.D., and Wagenmakers, E.-J., 2009. A Bayesian analysis of human decision-making on bandit problems. Journal of Mathematical Psychology, 53 (3), 168–179. doi:10.1016/j.jmp.2008.11.002.
- Tubiello, F.N. and Fischer, G., 2007. Reducing climate change impacts on agriculture: global and regional effects of mitigation, 2000–2080. Technological Forecasting and Social Change, 74 (7), 1030–1056. doi:10.1016/j.techfore.2006.05.027.
- Turner, R.J.W., et al. (2005). Bow River Basin Waterscape; Geological Survey of Canada, Miscellaneous Report 90. Geological Survey of Canada.
- United States Department of Agriculture, 1970. Irrigation water requirements. Washington, DC: USDA Soil Conservation Service, Technical Release No. 21.
- Van Den Bergh, J.C.J.M., Ferrer-i-Carbonell, A., and Munda, G., 2000. Alternative models of individual behaviour and implications for environmental policy. Ecological Economics, 32 (1), 43–61. doi:10.1016/S0921-8009(99)00088-9.
- Van Emmerik, T.H.M., et al., 2014. Socio-hydrologic modeling to understand and mediate the competition for water between agriculture development and environmental health: murrumbidgee River basin, Australia. Hydrology and Earth System Sciences, 18 (10), 4239–4259. doi:10.5194/hess-18-4239-2014.
- Ward, F.A. and Pulido-Velazquez, M., 2008. Water conservation in irrigation can increase water use. Proceedings of the National Academy of Sciences, 105 (47), 18215–18220. doi:10.1073/pnas.0805554105.
- Watts, D.J., 2002. A simple model of global cascades on random networks. Proceedings of the National Academy of Sciences, 99 (9), 5766–5771. doi:10.1073/pnas.082090499.
- Weedon, G.P., et al., 2014. The WFDEI meteorological forcing data set: WATCH forcing data methodology applied to ERA-interim reanalysis data. Water Resources Research, 50 (9), 7505–7514. doi:10.1002/2014WR015638.
- Wens, M., et al., 2020. Simulating small-scale agricultural adaptation decisions in response to drought risk: an empirical agent-based model for semi-arid Kenya. Frontiers in Water, 2, 15. doi:10.3389/frwa.2020.00015
- Wheaton, E., et al., 2005. Lessons learned from the Canadian drought years of 2001 and 2002: synthesis report. Innovation, (11602). Available from: http://www4.agr.gc.ca/AAFC-AAC/display-afficher.do?id=1256667063661&lang=eng
- Wilensky, U. and Rand, W., 2015. An introduction to agent-based modeling: modeling natural, social, and engineered complex systems with NetLogo. Cambridge: MIT Press.
- Windrum, P., Fagiolo, G., and Moneta, A., 2007. Empirical validation of agent-based models: alternatives and prospects. JASSS, 10, 2.
- Yoshikawa, S., et al., 2014. Illustrating a new global-scale approach to estimating potential reduction in fish species richness due to flow alteration. Hydrology and Earth System Sciences, 18 (2), 621–630. doi:10.5194/hess-18-621-2014.
- Zhang, Z., et al., 2014. Groundwater dynamics under water-saving irrigation and implications for sustainable water management in an oasis: tarim River basin of western China. Hydrology and Earth System Sciences, 18 (10), 3951–3967. doi:10.5194/hess-18-3951-2014.