
 ?Mathematical formulae have been encoded as MathML and are displayed in this HTML version using MathJax in order to improve their display. Uncheck the box to turn MathJax off. This feature requires Javascript. Click on a formula to zoom.
ABSTRACT
Predicting future water demands of societies is a major challenge because it involves a holistic understanding of possible changes within socio-hydrological systems. Although recent research has made efforts to translate social dimensions into the analysis of hydrological systems, few studies have involved citizen participation in water footprint analysis. This paper integrates time series with citizens’ perceptions, knowledge and beliefs concerning sanitation elements to account for municipal blue and grey water footprints in São Carlos, Brazil, from 2009 to 2016, and potential water footprints in 2030 and 2050. In this case study, grey footprint potentially exceeds the blue water footprint by up to 35 times, and volunteered information suggested a reduction in water consumption, larger garbage production and greater investment in sanitation infrastructure from authorities. We conclude that public knowledge can be used to delineate possible water footprint scenarios and reveal paradoxes in the coevolution of socio-hydrological systems on an urban scale.
Editor S. Archfield Guest Editor F. Nardi
Introduction
The concept of a water footprint is used to call attention to the direct and indirect uses of water for human consumption. Water is consumed directly in agricultural production, industrial activity and domestic use, but it is also consumed indirectly through the trade in goods and services across countries and regions. The water footprint draws attention to the importance of the consumption patterns and lifestyles embedded in indirect use for overall water use. The water footprint has been compared across cities, regions and countries to illustrate wide differences in overall consumption (Kumar and Pavithra Citation2019, (Chapagain and Hoekstra Citation2008, Hoekstra and Mekonnen Citation2012, Liu et al. Citation2012, Ercin and Hoekstra Citation2014, Zhao et al. Citation2019), and at municipal scales (Paterson et al. Citation2015), Water footprints are often compared across cities and countries (Jenerette et al. Citation2006), incorporated into and included in discussions of virtual water trade components (Vanham and Bidoglio Citation2014), used to analyse the evolution of domestic demands (Cai et al. Citation2019) and address a socio-hydrological approach at global scale (Hossain and Mertig Citation2020).
Water footprints are often produced from the top down using data from international, national and regional agencies to calculate internal and external consumption, or from the bottom up using information provided by citizens to infer direct and indirect consumption patterns. The formal definition of citizen engagement for scientific purposes (Catlin-Groves Citation2012, Burgess et al. Citation2017), has been used for decades to address a number of scientific gaps, including the water research agenda (Buytaert et al. Citation2014, Assumpção et al. Citation2018), where volunteers usually play the role of sensors in monitoring hydrological variables. Recent studies (McKee et al. Citation2020, Mondino et al. Citation2020) have started to engage citizens not only to monitor the environment, but also to assist in understanding the feedbacks of hydrological processes on human behaviour and, in turn, the impacts of human behaviours on the hydrological system.
There is growing interest in the scientific community about how to incorporate human social systems and hydrological processes. This field has emerged as socio-hydrology (Sivapalan et al. Citation2012), which seeks to integrate social and hydrological systems to highlight their interconnections, feedbacks and unintended consequences. In the context of this integrative approach to human aspects in hydrology, it has been proposed that new mathematical models should adopt a holistic perspective that views social drivers as endogenous to the system, with outcomes reflecting the interplay between humans and hydrology (Elshafei et al. Citation2014, Sivapalan and Blöschl Citation2015, Blair and Buytaert, Citation2016, Pande and Sivapalan Citation2017). Thus, many studies were conducted under this modelling approach that have led to an understanding of many varied hydrological processes, such as the evolution of household demands (Garcia et al. Citation2016, Gonzales and Ajami Citation2017), urban floods (Di Baldassarre et al. Citation2015, Buarque et al. Citation2020), development in rural catchments (Van Emmerik et al. Citation2014, Sanderson et al. Citation2017) and the collapse of ancient civilizations (Kuil et al. Citation2016). Although these socio-hydrological studies accomplished their goals of identifying and describing emerging phenomena (Di Baldassarre et al. Citation2019), Srinivasan et al. (Citation2017a) note that attention is needed to engage stakeholders in future socio-hydrological studies to elicit issues that users see as important to systemic dynamics and credible storylines of the future (Gober and Wheater Citation2015, Xu et al. Citation2018, Brelsford et al. Citation2020).
The rapid dynamics of every Brazilian urban scale is frequently affected by progressive legal enactments which constraint envisioning water governance scenarios, which impair paradoxes due to both database quality and social unawareness (Schulz & Ioris, Citation2017). On the one hand, some federal acts did introduce potential coevolution of water governance. Examples are the federal enactments of water resources systems (#9.433; Brazil, Citation1997), urban water systems (#11.445; Brazil, Citation2007), climate change (#12.187; Brazil, Citation2009), citizen protection and engagement (#12.608; Brazil, Citation2012), and the new sanitation legal framework (#14.026; Brazil, Citation2020). In contrast, new drivers between water and human systems has promoted the fragmentation of top-down actions, with a non-continuous database. This also provokes paradoxes of a lack for sustained social engagement sensitive to valuing past time series records for future robust scenarios. However, top-down frameworks have introduced disruptive social apathy of how citizen engagement can proactively help on empowering water governance scenarios (Klink et al., Citation2020). Moreover, decentralization, participation and deliberation in water governance, all elicited in the afore-mentioned enactments, bump into local scale constraints (Brandeler et al., Citation2014). On the other hand, following other South American cases, the Brazilian local scale dynamics are still fragmented in terms of the lack of representativeness and uncertainty of socially-driven water databases (Tadei, Citation2011), cultural belief imbalance (Figureoa & Kincaid, Citation2010) and lack of social proactiveness or engagement towards urban waters (Ioris, Citation2012). Thus, new insights for ameliorating either the partially-gauged urban water variables or citizens’ lack of proactiveness are recently proclaimed in the New Sanitation Legal Framework (Brazil, Citation2020), as well as in the Brazilian Water Security Plan.
The objective of this study is to integrate open datasets with citizens’ knowledge to better understand the interactions between humans and the hydrological system, as expressed in the water footprint of sanitation processes on a municipal scale. The working hypothesis is that quantitative outputs from citizens’ knowledge, based on their personal experiences, consumption patterns and beliefs, might outline alternative water demand scenarios. For this purpose, we used the Water Footprint Assessment method to quantify direct and indirect demands of water from 2009 to 2016. We also built possible scenarios for blue and grey water footprints in sanitation processes through statistical analyses of those time series, and we conducted a survey of local citizens from São Carlos, Brazil. The article begins with a description of the case study, which highlights its essential aspects, such as the demographic aspects, sanitation system facilities and climatic characterization that might influence the outputs. Next, we depict the methodology of water footprint accounting and citizen participation, followed by the presentation and discussion of results. Finally, we summarize the main conclusions and lessons learned that could contribute to the existing literature.
Case study
This work examined the demands of the São Carlos municipality, located in São Paulo state, in the Southeast region of Brazil (). Two river basins split the municipality surface area. Although most of this area is situated in the Mogi Guaçu River Basin (MGRB), the urban area is established in the Tietê-Jacaré River Basin (TJRB), and therefore the municipality is under the surveillance of the Tietê-Jacaré River Basin Committee (TJ-RBC).
Figure 1. Mapping the case study. (a) Location of São Paulo State on a map of Brazil; (b) river basin thresholds in São Paulo state; (c) São Carlos city limits, showing the water bodies and sanitation facilities
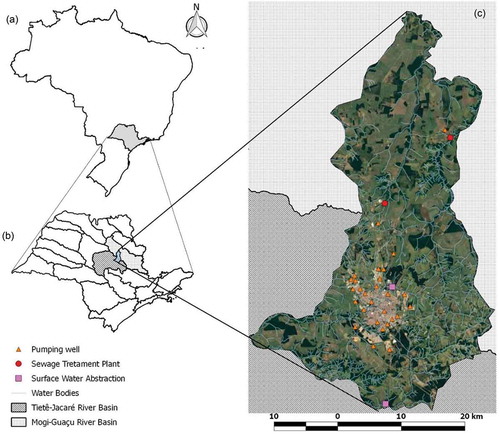
The municipality of São Carlos, with a surface area of 1136.907 km2, had a population of 234 002 in 2016, 96% of whom lived in the urban area. According to SEADE (Citation2018), the population is expected to increase up to 2035, and then to decrease (see supplementary material in Souza Citation2020). In the context of sanitation systems, the local company provides the water supply and sewage collection service. According to the Brazilian Sanitation Information System (SNIS), during 2016, the whole population of São Carlos was served by the water supply service (SNIS Citation2018), which has several pumping wells spread around the city and relies on two surface water abstraction points, one in the Feijão Creek and another in the Espraiado Stream. Conversely, only the urban region of the municipality is attended by sewage system services. The sewage is collected and taken to one of three treatment plants; two are located close to the city and the other is more distant. One private company, responsible for collecting domestic waste, has provided solid waste management service since 2013. It also operates the current sanitary landfill, which started functioning in 2013. Based on 2015 data, the economic scenario is represented by the services sector, which has the largest share of value added at 60%, followed by industry at 30% and finally the agricultural sector, representing less than 2% (SEADE Citation2018).
In terms of climatic characterization, the local climate is Cwa, according to the Köppen climatic classification, with an annual precipitation average of 1361 mm and an annual average temperature of 21.5°C (EMBRAPA Citation2019). Cavalcanti et al. (Citation2015) indicate that the region presented an annual average temperature growth of 2°C from 1960 to 2009, while the observed annual precipitation average increased by 1 mm/day. Cavalcanti et al. (Citation2015) further indicate that the average temperature for some seasons will probably increase by up to 4.5°C, while precipitation records may experience a reduction of up to 10%.
In terms of water resource demands for consumptive purposes, two databases were used in this study. The first one is the Situation Report (SR) published annually by the TJ-RBC. Among other types of information, the report describes all demands according to their purpose, which can be classified as urban demand, industrial demand or rural demand. Furthermore, these demands are also classified according to their origin, such as surface or groundwater. According to the latest SR, based on 2016 (CBHTJ Citation2017), the urban water demand was 8 times higher than the industrial demand, while the rural demand was 20 times lower than the urban demand. Regarding the origin of water, the groundwater sources meet about 80% of the total demand (CBHTJ Citation2017). According to the second database used (SNIS Citation2018), the water consumption per capita rose from 174 L/d in 2009 to 223 L/d in 2016 (see supplementary material in Souza Citation2020). Moreover, the SNIS points out that the losses in water supply due to leakages at this time were around 50%.
Methodology
The flowchart in illustrates the process we followed to meet the objectives of this work: accounting for blue and grey water footprints at an urban scale in sanitation processes. The sanitation system, according to the federal enactment #14026 (Brazil Citation2020), comprises water supply, wastewater treatment, garbage collection and stormwater drainage. First, we selected the temporal and spatial scales to understand the processes that occur within the study area (Blöschl and Sivapalan Citation1995). Since our focus is to account for water demands at a municipal scale, our spatial scale is the municipality limits of São Carlos, which encompass both urban and rural areas. Although climatic, hydrological and resource consumption present monthly variations, this work estimates the yearly water footprints to capture these variations throughout the year between 2009 and 2016, but addressing seasonality is strongly recommended when data is available. For the future, we performed a statistical analysis from the historical data, and we engaged citizen participation to help in building scenarios for 2030 and 2050.
Figure 2. General methodology proposed to account for blue and grey water footprints in sanitation processes on an urban scale, including both time series and citizen participation
Therefore, we followed the guidelines proposed by Hoekstra et al. (Citation2011) to quantify the direct and indirect municipal water demands, defined as water footprint accounting for a municipality. According to these authors, the water footprint can be split into three components to better quantify it. The blue water footprint (BWF) refers to direct abstraction from water bodies to meet human and economic demands. The grey water footprint (GWF), in turn, indicates the indirect water demand needed to dilute pollution loads to meet regulated standards of potability. Finally, the green water footprint quantifies the amount of water retained in the soil by plant roots, or the fraction that returns to the atmosphere as evapotranspiration. In this paper, we account for BWF and GWF, because they are directly included in sanitation processes from domestic activities in urban environments, water delivery, wastewater treatment and garbage production.
The next step was to check the availability of data for the study area (). Some databases are publicly available, but they are not interconnected. Thus, we compiled all of the relevant information together in our database to determine which data could be useful for water footprint accounting and what information was missing. For example, we did not find information regarding the volume of leachate production, so we developed a new approach to quantify the water footprint involved in this process. Afterwards, we selected the variables that could be quantified, observed and reported by citizens who live within the study area, based on their personal living experiences. We proposed questions based on these observations that would enable us to understand and account for personal consumption patterns from locals and learn how they imagine the indirect variables involved in water demands could change in future.
Table 1. List of datasets used in this work to account for the blue water footprint (BWF) and the grey water footprint (GWF) at the municipal scale. BRL: Brazilian real; GDP: gross domestic product
Volunteer participation
To investigate the humanistic perspective, a volunteer participation approach was deemed appropriate for this research. A set of questions with quantitative and qualitative purposes was designed, and is presented in . Face-to-face interviews were conducted by the authors in three public spaces within the study area to reach a diverse sample. On December 2018, we visited shopping malls, the city centre and the municipal bus station to gather information. Fifty citizens volunteered to participate in the research, and the sample selection process followed a non-probability convenience (Lavrakas Citation2008, Bornstein et al. Citation2013). To meet the purposes of the research, an exclusion criterion process was recommended to engage a representative target population. The selected criteria were used to exclude volunteers who (1) had lived in São Carlos for less than 10 years and/or (2) could not answer the questions about personal consumption.
Table 2. Questions asked of volunteers who live in the case study area. Question 1 (which included four parts, a–d) allowed us to characterize the citizens who participated in this study. Question 2 (in parts a–d) asked about the indirect consumption of drinkable water in their residences. Question 3(a–d) asked about the solid waste produced in the volunteer’s residence. Question 4(a–d) aimed to understand people’s beliefs regarding changes in sanitation investments. Questions 5–9 provide an overview of volunteers’ knowledge and awareness about water processes within the place where they live
Once a volunteer who met the criteria agreed to participate, the interviewer introduced the project description and the consent form (which was first approved by the University Ethics Committee (USP) because the study involves human participation; see supplementary material in Souza Citation2020). The use of this approach was necessary due to restrictions on time and resources; however, to minimize limitations of convenience sampling (Bornstein et al. Citation2013) and allow the data to fit to the purpose of the study (Lavrakas Citation2008), the exclusion criteria were rigidly applied. Fifty participants were found to be an adequate sample size to perform a Student’s t-test. We acknowledge the limitation that extrapolating the results for the whole city based on this sample set may produce some bias in the result, therefore no such claims have been made. The quantitative questions illustrated in aim to identify the behavioural aspects of local residents in terms of water consumption, garbage production and individual beliefs. The importance of the convenience sampling strategy is further justified by three main reasons: (1) every quantitative question has a particular standard deviation that implies a different population’s representativeness (Edgar and Manz Citation2017); (2) the statistical parameters from the population are unknown and, therefore, a probabilistic sampling method might lead to ill-suited samples (Jager et al. Citation2017); and (3) this work provides neither predictions about the future in São Carlos, nor generalizable outcomes for similar case studies; rather, it is a starting point to address how citizens’ perspectives differ from traditional scenario-building on water demands.
Formulation of questions
The questions numbered 1 to 4 have quantitative purposes. They were used to elicit understanding of personal consumption patterns and to translate participants’ beliefs about investment in sanitation structures at different points in time: 10 years ago, the moment when the questions were asked, and future scenarios from 2030 and 2050. Since the reference unit is the residence, the aim of question 1 () is to find out how many people live in the same house as the interviewee. The number of residents may vary over time, as well as their collective consumption. Next, question 2 was proposed to indirectly determine the volume of water that was/is/will be consumed by the number of people indicated in question 1. We can quantify this volume through the average annual water price, in Brazilian real (BRL)/m3, which is available at SNIS (Citation2018). Then, question 3 was aimed at understanding how household waste production has changed over the last 10 years and how citizens think it will change in the future. To quantify this variation, we asked the volunteers how many plastic garbage bags their residences usually produce for the same period as the previous questions (10 years ago; present; 2030 and 2050). This question was formulated based on a common habit in Brazilian cities, whereby people throw out their household waste in supermarket plastic bags which a garbage truck comes and picks up (Moura et al. Citation2018). Therefore, we used these plastic bags as a reference unit to make it easier for citizens to quantify the variation in their waste production over time. The last quantitative question focuses on translating the importance given to sanitation infrastructure by local authorities to enhance water quality (Dadson et al. Citation2017). For this purpose, we designed question 4, which asks what fraction of municipal financial resources is allocated to sanitation systems, on a percentage scale. We intended to capture the variation in the investments made by local authorities over the years, to enable us to quantify the GWF. This information will be explained in detail later on in this section. Finally, we asked several qualitative questions (those numbered 5 to 9). These were designed to check whether citizens recognize the most fundamental elements of sanitation in the city and whether they are concerned about not having sufficient water for future generations by the end of the century.
Details on the processes, assumptions and hypotheses involved in the procedure to calculate each water footprint are given below.
BWF accounting methodology
In this study, the BWF fraction represents household demands, which comprise domestic water consumption and the percentage of losses occurring in water transportation pipes (Varriale Citation2018), whose time series data between 2009 and 2016 are available at SNIS (Citation2018). Thus, we can find the annual volume of losses during water distribution using EquationEquation (1(1)
(1) ) (PMSC Citation2012), and the total household demand can be obtained with EquationEquation (2
(2)
(2) ), where
is the annual volume of water losses due to leakages in the water network (m3/year),
is the annual volume of water consumed by residences (m3/year),
is the index of losses in water networks (%) and
is the annual household demand (m3/year).
We built possible BWF scenarios using the demography projections from SEADE (Citation2018), the historical average leakage rate (SNIS Citation2018) and three calculation procedures to estimate the annual consumption per capita: (1) the confidence interval based on the statistical inference of the average water consumption per capita between 2009 and 2016 (SNIS Citation2018) using the Student’s t-distribution at a 95% confidence level; (2) the individual daily consumption adopted in the Municipal Master Plan of São Carlos - MMPSC (PMSC, Citation2012), which corresponds to 200 L/d per person – also suggested by several national handbooks (Von Sperling Citation1995, Tomaz Citation2000, Tsutiya Citation2006); and (3) responses for question 2, which were based on how volunteers believe their water bills will change according to the number of residents in the home, changes in individual water consumption patterns and growth in water tariffs. Thus, the annual volume of water consumed by residences in São Carlos was obtained from the product of population projections for the city and the individual water consumption average.
GWF accounting methodology
Regarding the GWF, we split it into two categories because of different sources of pollution within sanitation processes. The first one is related to emissions from the treated domestic wastewater in the water bodies. In this study, all these effluents come through sewage pipelines; they are properly treated in one of the local sewage treatment plants and then they are ultimately discharged into the closest river. The annual volume of collected sewage was obtained from SNIS (Citation2018), while the remaining polluting load is available from the SR published by the TJ-RBC. Thus, we used EquationEquation (3(3)
(3) ) (Tucci Citation2017) to calculate the dilution volume
due to treated wastewater, where
is the annual volume of wastewater (m3/year) production in São Carlos,
is the biochemical oxygen demand (BOD) (mg/m3) of treated waste water discharged in São Carlos’ water bodies,
w is volume of water (m3/year) needed to dilute the polluting loads
and reach the target BOD
,
is the BOD for the dilution volume (1 mg/L), and
is the accepted BOD (mg/m3) of the nearest water body, according to the classification established by Resolution 357 of the National Environment Council (CONAMA).
To calculate the volume needed to dilute household effluents in the future, it is necessary to have at hand the volume of sewage produced by the population and the respective polluting load. We used two methods to determine the annual volume of sewage production per capita in 2030 and 2050: (1) the confidence interval, based on the time series from 2009 to 2016; and (2) the average daily volume of sewage produced per person, based on the individual water consumption from the MMPSC and the return rate recommendation from Von Sperling (Citation1995), which is 160 L of wastewater per day per person.
Regarding the polluting load, we performed a linear regression to establish the polluting load () as a function of annual investments in sewage infrastructure (in the local currency, BRL). For this purpose, we transformed the value of investments made in previous years into their net present value (NPV) using the time series of the Brazilian annual consumer price index (CPI), which measures the inflation in Brazilian cities. Since we do not know how much will be invested in the future, we normalized these investments into a fraction of municipal gross domestic product (GDP) and created two conditions. In the first condition, we assumed that the future investments would be the average of preceding percentages, while in the second we assumed that this fraction would change at the same ratio as the answers to question 4 (shown in ). Finally, we obtained the value of investment for future scenarios assuming that the municipal GDP would follow the national GDP growth rate. For example, if 1% of São Carlos’ GDP is invested in sewage infrastructure today and the average of responses indicates that it will increase by 50%, we multiply the future GDP by 1% and then by 1.5 in order to find the value that will be invested. Next, this amount is used as the input data in our equation obtained by the linear regression for
as a function of investments in sewage infrastructures.
The second component of the GWF is the volume needed to dilute the polluting load due to the leachate from the municipal sanitary landfill. As we did not find any existing model that translated the processes of the leachate production, we developed our own model to calculate the GWF according to Steps 1–4 below. To perform this accounting, we consulted the State Inventories of Domestic Waste, which have been released yearly since 2003 by the Environmental Company of São Paulo State (CETESB). In these reports, the company has published the daily average production of household waste (tons/day) over the last several years. Considering that the current sanitary landfill began operations in 2013, that it has a capacity of 2.2 million tons and its surface area is 0.2 km2, we made the following calculations.
Step 1: Calculate how many years it would take to reach its full capacity, based on EquationEquation (4
(4)
Step 2: Calculate the volume of leachate from the sanitary landfill over the
Step 3: Calculate the equivalent leachate volume for each year from EquationEquation 6
Step 4: Calculate the dilution volume
EquationEquations (4)(4)
(4) to (7) were created to estimate not only the future GWF of sanitary landfill, but also the past GWF, since they rely on the garbage production intensity and the consequent landfill life cycle. We expect that the different methods to estimate garbage production will imply a different GWF for every year considered. In addition, the method implies that the optimum GWF happens for a smaller surface area, less time of exposure to rain regimes (EquationEquation 5
(5)
(5) ) and less domestic waste production (Equation 6).
Results and discussion
While the water footprints for previous years were accounted based on historical data, possible scenarios for 2030 and 2050 ranged according to the different calculation methods used. We begin with a discussion on the quantitative results regarding the water footprint assessment method. The results are presented in separate graphics to isolate the water footprint of each sanitation component (water consumption, treated wastewater and landfill leachate) and to highlight the contribution of citizens’ participation in the scenario building process.
presents the statistical results for each answer to the questionnaire in , including the average, standard deviation, and upper and lower limits of the Student’s t-test for the 95% confidence interval. The responses presented a large standard deviation for all quantitative questions. Regarding the answers on water bills and garbage production, such high deviations might have resulted from the experimental design, which opted to seek subjects in public places visited by a heterogeneous audience, so that we would be able to capture several consumption patterns. Similarly, the responses regarding changes in sanitation investments also presented a high variation. This could be either a consequence of different beliefs or the result of a lack of knowledge on that aspect. Since the historical data reveals that investments in the sanitation sector did not exceed 1% of municipal GDP over the last 10 years, we assumed that the actual values do not represent the real fraction of investments. However, we considered the rate of change suggest by the volunteers in our computation. For example, if a subject stated that the current investment is equal to 2% of municipal GDP and it will be 3% in the future, we calculated an increase of 50% of this fraction for the possible scenario. Surveying data in urban environments, where citizens display heterogeneous conditions of preferences and behaviours, was an attempt to capture the variability of the population in this experiment. However, a relatively small sample was selected for this initial study, and therefore more sophisticated probability sampling methods and a larger sample size would be key factors in addressing the reduction of sampling bias in future experiments.
Table 3. Results of questions asked to volunteers (see ). The results present the average for each variable obtained from the respective questions. *Indicates that water bills were transformed into net present value
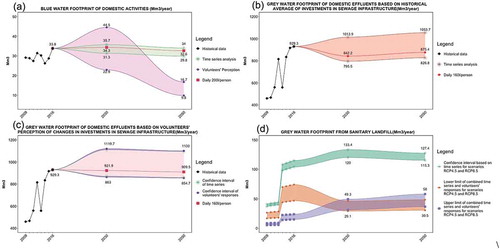
Figure 3. Outcomes for blue water footprint (BWF) and grey water footprint (GWF) accounting from the sanitation processes in the case study. (a) BWF from domestic demands; (b) and (c) GWF accounting for domestic wastewater processes; (d) GWF accounting for leachate production within the municipal sanitary landfill. Scenarios in (b) consider that investments in wastewater treatment in 2030 and 2050 will receive the same historical average fraction of municipal GDP in the future, while (c) considers this fraction as indicated by volunteers in question 4 from ; (d) provides possible storylines for GWF considering projections based on time series analyses of solid waste production, answers from volunteers for question 3, in , and projections of climatic variable for scenarios RCP 4.5 and RCP 8.5
BWF results
) presents the historical domestic BWF from 2009 to 2016, represented by a straight black line, and the possible scenarios for 2030 and 2050, following the three methods detailed in the methodology. The first method, represented by a red line and square markers, follows the MMPSC recommendations for a daily average individual water consumption, which is 200 L per person per day. We reinforce that the differences for each year, for this method, are a consequence of demography projections from SEADE (Citation2018), because the individual consumption remains the same. The population is expected to grow up to 2035 (see supplementary material in Souza Citation2020). The second method, represented by green lines and the star markers, is the historical consumption per capita based on the time series analysis, which ranges between 182 and 208 L/d per person, at a 95% confidence level. Lastly, the third method, represented by purple lines and round markers, was based on the responses from volunteers and indicated that, in comparison to the present, their consumption in terms of water bills (BRL/person in present net value) was 3% higher 10 years ago, and they expect it will be 12% lower in 2030 and 64% lower in 2050.
More attention should be given to the third method, because it outlines possible demands for the uncertain future. The responses from volunteers showed a larger variation for 2030 than for 2050, but presented a substantial, and convergent, decrease for the later. The purpose of this discussion is not to agree or disagree with the results, but to understand what led citizens to indicate that their consumption will change, and to examine in what direction those changes point. For both scenarios, the average (see ) indicated a reduction in individual consumption. We raise two possibilities for such behaviour: an experimental design issue or a manifestation of environmental awareness.
When we designed the experiment, we opted for the water bill variable to infer changes in water consumption, for the sake of measurability and familiarity on the part of the lay citizens. Although water consumers know how much they pay now and how much they used to pay for the water service, they might not be aware of the factors that led to tariffs changing over time. Although water consumption has a causal effect on water bills, other elements also affect how much people pay for water services and the way this changes over time, i.e. inflation and conservation policies. For this reason, we added an extra question at the beginning of the interview to make them think about those additional elements that impact on the price they pay in the present in comparison to the price they used to pay in the past. However, when we asked them about the price they will pay in the future, we expected they would consider changes in the number of consumers who will live in their homes, changes (or not) in their consumption patterns and those additional elements that yearly affect the water tariffs. These later “elements” open up room for uncertainty and, therefore, might have biased the responses, especially for the far future, which is surrounded by uncertainties.
The other possible explanation for the decrease in expected water consumption might be a purposeful manifestation of an environmental concern that can be illustrated using psychological theories. Fransson and Gärling (Citation1999) identified a number of reasons why a group of people might be more or less aware about ecological issues. Also, Larson et al. (Citation2009) reviewed three elements from the attitude theory that impact on environmental perspectives: the affective component, which is the personal feeling we have about a subject; the cognitive component, representing one’s personal beliefs on the reasons about consequences of a topic; and the conative component, which is the way we act or behave. Illustratively, the alternative reasons that may explain the expected decrease in water consumption are the fear of water scarcity (effective), the belief that water availability might not meet the demand in the future (cognitive), or the implementation of conservation behaviour to avoid water shortages (conative). We emphasize that these are only possible explanations and must be properly addressed by specific psychological experiments and clinical assays.
GWF results
The GWF was split into two parts. The first part accounted for the volume needed to dilute domestic effluent discharges into water bodies, and the second involved the production of sanitary landfill leachate, which has high BOD values.
Regarding the wastewater GWF, we determined the volume of domestic sewage production per person for 2030 and 2050 using the methods described in the Methodology section: (1) the combination of individual daily water consumption (from the MMPSC) with a return rate of 0.80 (recommended by Von Sperling Citation1995), which is equal to 160 L/d per person; and (2) the confidence interval based on the time series, which ranged from 55.16 to 70.30 m3/year per person.
Next, we performed a linear regression to determine the relation between polluting load concentration in domestic effluent after treatment (BOD kg/m3) and investments made in sewage infrastructure (BRL/year in net present value). The trend line presented R2 equal to 0.67 based on the time series for São Carlos (SNIS Citation2018) between 2009 and 2016. The regression line is presented in the supplementary material (in Souza Citation2020), where the independent variable is the amount of investments made in the sewage infrastructure in São Carlos (106 BRL) and the dependent variable is the polluting load of domestic effluents after treatment (BOD kg/m3). Afterwards, we transformed these investments into a fraction of São Carlos’ GDP. This fraction was estimated from total investments for the period between 2009 and 2016, while for 2030 and 2050 we created two scenarios. The first was based on the local citizens’ responses to question 4 (). The participants asserted that those investments would be 40% and 73% higher in 2030 and 2050, respectively, compared to the present (0.01% in 2016). The second scenario assumed the historical average fraction, based on the time series from 2009 to 2016 – that represents almost 0.04% of the municipal GDP (SEADE Citation2018, SNIS Citation2018) – and GDP projections for 2030 and 2050 (EPE Citation2015). Thus, to determine the GWF corresponding to the dilution volume for treated domestic effluents, we used EquationEquation (3)(3)
(3) . The outcomes for these two methods – time series analysis and volunteers’ perceptions – are presented in ) and (c), respectively. The graph in ) presents higher values than ) not only because of the difference between the historical (0.04%) and volunteers’ average (0.014% and 0.017% for 2030 and 2050) investments that led to higher BOD concentrations in treated wastewater, but also because of the larger confidence interval analysis in volunteers’ responses, represented by the darker area in ), which increases the uncertainty. In other words, the lower the investment, the higher the pollutant load and, consequently, the more water for dilution.
) presents the annual volumes of water needed to dilute the leachate from São Carlos’ sanitary landfill. As the company responsible for operating the sanitary landfill began operating in 2013, and the amount of daily domestic solid waste collection has increased since 2013, we decided to establish the confidence interval as of 2013, which presented values ranging from 0.89 to 0.90 kg/d/person. The immediate consequence of this fact is that the dilution factor presented very little variation within the confidence interval of garbage production per person. The only significant changes regarding the time series analyses are consequences of climatic variations (rain and evapotranspiration) that resulted from the scenarios RCP 4.5 and 8.5. Alternatively, as the time series may properly reflect possible changes in solid waste generation, we used the volunteers’ responses to perform this projection. According to the volunteers, individual household waste production will probably increase to 3% and 12% when comparing 2030 and 2050, respectively, to the present.
The high production of domestic waste leads to the reduction of the sanitary landfill’s useful life. Nevertheless, at some point there will be an inflection: although the shortening time of the sanitary landfill operation leads to less volume of leachate, the weighing factor in EquationEquation (6(6)
(6) ) (
) may be large enough to overcome the benefit of having a landfill exposed for a short period of time. This is what happened with the outcomes from volunteers’ perceptions, in ). Although the growth in waste production leads to a reduction in the sanitary landfill’s useful life, the corresponding leachate for each year i
is higher than that in the analysis based on the time series. It is also interesting to note that scenario RCP 4.5 for both methods – volunteers’ perception and statistical analysis – presented higher volumes of leachate than did scenario RCP 8.5. This is because the volume of precipitation exceeded the volume of evapotranspiration.
The three curves in ) represent different outcomes for two methods of analyses. The green one with star markers presents the range of outcomes from scenarios RCP 4.5 to RCP 8.5 based on the time series analysis of solid waste production. Since the upper and lower values of the confidence interval for the time series are not high, the variance is caused by the difference in precipitation and potential evapotranspiration of those climate change scenarios, which is equal to the volume of leachate produced over time. The results presented higher values for RCP 4.5 and lower ones for RCP 8.5. Meanwhile, the orange curve with round markers and the purple curve with square markers indicate the variance in the GWF based on historical data for solid waste production from 2009 to 2016 plus the upper and lower limit intervals of volunteers’ responses, respectively, for possible changes of solid waste production in 2030 and 2050 considering the aforementioned RCP scenarios. Similarly to the green curve, the orange and purple ones have higher volumes of GWF for RCP 4.5 than RCP 8.5. In this graph, the highest and lowest values for each method are highlighted for 2016, 2030 and 2050.
For all three curves in ), there are two noteworthy points: the high increase for all cases in the period between 2012 and 2013, and the changing behaviours from 2016 to the possible future scenarios. The first one happens because of the records of solid waste production that match the period when the company currently responsible for solid waste management in São Carlos began its operations. The latter one occurs because of the pace of waste production that can increase or decrease the useful life of the sanitary landfill and, consequently, the volume of leachate.
Combined BWF and GWF
Finally, provides a complete picture of the water footprint of sanitation systems in São Carlos from 2009 to 2016, and possible scenarios of the water footprint in 2030 and 2050. The BWF component combines the historical data of domestic and economic activities for previous years, while it provides favourable and unfavourable scenarios for 2030 and 2050 in terms of water security – a lower water footprint is better for society and the environment. Similarly, the GWF component combines two elements: the water required to dilute pollutants from treated wastewater discharge, and leachate from the municipal sanitary landfill. However, for the former element we computed the historical data, while the latter comprised the average of all outputs presented in ) for each year between 2009 and 2016. Considering the 2030 and 2050 scenarios, presents possible footprints in terms of water security by combining the two lowest elements of GWF for the favourable scenario and the two highest GWF elements for the unfavourable scenario.
Figure 4. Water security assessment of possible scenarios. The figure breaks down the two components of the water footprint for previous years and provides favourable and unfavourable scenarios for 2030 and 2050. The left-hand y-axis refers to the bar plots, which is the municipal water footprint in Mm3 per year, while the right-hand y-axis refers to the markers, which give the yearly individual water footprint in m3 per capita per year. BWF: blue water footprint; GWF: grey water footprint
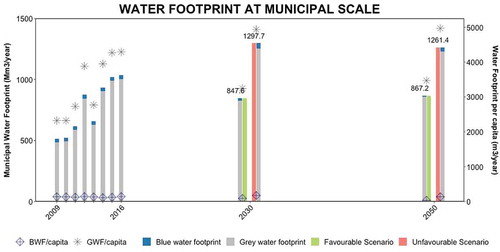
Although the comparison in reveals that GWF is responsible for most of the total water footprint, the sewage collection and wastewater treatment services provided by the local company are essential for presenting good results compared to other Brazilian cities, where most sewage is not treated or even collected. In addition, the GWF of treated wastewater did not include the advantage of ecosystem services provided by aquatic bodies (Taffarello et al. Citation2020). Thanks to the natural capacity for BOD depletion in rivers, the total load of BOD pollution diminishes until it reaches a better quality. This means that the pollutant load will decrease and, consequently, the GWF will follow the same ratio.
Additionally, presents the individual water footprints for the sake of comparison across different case studies. One relevant aspect is the ratio GWF/BWF, which represents how many times larger GWF is than the BWF. For the period between 2009 and 2016, this ratio ranged between 17 and 35; these are much higher values than the outputs from studies conducted by Hoekstra and Mekonnen (Citation2012) and Vanham and Bidoglio (Citation2014). In addition, our study offers a different approach from that of Cai et al. (Citation2019) in Chinese cities, where water footprints per capita decreased over time. We built possible optimistic and pessimist storylines with the assistance of volunteers that show decreased or increased water footprints, respectively. These two particularities, the GWF/BWF ratio and the evolution of the municipal water footprint, reinforce the need to comprehend how different regions consume water and how this consumption might change in the future, from the perspective of historical data and from the point of view of local inhabitants.
Analysis of volunteers’ responses about sanitation systems in their city
In addition to the questions regarding the quantitative aspects, we also verified whether volunteers recognize key elements of the sanitation processes that have some relation to water quality and quantity in the municipality where they live. Numbers 5 to 9 in identify the questions with these goals.
The results to these questions are illustrated in , and they reveal that citizens’ knowledge is limited. Although most of them know which company is responsible for supplying water to their house, almost one-third of respondents in the sample do not know where the water comes from. It is surprising also that 40% do not know that domestic effluents, which leave their houses, go to the treatment plants and then they are discharged into water bodies. A small sample fraction responded that they believe it is treated and then goes back to their house for consumption, while others have no idea about what happens to the sewage. This fact reinforces the need to disseminate environmental education to the whole population to raise awareness about environmental conservation. If the population knew where the water comes from and the final destination of sewage, they could develop better attitudes towards water conservation and water-use efficiency (Gunda et al. Citation2019), and increase pressure on local authorities to protect water bodies and invest in sewage treatment. These principles meet the federal enactment #14026 that aims to provide Brazilian citizens with the basic sanitation services (Brazil Citation2020).
Figure 5. Responses from citizens to qualitative questions, where (a) represents the answers from all volunteers and (b) evaluates the number of answers according to their residence time in the case study
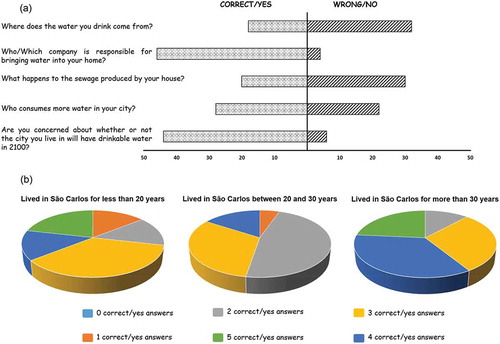
The results presented in also revealed that the residence time of volunteers in the city does not have a large impact on their knowledge about sanitation elements or their environmental awareness. While 21% of citizens who have lived in São Carlos for less than 20 years were able to answer all of the questions positively and correctly, no participants who have lived in the city between 20 and 30 years responded correctly to all five questions. However, almost 60% of the volunteers who have lived in the city for more than 30 years answered four or five of the five questions positively/correctly, while 16% of citizens who have lived in the city between 20 and 30 years and 35% of those who have resided there for less than 20 years performed the same. The lack of political will to utilize public participation and engagement in water management in the city may explain this lack of awareness. Further factors such as education, income or age might have a different impact and are valid avenues of study that could not be captured in depth for this research. Engaging volunteers to assist in decision-making processes about water resources, however, is an important issue that requires further in-depth investigation.
Conclusion and recommendations
This study addressed the water footprint concept through the engagement of citizens and an analysis of existing short time series to build possible scenarios of water demands regarding sanitation processes. The analysis focused on the water consumption for households – BWF – and the volume of water required to dilute pollutants from domestic sewage and leachate of sanitary landfills – GWF. The outcomes revealed that GWF of sanitation processes was in the range of 17 to 35 times higher than the BWF between 2009 and 2016, in a Brazilian mid-size municipality with 1137km2 hosting more than 230 thousand inhabitants. Additionally, we built alternative scenarios with the assistance of citizen participants, who outlined a substantial decrease in direct water consumption, growing garbage production and an increase in investments in sanitation facilities. Since the GWF was responsible for the highest demands, we recommend to better understand its processes in future studies, such as capturing the variation in the quality and quantity of leachate production throughout the year, as well as the seasonality of hydrological and climatic variables, the effect of BOD depletion from treated wastewater in water bodies and the real impact of investments in sewage treatment. These elements could improve the accuracy of results and provide a better picture of real human demands.
Regarding the volunteered information used to capture possible changes in behaviours, the results revealed that São Carlos’ citizens have increased environmental awareness in terms of water security for the region in which they live. This conclusion is a consequence of volunteers’ beliefs that they will save more water in long-term scenarios, and that investments in sanitation infrastructures will grow over time, compared to the present. Furthermore, most of the interviewees responded they are concerned about not having enough water by the end of the century.
The approach proposed in this study complements the traditional time series analyses because it addresses unexpected changes in individual behaviours that cannot be predicted. This is the role of public participation and volunteers’ engagement in this work: they provided an alternative method to outline potential water demand trajectories. Based on these possibilities, we recommend that policymakers adopt the water footprint indicator in official reports to assess the broad water security context at the municipal or river basin scale and use it as a strategy to communicate water consumption information to the local population. Additionally, although civil society is represented in many river basin committees, lay citizens have much to say and contribute to the management and planning of the water resources governance.
Disclosure statement
No potential conflict of interest was reported by the authors.
Additional information
Funding
References
- Assumpção, T.H., et al., 2018. Citizen observations contributing to flood modelling: opportunities and challenges. Hydrology and Earth System Sciences, 22 (2), 1473–1489. doi:10.5194/hess-22-1473-2018
- Blair, P. and Buytaert, W., 2016. Socio-hydrological modelling: a review asking “why, what and how?”. Hydrology and Earth System Sciences, 20 (1), 443–478. doi:10.5194/hess-20-443-2016
- Blöschl, G. and Sivapalan, M., 1995. Scale issues in hydrological modelling: a review. Hydrological Processes, 9 (3–4), 251–290. doi:10.1002/hyp.3360090305
- Bornstein, M.H., Jager, J., and Putnick, D.L., 2013. Sampling in developmental science: situations, shortcomings, solutions, and standards. Developmental Review, 33 (4), 357–370. doi:10.1016/j.dr.2013.08.003
- Brandeler, F., Hordjik, M., Schönfeld, K., 2014. Decentralization, participation and deliberation in water governance: a case study of the implications for Guarulhos, Brazil. Environment & Urbanization, 26 (2), 489–504. IIED. doi:10.1177/0956247814544423
- Brazil, G., 1997. Water resources system, federal law enactment # 9.433, Brasília-DF. Available from: https://www.planalto.gov.br/ccivil_03/LEIS/L9433.htm
- Brazil, G., 2007. Urban waters and basin sanitation, federal law enactment # 11.445, Brasília-DF. Available from: http://www.planalto.gov.br/ccivil_03/_Ato2007-2010/2007/Lei/L11445.htm
- Brazil, G., 2009. Climate change law, federal enactment # 12.187, Brasilia-DF. Available from: http://www.planalto.gov.br/ccivil_03/_Ato2007-2010/2009/Lei/L12187.htm
- Brazil, G., 2012. Civil protection system, federal law enactment # 12.608, Brasília-DF. Available from: http://www.planalto.gov.br/ccivil_03/_Ato2011-2014/2012/Lei/L12608.htm
- Brazil, G., 2020. New sanitation legal framework, federal law enactment #14026, BSB, DF. Available from: http://www.planalto.gov.br/ccivil_03/_Ato2019-2022/2020/Lei/L14026.htm [Accessed 20 Aug 2020]. (in Portuguese).
- Brelsford, C., et al., 2020. Developing a sustainability science approach for water systems. Ecology and Society, 25 (2), 23. doi:10.5751/ES-11515-250223
- Buarque, A.C.S., et al., 2020. Using historical source data to understand urban flood risk: a socio-hydrological modelling application at Gregório Creek, Brazil. Hydrological Sciences Journal, 65 (7), 1075–1083. doi:10.1080/02626667.2020.1740705
- Burgess, H.K., et al., 2017. The science of citizen science: exploring barriers to use as a primary research tool. Biological Conservation, 208, 113–120. doi:10.1016/j.biocon.2016.05.014
- Buytaert, W., et al., 2014. Citizen science in hydrology and water resources: opportunities for knowledge generation, ecosystem service management, and sustainable development. Frontiers in Earth Science, 2, 1–21. doi:10.3389/feart.2014.00026
- Cai, B., Liu, B., and Zhang, B., 2019. Evolution of Chinese urban household’s water footprint. Journal of Cleaner Production, 208, 1–10. doi:10.1016/j.jclepro.2018.10.074
- Catlin-Groves, C.L., 2012. The citizen science landscape: from volunteers to citizen sensors and beyond. International Journal of Zoology, 2012, 1–14. doi:10.1155/2012/349630
- Cavalcanti, I.F.A., et al., 2015. Atlas de Projeções de Temperatura e Precipitação e Suas Incertezas para o Estado de São Paulo. São José dos Campos, SP: INPE.
- CBHTJ, 2017. Relatório De Situação Dos Recursos Hídricos 2017. Araraquara. Available from: http://www.sigrh.sp.gov.br/cbhtj/documentos [ Accessed 7 Jan 2019]. (in Portuguese).
- CBHTJ, 2019. Comitê de Bacia Hidrográfica Tietê Jacaré - Relatório de Situação dos Recursos Hídricos. Available from: http://www.sigrh.sp.gov.br/cbhtj/documentos [ Accessed 7 Jan 2019]. (in Portuguese).
- CETESB, 2019. Companhia Ambiental do Estado de São Paulo - Inventário estadual de Resíduos Sólidos Urbanos. Available from: https://cetesb.sp.gov.br/residuossolidos/residuos-solidos/residuos-urbanos-saude-construcao-civil/publicacoes-e-relatorios/ [ Accessed 7 Jan 2019]. (in Portuguese).
- Chapagain, A.K. and Hoekstra, A.Y., 2008. The global component of freshwater demand and supply: an assessment of virtual water flows between nations as a result of trade in agricultural and industrial products. Water International, 33 (1), 19–32. doi:10.1080/02508060801927812
- Chou, S.C., et al., 2014a. Assessment of climate change over South America under RCP 4.5 and 8.5 downscaling scenarios. American Journal of Climate Change, 3 (5), 512–527. doi:10.4236/ajcc.2014.35043
- Chou, S.C., et al., 2014b. Evaluation of the eta simulations nested in three global climate models. American Journal of Climate Change, 3 (5), 438–454. doi:10.4236/ajcc.2014.35039.
- Dadson, S., et al., 2017. Water security, risk, and economic growth: insights from a dynamical systems model. Water Resources Reseach, 53 (8), 6425–6438. doi:10.1002/2017WR020640
- Di Baldassarre, G., et al., 2015. Debates—Perspectives on socio-hydrology: capturing feedbacks between physical and social processes. Water Resources Research, 51 (6), 4770–4781. doi:10.1002/2014WR016416
- Di Baldassarre, G., et al., 2019. Sociohydrology: scientific challenges in addressing the sustainable development goals. Water Resources Research, 55 (8), 6327–6355. doi:10.1029/2018WR023901
- Edgar, T.W. and Manz, D.O., 2017. Chapter 4 - exploratory study. In: T.W. Edgar and D.O. Manz, eds. Research methods for cyber security. Syngress, 95–130. doi:10.1016/B978-0-12-805349-2.00004-2
- Elshafei, Y., et al., 2014. A prototype framework for models of socio-hydrology: identification of key feedback loops and parameterisation approach. Hydrology and Earth System Sciences, 18 (6), 2141–2166. doi:10.5194/hess-18-2141-2014
- EMBRAPA, 2019. Condições Meteorológicas Estação da Embrapa Pecuária Sudeste. Available from: http://www.cppse.embrapa.br/meteorologia/index.php?pg=caracterizacao [ Accessed 7 Jan 2019]. (in Portuguese).
- EPE, 2015. Cenário econômico 2050 Série Estudos Econômicos. Rio de Janeiro: Empresa de Pesquisa Energética.
- Ercin, A.E. and Hoekstra, A.Y., 2014. Water footprint scenarios for 2050: a global analysis. Environment International, 64, 71–82. doi:10.1016/j.envint.2013.11.019
- Figueroa M.E., and Kincaid D.L., 2010. Social, cultural and behavioral correlates of household water treatment and storage. Center Publication HCI 2010-1: Health Communication Insights, Baltimore: Johns Hopkins Bloomberg School of Public Health, Center for Communication Programs.
- Fransson, N. and Gärling, T., 1999. Environmental concern: conceptual definitions, measurement methods, and research findings. Journal of Environmental Psychology, 19 (4), 369–382. doi:10.1006/jevp.1999.0141.
- Garcia, M., Portney, K., and Islam, S., 2016. A question driven socio-hydrological modeling process. Hydrology and Earth System Sciences, 20 (1), 73–92. doi:10.5194/hess-20-73-2016
- Gober, P. and Wheater, H.S., 2015. Debates - Perspectives on socio-hydrology: modeling flood risk as a public policy problem. Water Resources Research, 51 (6), 4782–4788. doi:10.1002/2014WR016527
- Gonzales, P. and Ajami, N., 2017. Social and structural patterns of drought-related water conservation and rebound. Water Resources Research, 53 (12), 10619–10634. doi:10.1002/2017WR021852
- Gunda, T., et al., 2019. Water security in practice : the quantity-quality-society nexus. Water Security, 6, 100022. doi:10.1016/j.wasec
- Hoekstra, A.Y., et al., 2011. The water footprint assessment manual. London: Washington.
- Hoekstra, A.Y. and Mekonnen, M.M., 2012. The water footprint of humanity. Proceedings of the National Academy of Sciences, 109 (9), 3232–3237. doi:10.1073/pnas.1109936109
- Hossain, M.B. and Mertig, A.G., 2020. Socio-structural forces predicting global water footprint: socio-hydrology and ecologically unequal exchange. Hydrological Sciences Journal, 65 (4), 495–506. doi:10.1080/02626667.2020.1714052
- IBGE, 2018. Instituto Brasileiro de Geogra e Estatística - Sistema Nacional de Índices de Preço ao Consumidor. Available from: https://ww2.ibge.gov.br/home/estatistica/indicadores/precos/inpc_ipca/defaultseriesHist.shtm [ Accessed 12 Dec 2018].
- Ioris, A., 2012. Applying the strategic-relational approach to urban politicapl ecology: The water management problems of the baixada fluminense, Rio de Janeiro, Brazil. Antipode, 44 (1), 122–150. doi:10.1111/j.1467-8330.2011.00848.x
- Jager, J., Putnick, D.L., and Bornstein, M.H., 2017. II. More than just convenient: the scientific merits of homogeneous convenience samples. Monographs of the Society for Research in Child Development, 82 (2), 13–30. doi:10.1111/mono.12296
- Jenerette, G.D., et al., 2006. Contrasting water footprints of cities in China and the United States. Ecological Economics, 57 (3), 346–358. doi:10.1016/j.ecolecon.2005.04.016
- Justo, L.F., 2018. Análise Comparativa dos Impactos na Qualidade dos Recursos Hídricos Causados por Lixão e Aterros Sanitários em São Carlos - SP. Escola de Engenharia de São Carlos. Available from: http://www.tcc.sc.usp.br/tce/disponiveis/18/180300/tce-24072018-162123/?&lang=br [Accessed 12 Dec 2018]. (in Portuguese).
- Klink, J, Empinotti, V, Aversa, M. 2020. On contested water governance and the making of urban financialisation: Exploring the case of metropolitan São Paulo, Brazil. Urban Studies, 57 (8), 1676–1695. doi:10.1177/0042098019844390
- Kuil, L., et al., 2016. Conceptualizing socio-hydrological drought processes: the case of the Maya collapse. Water Resources Research, 52 (8), 6222–6242. doi:10.1002/2015WR018298.
- Kumar, P.S. and Pavithra, K.G., 2019. Environmental water footprints. Singapore: Springer.
- Larson, K.L., et al., 2009. Divergent perspectives on water resource sustainability in a public–policy–science context. Environmental Science & Policy, 12 (7), 1012–1023. doi:10.1016/j.envsci.2009.07.012.
- Lavrakas, P.J., 2008. Encyclopedia of survey research methods. (Vols. 1-0). Thousand Oaks, CA: Sage Publications, Inc. doi:10.4135/9781412963947
- Liu, C., et al., 2012. Past and future trends in grey water footprints of anthropogenic nitrogen and phosphorus inputs to major world rivers. Ecological Indicators, 18, 42–49. doi:10.1016/j.ecolind.2011.10.005
- Lyra, A., et al., 2018. Climate change projections over three metropolitan regions in Southeast Brazil using the non-hydrostatic Eta regional climate model at 5-km resolution. Theoretical and Applied Climatology, 132 (1–2), 663–682. doi:10.1007/s00704-017-2067-z
- McKee, B., et al., 2020. Floridians’ propensity to support ad valorem water billing increases to protect water supply: a panel evaluation. Hydrological Sciences Journal, 65 (1), 1–11. doi: 1080/02626667.2019.1677906
- Mondino, E., et al., 2020. Exploring changes in hydrogeological risk awareness and preparedness over time: a case study in northeastern Italy. Hydrological Sciences Journal, 65 (7), 1049–1059. doi:10.1080/02626667.2020.1729361
- Moura, J.M.B.M., Pinheiro, I.G., and Carmo, J.L., 2018. Gravimetric composition of the rejects coming from the segregation process of the municipal recyclable wastes. Waste Management, 74, 98–109. doi:10.1016/j.wasman.2018.01.011
- Pande, S. and Sivapalan, M., 2017. Progress in socio‐hydrology: a meta‐analysis of challenges and opportunities. WIREs Water, 4 (4), 4. doi:10.1002/wat2.1193
- Paterson, W., et al., 2015. Water footprint of cities: a review and suggestions for future research. Sustainability (Switzerland), 7 (7), 8461–8490. doi:10.3390/su7078461
- PMSC, 2012. Plano Municipal de Saneamento - São Carlos/SP. São Carlos: Prefeitura Municipal de São Carlos. Available from: http://www.saocarlos.sp.gov.br/images/stories/PMSSanCa/PMSSanCa%20-%20Relatorio%20FINAL-%20MAR2012.pdf [Accessed 12 Dec 2018].
- PROJETA, 2019. Projeto de Mudança do Clima para a América do Sul Regionalizado pelo Modelo ETA. Available from: https://projeta.cptec.inpe.br/#/dashboard [ Accessed 7 Jan 2019].
- PWC, 2017. The long view - How will the global economic order change by 2050? Price Waterhouse and Coopers. Available from: https://www.pwc.com/gx/en/world-2050/assets/pwc-the-world-in-2050-full-report-feb-2017.pdf [Accessed 12 Dec 2018].
- Sanderson, M.R., et al., 2017. Bringing the “social” into sociohydrology: conservation policy support in the Central Great Plains of Kansas, USA. Water Resources Research, 53 (8), 6725–6743. doi:10.1002/2017WR020659
- Schulz, C., and Ioris, A., 2017. The paradox of water abundance in Mato Grosso, Brazil. Sustainability, 9 (10), 1796 doi:10.3390/su9101796
- SEADE, 2018. Portal de Estatística do Estado de São Paulo. Informações dos Municípios Paulistas. Available from: http://www.imp.seade.gov.br/frontend/#/tabelas [ Accessed 12 Dec 2018].
- Sivapalan, M. and Blöschl, G., 2015. Time scale interactions and the coevolution of humans and water. Water Resources Research, 51 (9), 6988–7022. doi:10.1002/2015WR017896.
- Sivapalan, M., Savenije, H.H.G., and Blöschl, G., 2012. Socio-hydrology: a new science of people and water. Hydrological Processes, 26 (8), 1270–1276. doi:10.1002/hyp.8426
- SNIS, 2018. Sistema Nacional de Informações sobre Saneamento - Série Históricas. Available from: http://app4.cidades.gov.br/serieHistorica/ [ Accessed 5 Dec 2018].
- Souza, F.A.A., 2020. Supplementary material: blue and grey water foot-prints through citizens’ perception scenarios and short time series analysis of Brazilian local scale dynamics. Mendeley Data. V1. doi:10.17632/mmsfb8pzdz.1
- Srinivasan, V., et al., 2017b. Prediction in a socio-hydrological world. Hydrological Sciences Journal, 62 (3), 338–345. doi:10.1080/02626667.2016.1253844
- Srinivasan, V., Konar, M., and Sivapalan, M., 2017a. A dynamic framework for water security. Water Security, 19, 4225. doi:10.1029/2009WR008693
- Taddei, R., 2011. Watered-down democratization: modernization versus social participation in water management in Northeast Brazil. Agriculture and Human Values, 28, 109–121. doi:10.1007/s10460-010-9259-9
- Taffarello, D., et al., 2020. Ecosystem service valuation method through grey water footprint in partially-monitored subtropical watersheds. Science of the Total Environment, 738, 139480. doi:10.1016/j.scitotenv.2020.139408.
- Tomaz, P., 2000. Previsão de Consumo de Água: interface nas Instalações Prediais de Água e Esgoto com os Serviços Públicos. São Paulo - SP, Brazil: Editora Navegar.
- Tsutiya, M.T., 2006. Abastecimento de Água. 3ª Edição. São Paulo: Escola Politécnica da USP.
- Tucci, C., 2017. Indicador de Sustentabilidade Hídrica Urbana. Revista de Gestão de Água da América Latina, 14 (1), 7. doi:10.21168/rega.v14e7
- Van Emmerik, T.H.M., et al., 2014. Socio-hydrologic modeling to understand and mediate the competition for water between agriculture development and environmental health: Murrumbidgee River basin, Australia. Hydrology and Earth System Sciences, 18 (10), 4239–4259. doi:10.5194/hess-18-4239-2014
- Vanham, D. and Bidoglio, G., 2014. The water footprint of Milan. Water Science and Technology, 69 (4), 789–795. doi:10.2166/wst.2013.759
- Varriale, R., 2018. Water footprint indicators for urban planning. Tema Journal of Land Use, Mobility and Environment, 3 (11), 345–360.
- Von Sperling, M., 1995. Introdução à qualidade das águas e ao tratamento de esgotos (Princípios do tratamento biológico de águas residuárias. Vol. 1, Belo Horizonte: Departamento de Engenharia Sanitária e Ambiental, UFMG.
- Xu, L., et al., 2018. Reframing socio-hydrological research to include a social science perspective. Journal of Hydrology, 563 (September), 76–83. doi:10.1016/j.jhydrol.2018.05.061
- Zhao, X., et al., 2019. Accounting global grey water footprint from both consumption and production perspectives. Journal of Cleaner Production, 225, 963–971. doi:10.1016/j.jclepro.2019.04.037