
 ?Mathematical formulae have been encoded as MathML and are displayed in this HTML version using MathJax in order to improve their display. Uncheck the box to turn MathJax off. This feature requires Javascript. Click on a formula to zoom.
ABSTRACT
Groundwater is exploited extensively, continuously and in a disorderly way in the North China Plain (NCP), which leads to severe problems of groundwater over-exploitation, making it the largest groundwater funnel zone in the world. Based on a comprehensive treatment of over-exploited groundwater in Shandong province, this paper analyses and forecasts the water demand, supply and savings in over-exploited areas, and puts forward a method to analyse the potential for groundwater exploitation control, which provides technical support for the comprehensive analysis of exploitation control in over-exploited areas. As a result, under a 50% guaranteed rate of water supply, the potential for groundwater exploitation control in Shandong province over-exploited areas in 2020 and 2030 is 408 × 106 and 638 × 106 m3, respectively. This study can serve as a useful reference for the comprehensive management of groundwater over-exploitation in NCP and other over-exploited areas around the world.
Editor A. Fiori ; Associate editor S. Pingale
1 Introduction
Groundwater, as an important component of the global water cycle, is a vital resource of freshwater to sustain agricultural, industrial and domestic development in many parts of the world, especially in arid and semi-arid regions (Alley Citation2002, Taylor et al. Citation2013). This is in part due to groundwater’s wide distribution and inherent properties that render it attractive. Groundwater generally contains micro and macro constituents essential for human health, does not require expensive treatment, and is relatively well protected from contamination. These factors account for the substantial increase in groundwater use in many countries since the beginning of the 20th century (Zektser and Everett Citation2004, Howard Citation2015). Globally, groundwater uses in irrigation account for more than 43% of the total consumptive irrigation water use (Siebert et al. Citation2010). Groundwater also supplies more than 50% of drinking water and more than 40% of industrial water globally (Zektser and Everett Citation2004). More than 1.5 billion people worldwide rely on groundwater as their primary source of drinking water (Feng et al. Citation2018).
With the increasing demand for water resources, people have developed and utilized groundwater on a large scale for a long time, leading to the formation of groundwater over-exploited areas and causing changes to the ecological environment (Dong et al. Citation2018). Due to extreme climate episodes, population growth, and groundwater over-exploitation, long-term groundwater depletion has occurred in many regions of the world, exacerbated by various adverse environmental and eco-hydrological impacts, including deterioration of groundwater quality (Zektser et al. Citation2005, Wang et al. Citation2013), land subsidence and collapse (Sahu and Sikdar Citation2011, Huang et al. Citation2012), declined water table (Rodell et al. Citation2009), spring dry-up (Rudolph et al. Citation2006, Kang et al. Citation2011), soil salinization (Shah et al. Citation2000, Scanlon et al. Citation2007) and seawater (saltwater) intrusion (Li et al. Citation2013, Werner et al. Citation2013), and so on. Most of these problems occur in places where groundwater-based irrigation is intensive, such as the Shiroishi Plain of Saga, Japan (Don et al. Citation2006); the Ismarida Plain, North Greece (Pisinaras et al. Citation2007); a coastal basin of Orissa, India (Rejani et al. Citation2009, Sahu and Sikdar Citation2011); the North China Plain (NCP), China (Shao et al. Citation2010); the Indus basin, Pakistan (Qureshi et al. Citation2010); Manukan Island, Malaysia (Praveena et al. Citation2012); Southern California, USA (Manghi et al. Citation2012); and so on. Over-exploitation of groundwater has become a worldwide problem of the geological environment. In view of this, more and more scholars have begun to study the evaluation, treatment and management of groundwater over-exploitation (Villholth Citation2006, Van Camp et al. Citation2010, Shi et al. Citation2011, Li et al. Citation2015, Shekhar et al. Citation2015, Xu et al. Citation2018, Liu et al. Citation2019).
In China, the problem of groundwater over-exploitation is quite serious. With rapid industrialization and with the intensification of agriculture, groundwater sustainability has become a major concern for China (Cao et al. Citation2013, Ministry of the Environment Citation2013). Especially in the NCP, more than 60% of freshwater comes from groundwater (Ministry of Water Resources of China (MWR) Citation2010), and agricultural irrigation in this area relies heavily on groundwater (Kendy et al. Citation2003, Yang et al. Citation2010). The satellite Gravity Recovery and Climate Experiment (GRACE), aimed at measuring the redistribution of mass on and under the Earth’s surface, allows us to independently quantify regional changes in groundwater storage. Multiple research groups are using GRACE continuous observation data to study the NCP groundwater funnel area; the results show that from 2002 to 2014, the loss rate of groundwater reserves in the NCP was −7.4 ± 0.9 km3/year. That is to say, the NCP overdraws 6–8 km3 of groundwater annually, most of which is deep groundwater that is difficult to recover and is in a state of long-term loss (Feng et al. Citation2013, Citation2018, Huang et al. Citation2015, Shen et al. Citation2015).
In recent years, a great deal of research has also been carried out on the problem of groundwater over-exploitation in the NCP (Chen et al. Citation2003, Liu et al. Citation2008, Han et al. Citation2017, Li et al. Citation2019). However, these studies have mainly focused on how to restore the groundwater levels and on corresponding management measures, or focused on the use of numerical models to predict the groundwater table dynamics and changes in the over-exploitation area (Don et al. Citation2006, Qureshi et al. Citation2010, Praveena et al. Citation2012, Li et al. Citation2013). Very few studies have attempted to predict the potential for groundwater exploitation control from the point of view of national economic development prediction, water-use index control, water supply and demand balance, and water-saving.
In recent years, the Chinese government has attached great importance to groundwater protection, and has announced a series of documents with clear instructions (e.g. “Decision of the State Council on Accelerating the Reform and Development of Water Conservancy” in 2011; “Opinions of the State Council on the Implementation of the Most Stringent Water Resources Management System” in 2012; “Action Plan of the State Council on Water Pollution Prevention Action Plan,” “Opinions of the State Council on Accelerating the Construction of Ecological Civilization” and “Overall Plan of the State Council for Institutional Reform to Promote Ecological Progress” in 2015).
For this article, we selected Shandong province as a typical study case. Shandong province has completed shallow groundwater and deep groundwater function zoning, which provides the basis for groundwater risk assessment. At the same time, the groundwater system in Shandong has strong spatial variability. Shandong province is seriously short of water resources, groundwater is an important water supply there, and the average water supply over the years is more than 40% of the total water supply. With the rapid development of the economy and society and the growing population, the demand for water is constantly increasing. The over-exploitation and utilization of groundwater results in regional over-exploitation. The above ecological and environmental problems of over-exploitation of groundwater are all reflected in Shandong province, and seriously restrict the sustainable development of economy and society in the province. The groundwater over-exploitation area in Shandong province is the key area of groundwater over-exploitation management in the NCP; it has strong typicality and representativeness. Therefore, the groundwater over-exploitation area in Shandong province is suitable to study the potential of groundwater exploitation control.
The paper provides the results of regional water supply and demand balance in different target years. In addition, it provides an increased water supply for replacement of over-exploited groundwater and increased water demand under enhanced water-saving conditions in Shandong province. The method compares the water supply and demand balance with the amount of newly added groundwater, which can provide scientific guidance for the analysis of groundwater exploitation control in other parts of the world.
2 Study area
2.1 Location
Shandong province is located on the east coast of China, in the lower reaches of the Yellow River, at longitude 114°47ʹ30ʺ–122°42ʹ18ʺE and latitude 34°22ʹ54ʺ–38°27ʹ00ʺN. The territory includes two parts: inland and peninsula. The inland part, from north to south, borders Hebei, Henan, Anhui, and Jiangsu provinces. The Jiaodong Peninsula extends between the Bohai Sea and the Yellow Sea, facing the Korean Peninsula and the Japanese Islands across the sea. The longest distance from east to west is about 700 km. The widest distance from north to south is about 420 km, and the total land area is about 15.79 × 10⁴ km2, accounting for about 1.64% of the total national area.
2.2 Hydrometeorology
Shandong province is located in the middle latitudes; the climate is typically continental monsoon, characterized by hot and rainy summers and cold and dry winters, with little rain in spring and autumn. The average temperature is 11.7–14.5°C, and the annual average rainfall is 679.5 mm. Due to the effects of topography, vegetation and air currents, the spatial and temporal distribution of precipitation is very uneven. The general trend of rainfall decreases from 850 mm on the southeast coast to 550 mm in the inland northwest, with a large interannual change and uneven seasonal distribution of precipitation. The annual average natural runoff of the whole province is 198.26 × 10⁹ m3, equivalent to 126.5 mm annual runoff. The trend of annual runoff is gradually decreasing from the southeast coast to the northwest plain, and precipitation follows the same trend.
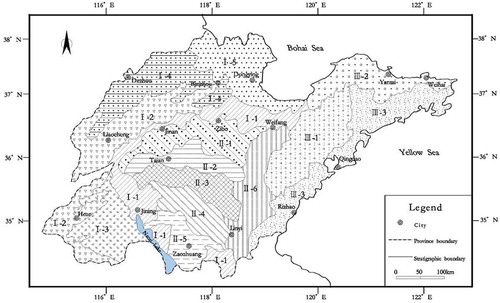
There are many rivers in Shandong province, belonging to the Yellow River basin, the Huaihe River basin, the Haihe River basin and the water system flowing into the sea; the river network density of the whole province is 0.24 km/km2. In addition to the Yellow River crossing from east to west and the Grand Canal running from north to south, there are other small- and medium-sized rivers covering the whole province. There are a total of 1022 rivers with a main stream length of more than 10 km, and 58 rivers with a watershed area of more than 1000 km2. Nansi Lake is the largest freshwater lake in the territory, and it is the regulation hub for the east route of the South-to-North Water Transfer Project, with a total area of 1266 km2 ().
Figure 1. River basin map of Shandong province
2.3 Hydrogeology
Shandong province can be divided into three hydrogeological regions: northwest, south central and east. The northwest hydrogeological region is located in the fracture subsidence zone of the North China Platform, and bears thick Upper Tertiary and Quaternary loose rocks deposited to form pore aquifers. The landform is predominantly piedmont sloping plain and Yellow River flood plain. The piedmont sloping plain is mainly distributed in the northern part of the Taiyi Mountain and western piedmont areas, composed of many large and small river alluvial and proluvial fans, and the pore water in the piedmont sloped plain has good recharge conditions and runoff conditions. The Yellow River flood plain is widely distributed, the ground is relatively flat, and the water abundance varies greatly.
The south central hydrogeological region is located in the Yishu fracture zone and its western mountainous area. The groundwater types are mainly karst water, bedrock fissure water and Quaternary groundwater. In front of the mountain or buried limestone areas, karst fissures are highly developed and highly water rich. After being replenished by precipitation, the groundwater is discharged downstream or in the form of subsurface flow or spring water along the topographic slope, forming large karst springs and karst water-rich areas.
The bedrock in the east hydrogeological region has a large outcrop area, mainly composed of various metamorphic, magmatic and clastic rocks and a small amount of limestone. The Quaternary strata are distributed only in the intermountain basins, and along the river banks and coastal areas. The main groundwater types are bedrock fissure water and Quaternary pore water. The bedrock fissure water is widely distributed but displays weak water enrichment. The groundwater is mainly supplied by precipitation, lateral infiltration of bedrock fissure water and river water leakage, and flows to the downstream of the river valley along the slope of the terrain ().
Figure 2. Hydrogeological zoning map of Shandong province
2.4 Groundwater over-exploitation conditions
Groundwater resources in Shandong province mainly come from the infiltration of precipitation and local surface water. The average annual groundwater resource volume is 16.89 × 10⁹ m3, and the exploitable volume is 12.71 × 10⁹ m3. Since the 1980s, the amount of groundwater exploitation has exceeded 10 × 109 m3 in most years, and the groundwater exploitation rate has reached a relatively high level (Shandong Water Resources Department Citation2000–2019). According to our evaluation, there are two types of groundwater over-exploitation in Shandong province: shallow groundwater over-exploitation and deep confined aquifer over-exploitation ().
Figure 3. Groundwater over-exploitation area distribution map of Shandong province
There are eight over-exploited areas of shallow groundwater in the whole province, involving 10 cities; the total over-exploited area is about 10 433.1 km2, of which the generally over-exploited area is 8368.2 km2 and the seriously over-exploited area is 2064.9 km2 (). For the deep confined aquifer, exploitation is presently prohibited in an effort to gradually restore the groundwater level. The over-exploited areas of deep confined aquifer are mainly distributed in the Yellow River flood plain, with a total area of 43 408 km2, involving eight cities ().
Table 1. The area and quantity of shallow groundwater over-exploitation in Shandong province
Table 2. Area and quantity of deep groundwater over-exploitation in Shandong province
According to the principles distinguishing forbidden and restricted groundwater exploitation areas in the “Technical Outline of National Groundwater Over-Exploitation Evaluation,” and the actual situation of Shandong province, the seawater intrusion area in the seriously over-exploited areas of the shallow groundwater is classified as forbidden exploitation area, and the other over-exploited areas of the shallow groundwater are all characterized as restricted exploitation areas. All the over-exploited areas of deep confined aquifer are classified as forbidden exploitation areas. The over-exploitation of groundwater is 637.87 × 10⁶ m3/year, including 182.4 × 10⁶ m3/year for shallow groundwater and 455.46 × 10⁶ m3/year for deep confined groundwater.
Over the years, Shandong province has attached great importance to the development, utilization and protection of groundwater. Within the province, a system of optimal allocation of water resources has gradually been established, and the water supply capacity of diverted water and unconventional water supply has been significantly improved. At the same time, the construction of a water-saving society and the implementation of a series of integrated management measures have been actively carried out to improve the efficiency of utilization of water resources. Thus, the trend of groundwater over-extraction has been effectively curbed, the amount of groundwater exploitation in the over-exploited areas has decreased year by year and tended to stabilize, the groundwater level has obviously risen, and the groundwater environment has been greatly improved.
By the end of 2017, the average groundwater depth in the plains region of Shandong province was 6.42 m, with the groundwater level rising by 0.10 m compared with the same period in 2016. For example, the water level in monitoring well No. 195 in Zibo-Weifang funnel, which is the largest groundwater funnel in Shandong province, has shown an obvious upward trend (). The average groundwater level in Zaozhuang, Linyi, Jining, Weihai, Yantai and Weifang was increased by 1.63, 0.90, 0.49, 0.46, 0.43 and 0.33 m, respectively. The main funnel region of groundwater in the plain has an area of 14 054 km2, which is 67 km2 less than that in the same period in 2016 ().
Figure 4. Water level dynamic change in monitoring well No. 195
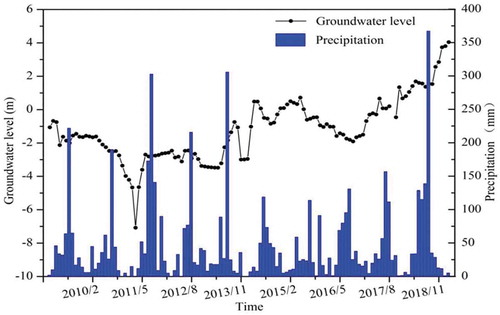
Figure 5. Area change of main shallow groundwater funnels in Shandong province in 2016
3 Methods of calculation and analysis
Groundwater exploitation control potential refers to the amount of groundwater exploitation that is reduced by adopting certain technical and economic measures to maintain or improve the existing groundwater environment, mainly including engineering and non-engineering measures such as control and limit of exploitation, water saving and reduction, water source replacement, and restoration and replenishment. Groundwater exploitation control potential is affected by many factors, including different stages of groundwater exploitation control goals, regional water supply and demand balance, water consumption quota, water price, water conservation, etc. According to the results of regional supply and demand balance analysis in different target years and the amount of over-exploitation of groundwater, the equation for potential groundwater exploitation control, modified and expanded from Wang et al. (Citation2013), can be expressed as:
where
where DYi is the potential groundwater exploitation control; DCi is the balance between supply and demand; DKi is the amount of additional groundwater supply; DX0 is the amount of groundwater over-exploitation; i, j and k are the different water users; t is the sequence number of the target year; p is the guaranteed rate number; is the total water demand of each water user under the condition of t target year and p guaranteed rate of water supply;
is the total water supply for all types of water supply projects under the condition of t target year and p guaranteed rate of water supply;
,
and
are the surface water supply, groundwater supply, and water supply for other projects, respectively;
is the living water demand of residents under the condition of t target year and p guaranteed rate of water supply;
and
are the urban and rural populations, respectively, in the different target years;
and
are the water quota for urban and rural areas, respectively;
is the production water demand of each user under the condition of t target year and p guaranteed rate of water supply;
, I
and
are the agricultural, industrial and tertiary industry water demand, respectively;
is the ecological water demand under the condition of t target year and p guaranteed rate of water supply; and
and
are the ecological water demand inside and outside of the riverway, respectively.
Water saving is an important part of a comprehensive treatment of groundwater over-exploitation. Based on the analysis of the utilization efficiency, development potential, and supply and demand relationship of water resources in the groundwater over-exploitation areas in Shandong province, the water consumption quota, water-saving target and main indexes are determined by taking into account the economic and social development status, technology level, water price and other influencing factors. Thus, the amount of water savings can be calculated.
The agricultural irrigation water-saving potential is expressed as follows (Ministry of the Water Resources Citation2004):
where Wn is the water-saving potential of farmland irrigation; A0 is the current effective irrigation area; Q0 is the current weighting net irrigation water requirement quota; Qt is the weighting net irrigation water requirement quota of the planning year after planting structure adjustment; µ0 is the irrigation water utilization coefficient in the status quo year; and µt is the irrigation water utilization coefficient in the planning year.
The industrial water-saving potential is expressed as follows (Ministry of the Water Resources Citation2004):
where Wg is the water-saving potential of industrial consumption; Z0 is the industrial added value in the status quo year; Q0 is the water consumption of 10 000 yuan of industrial added value in the status quo year; and Qt is the water consumption of 10 000 yuan of industrial added value in the planning year.
Finally, the urban life water-saving potential is expressed as follows (Ministry of the Water Resources Citation2004):
where Ws is the water-saving potential of urban life; W0 is the current living water supply from waterworks; L0 and Lt are the leakage rates of the water supply pipe network in the status quo and target years, respectively; R is the current population; Jz is the daily water-saving amount after adopting water-saving appliances; and P0 and Pt are the penetration rate of water-saving appliances in the status quo and target years, respectively.
4 Results and discussion
4.1 Water-saving potential of the study area
4.1.1 Agriculture
Agricultural water-saving refers to making full and effective use of natural precipitation and irrigation water, while minimizing the loss of water in the process of water transmission, water distribution and irrigation. Reducing crop water consumption from water sources through water conservation, agriculture management and other measures can improve the yield and output value per unit water. The connotation of agricultural water-saving includes rational development and utilization of water resources, water saving in the process of water transmission and distribution and field irrigation, employment of agricultural water-saving technology and increasing yield and efficiency in agriculture and management water-saving. If the expected agricultural water-saving index is achieved, it can be calculated according to Equation (6). From the status quo year to 2020, the water-saving amount in a normal year from 2016 to 2020 could be 467 × 106 m3, and 512 × 106 m3 of water could be saved from 2021 to 2030.
4.1.2 Industry
The indexes used to measure industrial water consumption include the water quota for industrial products, water quota for the added value of 10 000 yuan, water reuse rate for industrial use, water consumption rate and drainage rate for industrial use. With the development of industrial water saving, the rate of reuse of industrial water is generally improved. Industrial water consumption depends on industrial scale, industrial structure, industrial technology level, water-saving management level, water-saving technical measures and so on. According to EquationEquation (7)(7)
(7) , the water-saving amount will be 252 × 106 m3 from 2016 to 2020, and 296 × 106 m3 of water can be saved from 2021 to 2030.
4.1.3 Living
With economic development, a growing urban population, improvement of urban residents’ living standards and the development of urban industries, the demand for urban water resources is increasing. As there is no unified water supply pipe network in rural areas of the province at present, only urban living water-saving is analysed in this living water-saving quantity analysis. Reducing the leakage rate of the pipe network and increasing the rate of popularization of water-saving appliances can be used as indicators to measure water-use efficiency of urban life in over-exploited areas. By 2020 and 2030, the comprehensive leakage rate of urban water supply network in the whole province can be reduced from 15% to 10% and 8%, respectively. The penetration rate of water-saving appliances in urban areas has reached 100%. According to EquationEquation (8)(8)
(8) , the urban living water-saving amount in the over-exploited area can achieve 38 × 106 m3 and 21 × 106 m3 in the period 2016–2020 and 2020–2030, respectively.
Based on the analysis of water efficiency and water-saving potential in agriculture, industry and life in the groundwater over-exploited areas in Shandong province, it can be seen that in the periods 2016–2020 and 2021–2030, the agricultural water-saving potential is the largest, which is related to new agricultural water-saving technology, integration of water and fertilizer, pipe irrigation, micro-irrigation and spray irrigation (). In recent years, with the application of new industrial technologies and the development of industrial water-saving, the reuse rate of industrial water has generally improved, and industrial water-saving also has shown great potential. With the improvement of residents’ standard of living and quality of life, living water consumption will continue to grow, and living water-saving potential is limited.
Table 3. Comprehensive water-saving amount in groundwater over-exploited areas (×106 m3)
4.2 Analysis of water resources supply and demand
Three guaranteed rates, of 50%, 75% and 95%, were selected according to the speed of population growth and economic and social development, considering the future progress of science and technology, as well as systemic and mechanistic innovation. In this water resource supply and demand analysis, 2014 is taken as the base year, and the total water demand and available water supply of the economy and society are calculated according to the three target years of 2014, 2020 and 2030. The water resource supply and demand balance is analysed for 12 cities in the over-exploited area.
According to the overall plan for national economic development, the adjustment of industrial structure, trend of economic development, urbanization process, population policy and other factors are taken into comprehensive consideration. In accordance with the relevant plans formulated by the state in recent years, and in combination with the economic and social development of the groundwater over-exploited areas, indicators of annual economic and social development at different target years are proposed, including urban and rural population, total gross domestic product (GDP), industrial structure, effective irrigated area of farmland and so on.
4.2.1 Water demand prediction
With the improvement of people’s standard of living and quality of life, the per capita living water utilization standard will be improved; considering changes in rural residents’ living water use, as well as the relevant requirement of water-saving society construction, by 2020 the living water quota for urban residents and rural residents will be 95 and 65 L/d⋅p, respectively, and the total water demand of residents in the over-exploited area will be 1.3 × 10⁹ m3. By 2030, the living water quota for urban and rural residents will reach 105 and 95 L/d⋅p, respectively, and the total water demand of residents in the over-exploited area will reach 1.9 × 10⁹ m3 ().
Table 4. Prediction results of living water demand in groundwater over-exploited areas
According to the current situation and the predicted effective irrigation area, net irrigation quota and effective utilization coefficient of farmland irrigation water, and taking into account the implementation of land fallowing policy and other factors, the comprehensive calculation indicates the farmland irrigation water demand will be 14.80 × 10⁹, 14.53 × 10⁹ and 14.29 × 10⁹ m3 in a normal year in 2014, 2020 and 2030, respectively. In dry years (75%), the irrigation water demand for farmland will be 15.19 × 10⁹, 14.96 × 10⁹ and 14.75 × 10⁹ m3, respectively.
Considering the adjustment of industrial structure, as well as the improvement of water-use technology and water-saving level, water consumption for 10 000 yuan of industrial added value will drop by more than 10% in the short term and 20% in the long term in the groundwater over-exploited areas. According to the comprehensive calculations, by 2020 and 2030, the water consumption for every 10 000 yuan of industrial added value will decrease to 10 and 7.5 m3 respectively, and the total industrial water demand will be 1.67 × 10⁹ and 1.90 × 10⁹ m3 for 2020 and 2030, respectively. The water demand of other industries is also predicted, as shown in .
Table 5. Prediction results of total water demand in groundwater over-exploited areas
4.2.2 Water supply prediction
Water supply includes surface water, groundwater, diversion water, reclaimed water and so on. Because the surface water supply is directly affected by precipitation, according to the requirements of the national water supply forecast technical specifications, the surface water supply can be analysed according to the three guaranteed rates for a normal year, a dry year and a very dry year. Groundwater, diversion water, reclaimed water and other available water supply are less directly affected by precipitation, and the water supply is basically stable. According to the national requirements, the prediction is no longer based on different guaranteed rates.
Based on the water supply capacity and the actual water supply of current water supply projects, the maximum total water consumption under the most stringent water resource management system is taken as the upper limit, and the unreasonable part of the current water supply is deducted to analyse and calculate the water supply in the base year. According to this calculation, the water supply under three guaranteed rates in the status quo year is 17.42 × 10⁹, 16.60 × 10⁹ and 16.02 × 10⁹ m3, respectively.
According to the above methods for calculating the water supply from different water sources, by 2020, the water supply in the over-exploited area under the three guaranteed rates will be 19.59 × 10⁹ m3 (50%), 18.71 × 10⁹ m3 (75%) and 18.14 × 10⁹ m3 (95%); and by 2030, the water supply will be 22.09 × 10⁹ m3 (50%), 21.12 × 10⁹ m3 (75%) and 20.46 × 10⁹ m3 (95%) ().
Table 6. Prediction results of water supply in groundwater over-exploited areas in different target years (×109 m3)
4.2.3 Supply-demand equilibrium analysis
On the basis of the above water demand forecast and water supply forecast, and according to the principle of total quantity control, savings priority and overall planning, the water resource supply and demand balance of each over-exploited city in different target years was analysed. According to the calculation, there is a large water shortage in the base year for the over-exploited area under the three guaranteed rates. The water shortage rates that meet the most basic guarantees of economic and social development are 2.67 × 10⁹, 3.86 × 10⁹ and 4.42 × 10⁹ m3 (), and the most basic water shortage rates are 13.34%, 19.71% and 22.77% respectively ()).
Table 7. Water resource supply and demand balance of each over-exploited area in different target years (×109 m3)
Figure 6. Water shortage rates in groundwater over-exploited cities of Shandong province under a 50% guaranteed rate in different target years: (a) 2014; (b) 2020; (c) 2030 (note: the water shortage rates of non-groundwater over-exploited cities are set at zero)
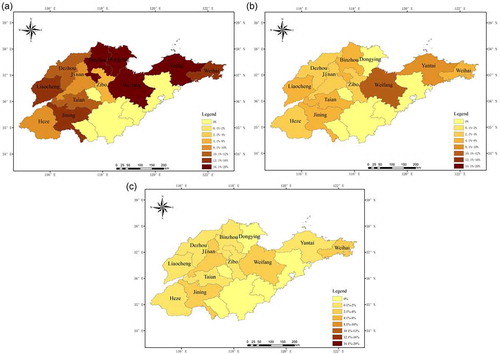
In the coming period, with the adjustment of industrial layout and economic structure, infrastructure improvements, scientific and technological progress and institutional innovation, the water-saving capacity and the effective supply capacity of water resources will be greatly enhanced. By 2020, the water shortage situation will be greatly alleviated, the water shortage under the three guaranteed rates will be 1.13 × 10⁹, 2.35 × 10⁹ and 2.96 × 10⁹ m3, and the most basic water shortage rate will be reduced to 5.93, 11.54 and 14.55% respectively ()). By 2030, the water shortage under the three guaranteed rates will be 0.44 × 10⁹, 1.84 × 10⁹ and 2.51 × 10⁹ m3, and the most basic water shortage rate will be reduced to 2, 8.26 and 11.3% respectively. Thus, a balance between supply and demand of water resources can be essentially achieved in a normal year ()).
4.3 Prediction of exploitation control potential
According to the method of evaluation of groundwater over-exploited areas and the principle of combining total volume control and optimization allocation, the groundwater exploitation control potential is predicted. According to the priority of water supply and demand of different water users, the supply and demand schemes of various industries are comprehensively optimized to obtain the control target for groundwater exploitation. Diversion water is given priority to ensure the water needs of urban life and key industrial parks are met, and that the remaining water meets the ecological water demand. Water from the Yellow River is mainly used for agriculture and ecological water supply. The surface water is mainly supplied for agriculture. Unconventional water sources are used in nearby agriculture, industry and ecology, among which brackish water is preferred for agriculture.
It can be calculated that under the 50% guaranteed rate of water supply, the groundwater exploitation control potential in 2020 and 2030 of Shandong province is 0.41 × 10⁹ and 0.64 × 10⁹ m3, respectively ().
Table 8. Exploitation control potential in groundwater over-exploited cities in the target years (106 m3)
5 Conclusions
In this study, population growth and economic and social development are taken into full consideration, the balance of water demand and supply in the over-exploited areas is analysed, and an evaluation methodology for control of groundwater exploitation is established. Following the principle of total amount control and integrated optimization deployment, and considering economic and social development as well as ecological and environmental protection, the status quo of water resources development and utilization, and the status of groundwater over-exploitation, the groundwater control targets and amounts in different target years were calculated. Under a 50% guaranteed rate of water supply, the potential for groundwater control in 2020 and 2030 of over-exploited areas in Shandong province is 408 × 106 m3 and 638 × 106 m3, respectively, and this can achieve the exploitation control target in the comprehensive regulation plan of groundwater over-exploited areas in Shandong province.
Next, we will use the alternative water source plan optimization model to select a scheme of alternative water sources, to obtain a better distribution scheme for the amount of water saving, and for the new development of local water and diversion water. In terms of policy management, it is necessary to deepen the reform of water price, promote the construction of water rights and a water market system, and strengthen the capacity building of groundwater monitoring and the dynamic monitoring of groundwater level and water quality in the over-exploited areas, to better grasp the dynamic changes of groundwater. The development of these works can be of practical significance in guiding the optimal allocation and dispatch of water resources in areas of groundwater over-exploitation.
Disclosure statement
No potential conflict of interest was reported by the authors.
Additional information
Funding
References
- Alley, W.M., 2002. Flow and storage in groundwater systems. Science, 296 (5575), 1985–1990. doi:https://doi.org/10.1126/science.1067123.
- Camp, M.V., Radfar, M., and Walraevens, K., 2010. Assessment of groundwater storage depletion by overexploitation using simple indicators in an irrigated closed aquifer basin in iran. Agricultural Water Management, 97 (11), 1876–1886. doi:https://doi.org/10.1016/j.agwat.2010.02.006.
- Cao, G., et al., 2013. Use of flow modelling to assess sustainability of groundwater resources in the North China plain. Water Resources Research, 49 (1), 159–175. doi:https://doi.org/10.1029/2012WR011899.
- Chen, J.Y., et al., 2003. Use of water balance calculation and tritium to examine the dropdown of groundwater table in the piedmont of the North China plain (NCP). Environmental Geology, 44 (5), 564–571. doi:https://doi.org/10.1007/s00254-003-0792-3.
- Don, N.C., et al., 2006. Groundwater resources management under environmental constraints in shiroishi of saga plain, Japan. Environmental Geology, 49 (4), 601–609. doi:https://doi.org/10.1007/s00254-005-0109-9.
- Dong, Y., et al., 2018. Assessment methods of groundwater overdraft area and its application. In: IOP conference series: Earth and environmental science (Vol. 153, No. 5). Guilin, China: IOP Publishing, 052005.
- Feng, W., et al., 2013. Evaluation of groundwater depletion in North China using the gravity recovery and climate experiment (grace) data and ground-based measurements. Water Resources Research, 49 (4), 2110–2118. doi:https://doi.org/10.1002/wrcr.20192.
- Feng, W., et al., 2018. Groundwater storage changes in China from satellite gravity: an overview. Remote Sensing, 10 (5), 674. doi:https://doi.org/10.3390/rs10050674.
- Han, S., et al., 2017. Socio-hydrological perspectives of the co-evolution of humans and groundwater in Cangzhou, North China Plain. Hydrology and Earth System Ences Discussions, 21 (7), 1–17.
- Howard, K.F., 2015. Sustainable cities and the groundwater governance challenge. Environmental Earth Sciences, 73 (6), 2543–2554. doi:https://doi.org/10.1007/s12665-014-3370-y.
- Huang, B., Shu, L., and Yang, Y.S., 2012. Groundwater overexploitation causing land subsidence: hazard risk assessment using field observation and spatial modelling. Water Resources Management, 26 (14), 4225–4239. doi:https://doi.org/10.1007/s11269-012-0141-y.
- Huang, Z., et al., 2015. Subregional-scale groundwater depletion detected by grace for both shallow and deep aquifers in North China Plain. Geophysical Research Letters, 42 (6), 1791–1799. doi:https://doi.org/10.1002/2014GL062498.
- Kang, F., Jin, M., and Qin, P., 2011. Sustainable yield of a karst aquifer system: a case study of Jinan springs in Northern China. Hydrogeology Journal, 19 (4), 851–863. doi:https://doi.org/10.1007/s10040-011-0725-2.
- Kendy, E., et al., 2003. Policies drain the North China plain: agricultural policy and groundwater depletion in luancheng county, 1949–2000. Colombo, Sri Lanka: IWMI Research Reports.
- Li, F., et al., 2013. An integrated groundwater management mode based on control indexes of groundwater quantity and level. Water Resources Management, 27 (9), 3273–3292. doi:https://doi.org/10.1007/s11269-013-0346-8.
- Li, F., et al., 2015. Risk assessment of groundwater and its application. part i: risk grading based on the functional zoning of groundwater. Water Resources Management, 29 (8), 2697–2714. doi:https://doi.org/10.1007/s11269-015-0964-4.
- Li, N., et al., 2019. Decomposition technique for contributions to groundwater heads from inside and outside of an arbitrary boundary: application to guantao county, North China plain. Hydrology and Earth System Sciences, 23 (7), 2823–2840. doi:https://doi.org/10.5194/hess-23-2823-2019.
- Liu, J., et al., 2008. Ground water sustainability: methodology and application to the North China plain. Ground Water, 46 (6), 897–909. doi:https://doi.org/10.1111/j.1745-6584.2008.00486.x.
- Liu, S., Chen, G., and Ni, H., 2019. Evaluation system building for groundwater overexploitation zone management. In: W. Dong, et al. eds. Sustainable development of water resources and hydraulic engineering in China. Cham: Springer, 99–114.
- Manghi, F., et al., 2012. Groundwater flow modelling of the arlington basin to evaluate management strategies for expansion of the arlington desalter water production. Water Resources Management, 26 (1), 21–41. doi:https://doi.org/10.1007/s11269-011-9899-6.
- Ministry of the Environment, 2013. Groundwater in China. Part I: occurrence and use. Beijing. Available from: http://www.COWI.com. [Accessed 2 May 2019]
- Ministry of the Water Resources, 2004. Guidelines for the compilation of planning for the construction of water-saving society. Beijing.
- Ministry of Water Resources of China (MWR), 2010. China water resources bulletin, Ministry of water research of China. Beijing. Available from: http://www.mwr.gov.cn/ [Accessed 15 Qctober 2020].
- Pisinaras, V., et al., 2007. A groundwater flow model for water resources management in the Ismarida plain, North Greece. Environmental Modeling and Assessment, 12 (2), 75–89. doi:https://doi.org/10.1007/s10666-006-9040-z.
- Praveena, S.M., et al., 2012. Sustainable groundwater management on the small Island of Manukan, Malaysia. Environmental Earth Sciences, 66 (3), 719–728. doi:https://doi.org/10.1007/s12665-011-1279-2.
- Qureshi, A.S., et al., 2010. Challenges and prospects of sustainable groundwater management in the indus basin, Pakistan. Water Resources Management, 24 (8), 1551–1569. doi:https://doi.org/10.1007/s11269-009-9513-3.
- Rejani, R., Jha, M.K., and Panda, S.N., 2009. Simulation-optimization modelling for sustainable groundwater management in a coastal basin of Orissa, India. Water Resources Management, 23 (2), 235–263. doi:https://doi.org/10.1007/s11269-008-9273-5.
- Rodell, M., Velicogna, I., and Famiglietti, J.S., 2009. Satellite-based estimates of groundwater depletion in India. Nature, 460 (7258), 999–1002. doi:https://doi.org/10.1038/nature08238.
- Rudolph, D.L., et al., 2006. Significance of enhanced infiltration due to groundwater extraction on the disappearance of a headwater lagoon system: Toluca basin, Mexico. Hydrogeology Journal, 14 (1–2), 115–130. doi:https://doi.org/10.1007/s10040-005-0463-4.
- Sahu, P. and Sikdar, P.K., 2011. Threat of land subsidence in and around Kolkata City and East Kolkata Wetlands, West Bengal, India. Journal of Earth System Science, 120 (3), 435–446. doi:https://doi.org/10.1007/s12040-011-0077-2.
- Scanlon, B.R., et al., 2007. Global impacts of conversions from natural to agricultural ecosystems on water resources: quantity versus quality. Water Resources Research, 43 (3), W03437. doi:https://doi.org/10.1029/2006WR005486.
- Shah, T., et al., 2000. The global groundwater situation: overview of opportunities and challenges. Colombo, Sri Lanka: IWMI Books, Reports.
- Shandong Water Resources Department, 2000–2019. Shandong water resources bulletin.
- Shao, J.L., Cui, Y.L., and Wang, L.C., 2010. Deep groundwater mining situation and research on the numerical simulation and prediction of groundwater in Tianjin. Beijing: China University of Geosciences. (in chinese).
- Shekhar, S., Mao, R.S., and Imchen, E.B., 2015. Groundwater management options in North District of Delhi, India: a groundwater surplus region in over-exploited aquifers. Journal of Hydrology: Regional Studies, 4, 212–226.
- Shen, H., et al., 2015. Groundwater depletion in the Hai River Basin, China, from in situ and GRACE observations. Hydrological Sciences Journal, 60 (3–4), 671–687. doi:https://doi.org/10.1080/02626667.2014.916406.
- Shi, J., et al., 2011. Assessment of deep groundwater over-exploitation in the North China plain. Geoence Frontiers, 2 (4), 593–598.
- Siebert, S., et al., 2010. Groundwater use for irrigation-a global inventory. Hydrology and Earth System Sciences, 14 (10), 1863–1880. doi:https://doi.org/10.5194/hess-14-1863-2010.
- Taylor, R.G., et al., 2013. Ground water and climate change. Nature Climate Change, 3 (4), 322–329. doi:https://doi.org/10.1038/nclimate1744.
- Villholth, K.G., 2006. Groundwater assessment and management: implications and opportunities of globalization. Hydrogeology Journal, 14 (3), 330–339. doi:https://doi.org/10.1007/s10040-005-0476-z.
- Wang, X.J., Zhao, H., and Geng, Z., 2013. Research on the relationship between groundwater exploitation control and water supply security in South-North Water Diversion area. Ground Water, 35 (2), 5–7+15. (in chinese).
- Werner, A.D., et al., 2013. Seawater intrusion processes, investigation and management: recent advances and future challenges. Advances in Water Resources, 51, 3–26.
- Xu, T., et al., 2018. The effect evaluation of comprehensive treatment for groundwater overdraft in quzhou county, China. Water, 10 (7), 874. doi:https://doi.org/10.3390/w10070874.
- Yang, Y., et al., 2010. Estimation of irrigation requirement for sustainable water resources reallocation in North China. Agricultural Water Management, 97 (11), 1711–1721. doi:https://doi.org/10.1016/j.agwat.2010.06.002.
- Zektser, I.S. and Everett, L.G., 2004. Groundwater resources of the world and their use. IHP, 31 (3), 115–116.
- Zektser, S., Loáiciga, H.A., and Wolf, J.T., 2005. Environmental impacts of groundwater overdraft: selected case studies in the Southwestern United States. Environmental Geology, 47 (3), 396–404. doi:https://doi.org/10.1007/s00254-004-1164-3.