
 ?Mathematical formulae have been encoded as MathML and are displayed in this HTML version using MathJax in order to improve their display. Uncheck the box to turn MathJax off. This feature requires Javascript. Click on a formula to zoom.
ABSTRACT
The study presents changes in the elements of the hydrological regime of Lake Hańcza in the period 1960–2019, including water temperature, ice cover characteristics and water level. It was determined that statistically significant changes resulted in an increase in water temperature (0.11°C·dec−1), a decrease in maximum ice thickness (5 cm·dec−1) and an increase in water levels (6.7 cm·dec−1). Changes in water temperature and ice cover in the analysed case are different from those in other lakes of the region. As the tests conducted in this study and in previous research have shown, the lake has resisted global warming for a relatively long time, and the change in thermal conditions occurred a decade later than in other lakes in this part of Europe. The analysed case leads to the conclusion that the morphometric features of lakes significantly modify the influence of overriding factors, such as climate conditions.
Editor A. Fiori Associate editor O. Makarieva
1 Introduction
A hydrological regime is defined as a pattern of variations in all phenomena occurring in a lake or river. It determines the condition and reactions of the lake or river system towards the climate system and physico-geographical features of catchment areas (Wrzesiński Citation2019). Studies concerning the regime of lakes refer to various elements determining the overall functioning of those ecosystems. This issue was comprehensively addressed by (among others) Apsite et al. (Citation2014), through an analysis of changes in water levels, water temperature and ice conditions in relation to lakes in Latvia. The listed characteristics can be considered elementary for many processes and phenomena occurring in lakes, which has been proven by numerous studies in this field. Fluctuations in water level are a significant factor in water quality, phytoplankton dynamics, fish population, water resources, economic use of lakes, etc. (Alemayehu et al. Citation2010, Wrzesiński and Ptak Citation2016, Dembowska and Kubiak-Wójcicka Citation2017, Kann and Walker Citation2020). On the other hand, water temperature determines the intensity and duration of overturn, the conditions of temporal and spatial variability of fish habitats, the occurrence of cyanobacteria, self-treatment of water, etc. (Ptak and Nowak Citation2016, Missaghi et al. Citation2017, Bartosiewicz et al. Citation2019, Gray et al. Citation2019). In the case of lakes in the temperate zone, the ice cover during the winter season completely changes the environmental conditions therein. As Lindenschmidt et al. (Citation2018) emphasize, we still do not have a full understanding of how winter conditions affect aquatic ecosystems. The isolation of water from external factors affects, among other things, biological life, water overturn, light penetration, gas exchange, etc. (Zdorovennov et al. Citation2016, Hampton et al. Citation2017, Obertegger et al. Citation2017, Cortés and MacIntyre Citation2020). In extreme cases, the ice cover may lead to oxygen deficits and the death of fish (Fox et al. Citation2020).
The existing features of the hydrological regime of lakes, in light of the observed climate changes, are undergoing a constant transformation, which has been proven by numerous studies in various parts of the world. The increase in surface water temperature is well documented (Schneider and Hook Citation2010, Ptak et al. Citation2020a). In the case of ice cover, its duration is shortened (Magnuson et al. Citation2000, Yao et al. Citation2016), and for water level fluctuations, apart from climatic conditions, human activity plays an important role (Nowak and Ptak Citation2018, Wrzesiński et al. Citation2018), as water level oscillations are often dependent on its intensity.
In hydrological studies, lakes are treated as indicators of climate change (Adrian et al. Citation2009). However, compared to the generally observed regularities of lakes in a given region or catchment area, there are cases where particular characteristics of individual lakes lead to different courses of the processes against the background of a larger group. An example is Clearwater Lake (Canada), where local changes in the catchment area (i.e. regrowth of forest resulting from local reduction of SO2 emission and reforestation) caused, among other things, a decrease in wind speed and, consequently, a decrease in water temperature (Tanentzap et al. Citation2008).
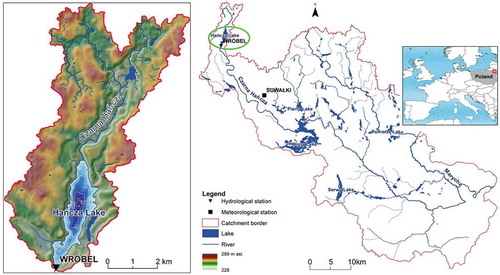
A lake is an open geographical system where energy and matter circulate with the surroundings. Depending on its internal characteristics, it responds to these streams in different ways. The gradual decrease in intensity of most phenomena and processes with depth, results in the relative isolation of the deeper water layers. The slowest rate of transformation is usually observed in deep lakes with larger layers of hypolimnion (Lange Citation1993). In the case of Poland, Lake Hańcza is certainly interesting in this respect (). It has a depth of 106.1 m (Skowron Citation1999), which makes it the deepest lake not only in Poland, but also in the Central European Plain (Sokołowski Citation2000, Popielarczyk et al. Citation2015).
This study involves the analysis of changes in selected elements of the hydrological regime of Lake Hańcza with regard to surface water temperature, ice cover and water level. The study aims to identify long-term changes in the elements of the hydrological regime of Lake Hańcza by marking their direction and pace. Furthermore, the study aims to determine correlations between particular features of the hydrological regime of the analysed lake and climate conditions.
Figure 1. Study location
2 Study object, materials and methods
2.1 Study object
Lake Hańcza is located in the Suwałki Lake District in northeastern Poland. The lake, in hydrological terms, is located in the catchment area of Czarna Hańcza (closing its upper part with an area of 39.7 km2), through which the river flows. The nature of the catchment area use is diverse, with predominantly agricultural lands followed by forests and water. The analysed lake covers the southern part of the tunnel valley, formed in Pleistocene glacial sediments (glacial till), fluvioglacial sediments (gravel and sand) and marginal sediments (loam and sand), and strongly glaciotectonically deformed (Ber Citation1971, 2003; Pochocka-Szwarc et al. Citation2013). The area of the lake is 305 ha (Skowron Citation1999). According to Skowron (Citation1999), the maximum length is 4.52 km, the average width is 0.63 km, the maximum depth is 106.1 m, and the average depth is 38.7 m. The volume of the lake is 120 million m3. The length of the coastline is 11.7 km, with boulder embankments stretching alongside. The shores themselves are high with steep escarpments in some places. Coastal vegetation is poor, but there are underwater Chara meadows.
Lake Hańcza is a dimictic lake, where, according to Zdanowski (Citation2008), the spring overturn lasts from April to mid-May, and the autumn overturn usually begins in mid-November. According to measurements by Szczepański (Citation1961), the thermocline moves from 8 m in August to 20 m in the autumn, and the observed cooling is only slightly related to the radiation of heat from the lake. The average water retention time in Hańcza, according to Bajkiewicz-Grabowska’s (Citation2008) calculations, is 14 years and 6 months, and specific indicators of the intensity of water exchange show that the lake is hydrologically passive. According to the balance calculations of the same author (Bajkiewicz-Grabowska Citation2008), horizontal exchange plays a pivotal role in the water circulation in the lake: the inflow constitutes 72% of the balance sum, while the outflow constitutes 78%. According to the findings of Mitręga et al. (Citation1993), the deep lakes of the Suwałki Region, contrary to popular opinion, display a limited hydraulic connection with the surrounding groundwater. The connection between the waters of Lake Hańcza and deeper aquifers is practically nonexistent, as these waters flow around the lake basin (Mitręga and Pachla Citation1993). In the case of fishing, the analysed object represents the vendace type of lake (apart from vendace, there are also whitefish, burbot, and smelt or reintroduced lake bulltrout). Moreover, there are species vanishingly rare in lakes: common minnow and European and Siberian bullhead (Kozłowski Citation2008).
On 10 May 1963, Lake Hańcza was declared a nature reserve (water and landscape) for scientific and educational reasons, and because of the outstanding landscape values of the geomorphological, geological and limnological lake. Lake Hańcza is located within the Suwałki Landscape Park, which was established in 1976, and is also a part of the Natura 2000 area – “Ostoja Suwalska.” Due to its natural assets, the lake is very popular among tourists as well as qualified divers.
2.2 Materials
Hydrological data and meteorological measurements collected by the Institute of Meteorology and Water Management – National Research Institute (IMWM-NRI) in the years 1960–2019 have been used in the study. The data concerns: average monthly surface water temperature, average monthly water levels, and ice cover characteristics including ice cover start (ICS), ice cover end (ICE) and information on maximum ice cover thickness (MICT) in a given season. Furthermore, ice cover duration (ICD) was determined as the difference between the start and end dates of the ice cover. Water levels were measured on a water gauge with an accuracy of 1 cm. Point measurements of water temperature were performed at a depth of 0.4 m at 6 UTC. All hydrological observations were performed in the Wróbel profile.
The analysis of the changes in the hydrological regime was conducted with reference to climatic data from the Suwałki meteorological station (16 km from the lake, see ) from the same period as the hydrological observations. Climatic data included monthly minimum, average and maximum air temperatures (AT1, AT, AT3), precipitation (P), wind speed (WS), insolation (I) and cloud cover (CC). Moreover, the ice regime of Lake Hańcza was analysed in relation to ice cover characteristics in terms of snow cover duration (SCD) and average and maximum snow cover thickness (ASCT and MSCT).
2.3 Methods
The magnitude of changes in monthly and annual water levels (WL), water temperature (WT), ICS, ICE, ICD and MICT was calculated on the basis of the non-parametrical Sen’s test (Gilbert Citation1987). It was assumed that the changes in WL, WT, ICS, ICE, ICD and MIST over time can be described by the general formula f(x) = Qx + B, where Q is the slope coefficient of a straight line, B is the equation constant, and x is time (years).
The analysis of trend significance was conducted using the Mann-Kendall test (MK) (Kendall and Stuart Citation1968). For this purpose, the values of the S and Z statistics were calculated. It is assumed that the trend is increasing when the value of Z statistics is positive or decreasing when Z is negative. On the basis of standardized Z statistics, the test probability p was calculated. When the value of p is less than the assumed level of significance, the trend is statistically significant. The analysis of trend significance was conducted for a level of 0.05.
Moreover, for establishing the long-term trends of WL, WT, ICS, ICE, ICD and MICT, linear regression was used, whereas for estimating the statistical significance of trends, the Student’s t-test was used.
For estimating break points in the long time series of WL, WT, ICS, ICE, ICD and MICT, the Pettitt test was then used (Pettitt Citation1979). Based on the assumptions of the Pettitt test, if the time series of data x1, x2, x3, … xn has a change point that occurred in a year t, then the time series is divided into two subsets x1, x2, x3, … xt and xt+1, xt+2, xt+3, … xn, but the distribution functions of F1(x) and F2(x), respectively, are different. The Ut statistics for a non-parametric test can be presented as follows:
where:
The Kn statistics and related confidence level (P) for a sample length (n) may be presented as follows:
where:
To illustrate the annual changes in WL, WT, ICS, ICE, ICD and MICT between 1960 and 2019, graphs showing the linear trend were developed, and break points have been marked. Moreover, the annual values for WL, WT, ICS, ICE, ICD and MICT were smoothed using the locally weighted regression smoothing function (LOESS) with a span value set at 0.2 (R Core Development Team, Citation2005). The LOESS algorithm was presented and described by Cleveland (Citation1979, Citation1981), Cleveland and Devlin (Citation1988) and Cleveland et al. (Citation1988). In LOESS, the time variable is fragmented into intervals, for which separate regressions are fitted. The span value controls the degree of smoothing. The span indicates the number of years for the regression analysis in relation to the whole study period, and takes values from 0 to 1. As the span value increases, the line becomes smoother up to a value of 1, which corresponds to a single line (i.e. the standard linear regression). The LOESS method enables one to remove noise from data and improve data interpretation. The same type of analysis was applied to determine the directions and magnitude of AT1, AT, AT3, P, WS, I, CC, SCD, MSCT and ASCT at the Suwałki station.
To illustrate the changes in thermal conditions of waters in Lake Hańcza and air temperatures at the Suwałki station in the years 1960–2019, the percentile classification developed by Czernecki and Miętus (Citation2011) was applied. This method was originally developed for use in climate monitoring. The classification is based on the percentile values (5, 10, 20, 30, 40, 60, 70, 80, 90 and 95) that are calculated for monthly and annual mean WT and AT for the reference period (1961–1990). In this way, 11 classes were established (5 for cold, 1 for normal and 5 for warm). The obtained results allowed for the designing of heat maps presenting changes in the thermal conditions of water and air.
A correlation analysis was conducted to identify the climatic parameters influencing the occurrence of ice cover in Lake Hańcza. The analysis took into account AT, WS, CC, I, P, SCD and SCT values from November to April, as shown in . The Pearson’s correlation coefficient was used to determine the association between ice cover and climatic variables.
Table 1. The periods for lake drivers used for calculating correlation coefficients
3 Results
3.1 Features of the hydrological regime of Lake Hańcza
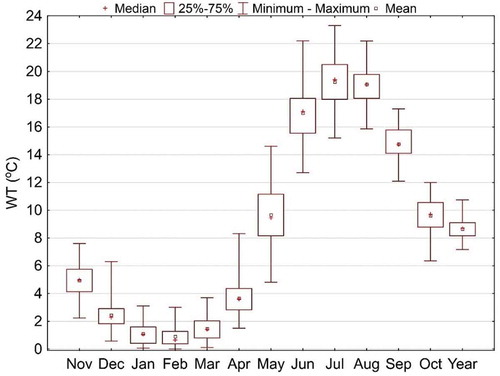
Average monthly water temperatures in the period 1960–2019 ranged from 0.9°C in February to 19.2°C in July, with the annual average value being 8.6°C (). The annual average values varied in a 3.6°C range. The distributions of average monthly water temperatures were generally normal except for December, January, February and April, which had a rightward skewed (positive oblique) distribution.
Figure 2. Variability of average monthly water temperatures (WT) in Lake Hańcza, 1960–2019
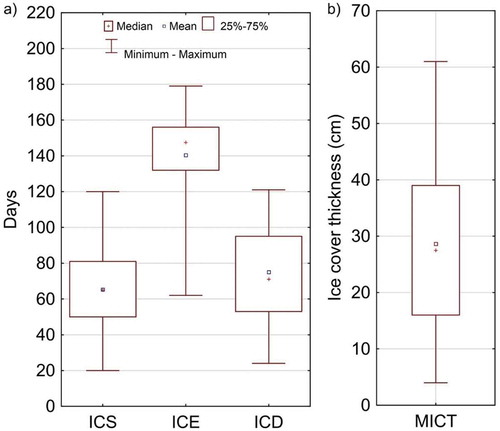
Ice phenomena on Lake Hańcza begin on average in the first half of January and end on average at the end of the second week of March. The earliest ice cover on Lake Hańcza appeared in 1994 (20 November) and the latest in 1983 (28 February) (). And in 1975 and 2008, ice phenomena did not appear on Lake Hańcza at all. The ice subsided the fastest on 1 January 1989, and in 1978, it stayed until 28 April. The average ice cover duration on Lake Hańcza was 75 d (), and the average MICT was 28 cm ()). MICT in 1970 and 1979 was 62 cm, while MICT in 1990 and 2015 was less than 10 cm.
Figure 3. Changes in the (a) start, end and duration dates and (b) maximum thickness of the ice cover on Lake Hańcza, 1960–2019
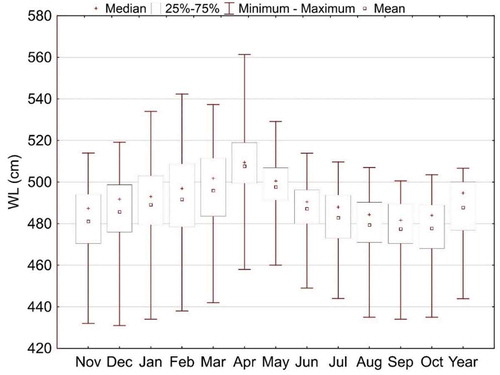
Annual average water levels in Lake Hańcza in the analysed years ranged from 444 cm in 1963 to 507 cm in 1994, with an average value of 488 cm. The highest average water levels in Lake Hańcza occurred in April (508 cm on average) and the lowest in September (477 cm on average; see ). The highest variability of average monthly water levels occurred between January and February in the range of 95–104 cm, while the lowest variability was from May to October in the range 65–72 cm. The annual average water levels varied in the range of 63 cm. It should be noted that the median values were higher than the average values, which indicates that distributions of the average monthly water level are negatively oblique (leftward skewed). Only in April was the distribution of average monthly water levels in Lake Hańcza normal according to the Shapiro-Wilk test.
Figure 4. Variability of average monthly and annual water levels (WL) in Lake Hańcza, 1960–2019
3.2 Changes in the hydrological regime
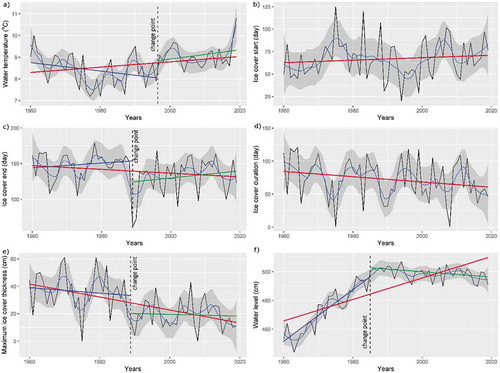
Long-term changes of the analysed elements of the hydrological regime of Lake Hańcza are presented in . In the case of water temperature, an upward tendency was observed in the analysed period. The slope coefficient of a straight line of regression for annual average water temperatures was 0.11°C dec−1 and was statistically significant at the 0.05 level (p = 0.0498) (); see also Supplementary material, Table S1). A break point was identified in 1997 in the series of annual average water temperatures from 1960 to 2019. For the first data subseries, from 1960 to 1996, the average temperature was 8.4°C, and for 1997–2019, it was higher at 9.1°C (these differences were significant at a level of 0.05), whereas an analysis conducted separately for both subseries of annual average water temperatures showed that their changes were statistically nonsignificant.
Figure 5. Hydrological regime changes in Lake Hańcza, 1960–2019: (a) water temperatures, (b) ice cover start, (c) ice cover end, (d), ice cover duration, (e) maximum ice cover thickness, (f) water level. The light blue line denotes locally weighted smoothing by local regression (LOESS) with a span value set at 0.2. The grey area denotes the confidence interval set at 0.95. The red line denotes the linear regression trend, from 1960 to 2019. The vertical grey dashed line denotes the change point indicated by the Pettitt test. The dark blue line and the green line denote the linear regression trend for the first and second subseries, respectively
Significant changes in average water temperatures occurred only in five months: April, May, August (upward trend), November and December (downward trend). In the months indicated, significant break points were identified, respectively for November in 1974, May in 1988 and April, August and December in 1989. Moreover, break points were also identified for March (1988) and July (1988). For the months indicated, the Mann-Kendall and Senn’s analysis was reapplied. It was shown that in May, August, November and December, changes of water temperatures in both subseries were statistically nonsignificant. There were, however, differences between average water temperatures in the separated subseries for the indicated months. In November and December, temperatures were higher in the first sub-period than in the second. In August, however, the opposite situation occurred. In March, April and August, lower water temperatures occurred in the first sub-periods, while there was a decreasing trend at the same time, i.e. the water temperature decreased by 0.50, 0.48 and 0.58°C dec−1, respectively. These changes were statistically significant at the 0.05 level.
The non-one-way changes in water temperatures between December and April resulted in the occurrence of ice phenomena. Between 1960 and 2019, there were no significant changes regarding the start and end dates of ice cover. Although ice cover appeared on the lake 1.8 d dec−1 later on average and broke up 2.8 d dec−1 earlier, these changes were not statistically significant ( and (c), S1). Ice cover duration also shortened over the analysed period by 4.3 d dec−1 on average (), S1). Nevertheless, as in the case of ICS and ICE, these changes were statistically nonsignificant. Only with regard to MICT were the changes statistically significant at a level of 0.05 (S1). Ice cover thickness decreased between 1960 and 2019 by 5 cm·dec−1 on average ()). A break point was identified in the MICT series in 1988. Between 1960 and 1987, the average MICT was 38 cm, while in the period 1988–2019, it was 2 times lower. Analysing the trends of MICT changes separately in the two periods, however, it was shown that they were statistically nonsignificant.
The analysis of average water levels showed that in the last 60 years, there was an upward trend at a level of 6.7 cm·dec−1 (), S1). Data analysis using Pettitt’s test identified a break point in the analysed period, in 1985. Taking this into account, the series of average water levels were divided into two subseries, for 1960–1984 and 1985–2019. For the first period, the average water level was 472 cm, while for the second period it was 499 cm. The analysis showed that for the first subseries of water levels (1960–1984), there was an upward trend at a level of 18.7 cm·dec−1 (p = 4.8 × 10⁻⁷), whereas for the second subseries (1985–2019), there was a downward trend of 1.3 cm·dec−1 (statistically nonsignificant). However, taking into account the average monthly water levels in 1960–2019, significant upward trends increasing from 4.4 cm·dec−1 (April) to 11.0 cm·dec−1 (February) were obtained for each case. In individual series of the average monthly water levels between 1960 and 2019, a break point occurrence was identified, similarly to the annual average levels. The earliest break points were identified in 1979 (April and May), then in 1980 (July), 1981 (November–March), 1982 (June), 1984 (October) and 1985 (August and September). Analyses conducted using Sen and Mann-Kandall tests revealed that for the first subseries, there were upward trends for all cases, ranging from 15 to 24.9 cm·dec−1 in June and January, respectively. In the case of the second data subseries, the changes in water levels were statistically nonsignificant.
3.3 Changes in meteorological conditions
The study attempts to determine what influence climate change had on the changes in the hydrological regime of Lake Hańcza. The analysis of climatic conditions at the Suwałki station showed that changes are most evident in air temperature, wind speed and cloud cover (; see also Supplementary material, Table S2).
Figure 6. The meteorological conditions changes in Suwałki station, 1960–2019: (a) average air temperatures, (b) minimum air temperature, (c) maximum air temperature, (d) precipitation, (e) wind speed, (f) cloud cover, (g) insolation, (h) snow cover duration, (i) maximum ice cover thickness, (j) average snow cover thickness. The light blue line denotes locally weighted smoothing by local regression (LOESS) with a span value set at 0.2. The grey area denotes the confidence interval set at 0.95. The red line denotes the linear regression trend, from 1960 to 2019. The vertical grey dashed line denotes the change point indicated by the Pettitt test. The dark blue line and the green line denote the linear regression trend for the first and second subseries, respectively
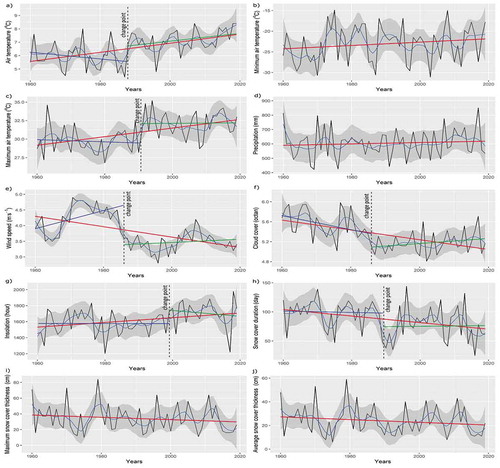
The annual average air temperatures at the Suwałki station ranged from 4.4 to 8.4°C, with an average value of 6.6°C. Between 1960 and 2019, it increased by 0.33°C dec−1 ()). An upward trend was also observed for the minimum and maximum temperatures ( and (c)); however, only in the case of the maximum temperatures were the changes statistically significant (p = 0.0001), amounting to 0.66°C dec−1. In the series of annual average air temperatures, a break point was identified in 1988. The period 1960–1987 was characterized by lower temperatures, of 5.9°C on average, whereas in the period 1988–2019, the average temperature was 7.2°C. Between 1960 and 1987, air temperatures were characterized by a downward trend, while since 1988, they have been increasing by 0.26°C dec−1 (p = 0.046) on average. Unlike water temperatures in all months, there was an upward trend in air temperatures ranging from 0.05°C dec−1 in October to 0.56°C dec−1 in December. However, these changes were statistically significant only in December, March, April, July and August. In the series of monthly air temperatures, there were break points in 1988 (January and February), 1989 (March and August) and 2001 (November), respectively.
Precipitation at the station ranged from 422 mm to 851 mm, with an average value of 604 mm. The analysis of precipitation revealed that there were no statistically significant changes in the annual and monthly data of the period 1960–2019 (), S2). The changes in wind speed at the Suwałki station were the most unidirectional. The annual average wind speed between 1960 and 2019 ranged from 2.8 to 4.9 m·s−1, with an average value of 3.8 m·s−1. Over the years 1960–2019, there was a downward trend in wind speed at a rate of 0.16 m·s−1·dec−1 ()). In the WS series, a break point was identified in 1986. In the period preceding the break point, wind speeds were at a level of 4.3 m·s−1, whereas between 1986 and 2019, wind speeds were on average 0.8 m·s−1 lower. There was a downward trend in wind speed in all months, and only in June were wind speed changes statistically nonsignificant. The biggest changes in wind speed occurred between November and April, from 0.17 to 0.27 m·s−1·dec−1, and the smallest occurred in June and July (0.09 m·s−1·dec−1 (S2)). With regard to cloud cover and insolation, significant changes also occurred between 1960 and 2019 ( and (g)). Cloud cover at the Suwałki station in individual years was at a level of 4.8–6.0 octans (on a scale from 0 to 8, where 0 = no clouds and 8 = sky completely covered by clouds), and insolation ranged from 1203 to 1979 h·year−1, with an average value of 1619 h·year−1. There was a downward trend in cloud cover on average by 0.1 octan·dec−1 and an upward trend in insolation on average by 34.5 h·year−1·dec−1. With regards to cloud cover, the biggest changes occurred between April and July, ranging from 0.16 to 0.26 octans·dec−1, and for insolation in April and May by 9.0 and 9.8 h·month−1·dec−1, respectively (S2).
There have been changes in the occurrence of snow cover at the Suwałki station. The analysis showed a significant decrease in snow cover duration in individual years, by 6.1 d·dec−1 (), S2). There was also a downward trend in time of snow cover occurrence, ranging from 1.9 to 2.3 d−1·dec−1. However, no major changes were observed in snow cover thickness ( and (j), S2). Only in March, between 1960 and 2019, did it decrease, at a rate of 2.6 cm·dec−1 (p = 0.017).
3.4 Correlation between the hydrological regime and climatic conditions
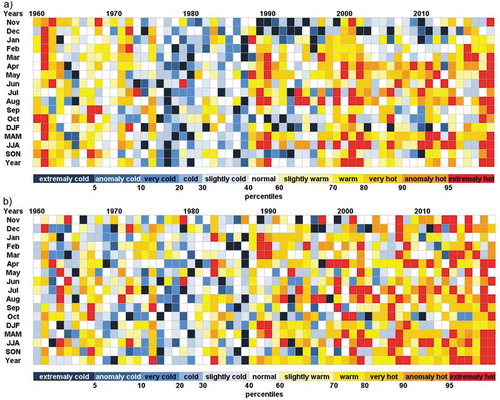
The analysis of correlation between mean yearly water temperatures in Lake Hańcza and climate parameters from the Suwałki station reveal that they were significantly correlated with air temperatures and insolation at a level of 0.66 and 0.34, respectively. With regard to wind speed and cloud cover, the correlation coefficients were negative and amounted to −0.30 and −0.22, respectively. The correlation between water temperatures in Lake Hańcza and air temperatures at the Suwałki station is well represented by heat maps ( and (b)). Since the 1990s, there has been a clear trend in both cases towards a more frequent occurrence of very hot, anomalously hot and extremely hot temperatures.
Figure 7. The monthly and seasonal average (a) water and (b) air temperature classification. Thresholds of 5, 10, 20, 30, 40, 60, 70, 80, 90 and 95 percentile denote 11 classes (described in the legend). Classes were calculated for the reference period 1961–1990
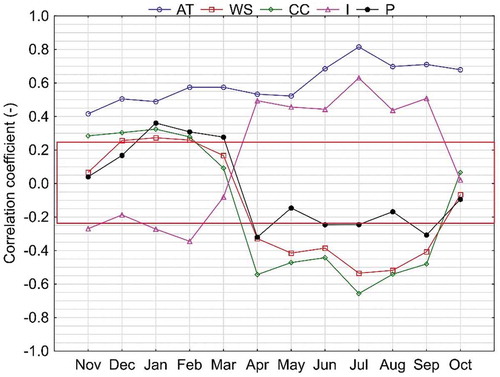
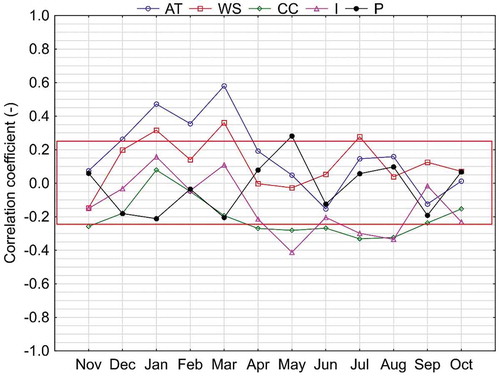
Analysing the correlations in individual months, water temperatures were the most strongly correlated with air temperatures; the coefficients ranged from 0.68 to 0.82 in the period from June to October (). From April to September, there was a positive correlation between insolation and water temperatures, and correlation coefficients ranged from 0.44 to 0.63. A negative correlation between water temperatures and cloud cover and wind speeds was observed from April to September. Taking into account a downward trend in cloud cover and wind speed from April to August with an upward trend in insolation, a further increase in water temperatures in Lake Hańcza should be expected.
Figure 8. Correlation between climatic conditions at the Suwałki station and water temperatures in Lake Hańcza between 1960 and 2019
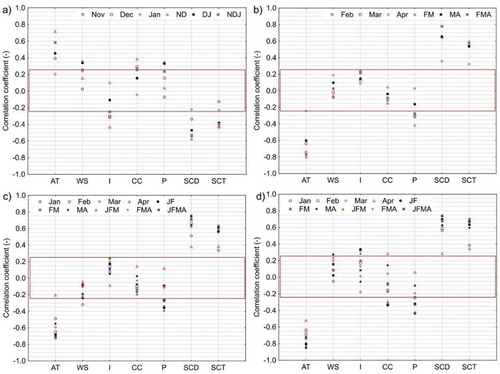
With regard to ice phenomena, in general, air temperatures and snow cover duration and thickness have the greatest impact on their occurrence (). ICD on Lake Hańcza and SCD at the Suwałki station between 1960 and 2019 were correlated at a level of 0.80. MICT, on the other hand, was correlated with maximum and average snow cover thickness at levels of 0.53 and 0.57, respectively. Moreover, ICS is less affected by wind speed, cloud cover, insolation and precipitation ()). Wind speeds, insolation and cloud cover did not affect ice cover end and duration on the analysed lake ( and (c)). The factors modifying MICT were insolation and cloud cover, as well as precipitation, mostly in January–February (JF), February–March (FM), and January–February–March (JFM) ()).
Figure 9. Correlation between climatic conditions at the Suwałki station and (a) ice cover start, (b) ice cover end, (c) ice cover duration and (d) maximum ice cover thickness
In the case of water levels, significant correlations were recorded only in reference to air temperatures in January, February and March, which indicates an increase in water levels as a result of the inflow from melting snow cover to the catchment area (()). Other parameters (including precipitation) had a smaller impact on water levels in the analysed case, which indicates a greater impact of extra-climatic and catchment conditions on this parameter.
Figure 10. Correlations between climatic conditions at the Suwałki station and water levels in Lake Hańcza between 1960 and 2019
4 Discussion and conclusions
The analysis of selected elements of the hydrological regime of the deepest lake in the central region of the North European Plain demonstrated that over the last 60 years, they have undergone changes of diversified direction and pace. One of the most fundamental problems facing humanity today is global warming, clearly visible in the increase in air temperature (Tomczyk and Bednorz Citation2020). It shows a strong correlation with a number of components of the environment and, consequently, leads to their transformation, which is clearly visible in water temperature, among other things (Ptak et al. Citation2019a). However, in the analysed case, correlations regarding thermal conditions are not as strong, and the calculated Pearson’s index is 0.66. The recorded situation is an effect of the morphometric features of the lake. A significant proportion of isolated water masses (hypolimnion thickness) amounts to approximately 90 m, i.e. 85% of the thermal perpendicular, which makes the surface water temperature less susceptible to weather conditions than in the case of shallower, more evenly stratified lakes.
A deep lake cools at a rate of less than half its average heating rate (Ferris and Burton Citation1988). At the moment of disappearance of the summer thermal stratification, the surface water layer is fed by a significant amount of water from deeper sections of the lake, which suppresses water–atmosphere correlations. This inertness of water temperatures in relation to atmospheric conditions is reflected in the rate of increase of the surface water temperature in Lake Hańcza, where, as research has shown, it is statistically significant but much lower than in the case of previously obtained results for other (shallower) lakes in northern Poland (Czernecki and Ptak Citation2018, Ptak et al. Citation2020a, Citation2020b).
The specific morphometric features of Lake Hańcza are also reflected in the time of the thermal regime change. Analysing 20 lakes in Central Europe, Woolway et al. (Citation2017) noted a change of regime by the end of the 1990s – a decade later than in other cases – only in the analysed lake. This is confirmed by the research conducted in this study, which takes into account an analysis period longer than in the above-mentioned work. Thus, it can be stated that thanks to its morphometric features, the previously indicated large depth and relatively small area, the analysed lake clearly “resisted” ongoing climate warming. As is emphasized by Skowron (Citation1999), the large proportion of the coldest waters (84%) in relation to the total volume of the lake is not only the result of depth but also of the small fetch length (0.66 km), which, as a result, leads to a low possibility of mixing (6.3 m). What is worth noting in relation to annual averages is that the heating rate of the water temperature was lower than the air temperature, which is also the opposite situation in the case of most lakes in the lake district in Poland. The faster increase of water temperature than air temperature is related to the acceleration of ice cover end dates (Kintisch Citation2015), which leads to the longer duration of thermal stratification of water and, consequently, the lengthier warming of its surface layer.
In the case of ice cover, no statistically significant changes were recorded for its start and end dates (and consequently its duration), with a simultaneous increase of annual average winter temperature (December–February) at the Suwałki station by 0.4°C·dec−1. During the period of ice cover formation, the water surface layer cools down more slowly, and this is why the water temperature exceeds 0°C later. As Magee and Wu (Citation2017) emphasize, a lake with a larger volume (or depth) will need more time to cool (or heat) than a lake with a similar surface but smaller volume (or depth). An analysis of ice conditions of six lakes in northern Poland (Marszelewski and Skorwon Citation2006) showed that the average ice cover start date in 1961–2000 on Lake Hańcza was 2 January, and this was the penultimate date among the lakes analysed. At this point, it should be noted that Lake Hańcza is located in northeastern Poland – a region considered one of the coldest in the country (Woś Citation2010) – so the reaction to the occurrence of a cold mass of air should, in theory, be the fastest.
Further comparison may be made with the results of the research on Lake Jagodne with a maximum depth of 37.4 m (approx. 75 km southwest of the analysed case), for which Ptak et al. (Citation2019b) determined the average ice cover start date as 29 December in the years 1975–2015, while in the case of Hańcza, it occurred a week later. As the study cited above indicates, these differences are blurred in the case of average ice cover end date, where external factors, rather than processes occurring within the lake, are crucial for its destruction. The only statistically significant changes in relation to the elements of the ice regime concerned MICT, which, in the years 1960–2019, became thinner at an average rate of 4.8 cm·dec−1.
Among the climatic parameters with statistically significant correlations with ice cover thickness, an upward trend of air temperature and insolation (affecting the reduction of ice thickness) and a downward trend of snow cover duration (which may isolate the impact of the two above) should be noted. The role of snow cover in the ice regime of lakes is well known, as confirmed by numerous studies in this area (Leppäranta Citation2010, Surdu et al. Citation2014, Ohata et al. Citation2017). Studies conducted by Fujisaki-Manome et al. (Citation2020) on the Laurentian Great Lakes have shown that snow cover has impacted the reduction of the total volume of ice in these lakes as a result of thermal reaction. Observations concerning Lake Morskie Oko (Tatra Mountains) show that ice thickness increased with an increase in snow cover thickness (Choiński et al. Citation2013). As a result of more extensive research in the area of the Tatra Mountains covering seven lakes, Solarski and Szumny (Citation2020) determined that at the beginning of the winter season, thick snow cover may slow down the accumulation of ice on the side of water, translating into a reverse correlation between snow cover and ice cover. In the following stages, a change in snow mass may affect the variability of ice cover growth. The described situation is confirmed by the results obtained in this paper, where a statistically significant correlation between snow thickness and ice thickness is a result of the melting and refreezing of the snow cover.
The combined effect of the changes recorded in this study, i.e. an increase in air temperature and insolation and a reduction in snow cover duration (the lack of an element causing its increase; see above), translated into a significant reduction of ice cover thickness. The results obtained in this area are consistent with the previous studies conducted for Lake Śniardwy, located in northeastern Poland (Ptak et al. Citation2020c).
The last element of the hydrological regime under consideration was water level fluctuations. For their annual average values over the entire period, an upward trend of 7.3 cm·dec−1 was recorded. However, the situation was not uniform. The increase had occurred from the beginning of the analysis until 1985, when the water level clearly stabilized. Statistical analysis showed that there was no connection between water level and precipitation – the key value influencing fluctuations. In the above situation, it is difficult to clearly define what caused the stability of the water level in the mid-1980s. The lack of direct correlation between precipitation and water levels provides the basis for determining that water circulation in the upper part of the Czarna Hańcza River (closed by Lake Hańcza) is dependent on other environmental factors. Water level fluctuations in a lake are associated with a complex, nonlinear process which integrates precipitation, tributary feed, topography, etc. (Li et al. Citation2016). It should be emphasized that there are no hydrotechnical buildings on Lake Hańcza itself, or within its vicinity (Górniak and Piekarski Citation2002), that could be used to control the water level. Therefore, the causes of this situation may lie above the lake, as indicated by the components of water balance mentioned earlier, which state that the surface inflow constitutes nearly 2/3 of the lake’s feed. Therefore, geomorphological and geological conditions and the use of the upper part of the catchment area of the Czarna Hańcza River are crucial.
The surroundings of Lake Hańcza have a very diversified glacial landform, which is made of glacial accumulation formations with a steep and wavy surface (Pachucki Citation1962). In turn, as Mitręga et al. (Citation1993) emphasize, Quatenary sediments of the Suwałki region are characterized by great lithological variability, which entails a large diversification of water permeability. As can be noted from the Szczegółowa … (Citation2017), a large part of the analysed fragment of the catchment area is occupied by glacial tills and permeable formations (sand, gravel). On the other hand, based on the data contained in the Objaśnienia … (Citation2012), it can be concluded that, among other things, the thickness of sand and sand with gravel in the valley of Czarna Hańcza does not exceed 3 m. Furthermore, peat and peat mud occurring in the depressions of upland areas and the valley reach a thickness of over 5 m.
The complex system of water circulation in the catchment area feeding Lake Hańcza outlined here may illustrate the lack of direct reaction of water levels to precipitation. As a result of underground circulation and runoff, precipitation is transformed before it reaches the river and then feeds the lake. As was determined, the annual amounts of precipitation in the analysed years did not reveal any statistically significant trends of change. It should be stressed, however, that in the same period, air temperature increased significantly, contributing to lower alimentation of aquifers (changes in hydrogeological conditions) or the river itself with rainwater as a result of evaporation. Furthermore, the gradual lowering of the water level, visible in the last decade, is well illustrated in , where the occurrence of maximum temperatures of air and water was the highest. The gradually lower water levels recorded during this period refer to previous studies conducted by Hamilton et al. (Citation2018), who, by simulating water level changes in Crystal Lake (USA), determined that it will continue to decrease, mainly in response to greater evaporation due to higher temperatures. These conditions are accompanied by human activity (reclamations) and beaver activity. According to information compiled by Żurowski (Citation1992), the beaver population nationwide is the highest in the Suwałki region. In relation to the upper section of the catchment area of Czarna Hańcza, the retention activity of beavers, among others, in the region of Kłapejda (approx. 950 m from Lake Hańcza) caused changes in the nature of river flow. According to Chybowski and Białkosz (Citation2013), the river, as a result of beaver activity, changed its hydraulic nature in this section, creating a sequence of stagnant floods. As shown in studies by Marszelewski et al. (Citation2016), beaver activity may be important for the course of fluctuations of water levels in selected lakes of the “Bory Tucholskie” National Park (northern Poland).
The functioning of deep lakes around the globe, particularly in reference to the observed climate changes, enjoys great scientific interest, and the discussed research issue has a broad range. In the case of Lake Constance (area 470 km2, maximum depth 252 m), research showed that volumetrically weighted average water temperatures have increased since the 1960s by an average of 0.017°C·year−1 (Straile et al. Citation2003). Lake Tahoe (501 km2, maximum depth 500 m), in the period 1970–2002, showed a warming of 0.015°C·year−1 (Coats et al. Citation2006). In their model for Lake Geneva (580 km2, maximum depth 309 m), Schwefel et al. (Citation2016) evidenced an increase in temperature throughout the water column, although surface water temperature increased faster than the waters of the hypolimnion (1.5°C and 0.7°C, respectively). In the case of Lake Baikal, the average water temperature since 1946 has increased by 1.21°C (Hampton et al. Citation2008). As further emphasized by the authors, Lake Baikal will be one of those most resistant to climate changes owing to its high volume. A similarly delayed response to common warming was recorded in the case of Lake Hańcza, which was analysed in this paper.
Analysis of the statistically significant results leads to the conclusion that gradually increasing water temperatures and a decrease in MICT are adverse changes to the analysed ecosystem. The temperature of water, which is its elementary feature, determines many processes occurring in lake ecosystems that impact its quality. Over the course of several dozen years, Lake Hańcza has changed its trophic state, from oligotrophic in the first half of the 20th century (Koźmiński Citation1932) into a lake with mesotrophic features (Sprawozdanie … Citation2017). Although catchment area factors are crucial in this respect – e.g. intensification of the agricultural economy in the catchment area of Czarna Hańcza, the impact of nearby villages (Sokołowski Citation2000) – the observed heating of water in the analysed period (in the period from June to August, the surface layer of water became 1.8°C warmer) hinders, among other things, the processes connected with its self-treatment and increases the lake’s susceptibility to degradation. The gradual increase in water temperature due to a close correlation with a number of other processes will cause other changes besides those already observed, e.g. in the current structure of ichthyofauna.
Thinner ice cover will, in turn, among other things, change the level of available light. As a result, photosynthesis will be less limited. This will result in a diversified development of phytoplankton and, later, zooplankton and higher trophic network components, which is crucial for further biological processes in the lake. As Sommer et al. (Citation2012) emphasize, the state of the ecosystem at the end of winter can be treated as a starting point for the initial stages of plankton succession in the new vegetation season. The gradual lowering of the water level observed in the last decade should also be considered unfavourable. This situation is the result of changes in the components of the water balance due to increased evaporation losses, and according to climate change scenarios, this process will deepen.
Summarizing the obtained results, it can be concluded that the hydrological regime of the deepest lake of the North European Plain reacted in a differentiated manner to the impact of climatic conditions. This statement can be applied both to the direction and rate of changes in water temperature, water level fluctuations and ice conditions. Nowadays, one of the biggest problems is global warming, commonly associated with an increase in air temperature, which in turn is strictly related to surface water temperatures in lakes. Although, in the analysed case, a statistically significant increase in this parameter was noted, its rate was much slower than in other (shallower) lakes of this region. Lake Hańcza, thanks to its morphometric features, has effectively resisted the effects of global warming, as previous studies have shown that the change in the thermic regime occurred a decade later than in other lakes in Central Europe. In the case of the ice regime, only MICT revealed a downward trend, while changes in the three other features (ice cover start, end and duration) were statistically nonsignificant in the analysed period. On the other hand, changes in water levels were primarily determined by local factors (catchment area conditions and lake morphometry).
The analysis of this case leads to the conclusion that specific morphometric features of lakes and their correlation with the catchment area can significantly modify the influence of overriding factors such as climate conditions. What is important is that these results can provide crucial data for studies on a wider range of objects, referring to larger regions or climate zones. Including cases that are specific in many respects may blur certain general patterns related to climate change. In addition, the results send a clear message to environmental management agencies that, in the context of further global warming, shallow lakes with no natural resistance to such impact should be a priority when being covered by any actions aimed at reducing this condition.
Supplemental Material
Download MS Word (73 KB)Disclosure statement
No potential conflict of interest was reported by the authors.
Supplementary material
Supplemental data for this article can be accessed here.
Additional information
Funding
References
- Adrian, R., et al., 2009. Lakes as sentinels of climate change. Limnology and Oceanography, 54 (6part2), 2283–2297. doi:10.4319/lo.2009.54.6_part_2.2283
- Alemayehu, T., McCartney, M., and Kebede, S., 2010. The water resource implications of planned development in the lake Tana catchment, Ethiopia. Ecohydrology and Hydrobiology, 10 (2–4), 211–221. doi:10.2478/v10104-011-0023-6
- Arkusz Jeleniewo, Radwanek-Bąk, et al., 2012. Objaśnienia do Mapy Geośrodowiskowej Polski 1:50000. Warszawa: Arkusz Jeleniewo, Państwowy Instytut Geologiczny.
- Apsite, E., et al., 2014. Long-term changes in hydrological regime of the lakes in Latvia. Hydrology Research, 45 (3), 308–321. doi:10.2166/nh.2013.435
- Bajkiewicz-Grabowska, E., 2008. Bilans wodny jeziora Hańcza. In: J. Kozłowski, P. Poczyczyński, and B. Zdanowski, eds. Środowisko i ichtiofauna jeziora Hańcza. Olsztyn: Wyd. IRŚ, 25–36.
- Bartosiewicz, M., et al., 2019. Effects of climate change and episodic heat events on cyanobacteria in a eutrophic polymictic lake. Science of the Total Environment, 693, 133414. Article number 133414. doi:10.1016/j.scitotenv.2019.07.220
- Ber, A., 1971. Mapa geologiczna Polski, arkusz Suwałki 1 : 200 000. Wyd. A i B z Objśnieniami. Warszawa: Wyd. Geol.. Ber, A. 2003 – Szczegółowa mapa geologiczna Polski 1 : 50 000, ark. Jeleniewo – reambulacja. Warszawa: Arch. CAG PIG.
- Ber, A., et al., 2017. Szczegółowa mapa Geologiczna Polski. Warszawa: Arkusz Jeleniewo, Państwowy Instytut Geologiczny.
- Choiński, A., et al., 2013. Areal variation in ice cover thickness on lake Morskie Oko (Tatra Mountains). Carpathian Journal of Earth and Environmental Sciences, 8 (3), 97–102.
- Chybowski, Ł. and Białkosz, W., 2013. Ichthyofauna of the upper course of the Czarna Hańcza River (Nemen river basin, Northeast Poland). Komunikaty Rybackie, 6, 6–10.
- Cleveland, W.S., 1979. Robust locally weighted fitting and smoothing scatterplots. Journal of the American Statistical Association, 74 (368), 829–836. doi:10.1080/01621459.1979.10481038
- Cleveland, W.S., 1981. LOWESS: a program for smoothing scatterplots by robust locally weighted regression. The American Statistician, 35 (1), 54. doi:10.2307/2683591
- Cleveland, W.S. and Devlin, S.J., 1988. Locally-weighted regression: an approach to regression analysis by local fitting. Journal of the American Statistical Association, 83 (403), 596–610. doi:10.2307/2289282
- Cleveland, W.S., Devlin, S.J., and Grosse, E., 1988. Regression by local fitting: methods, properties, and computational algorithms. Journal of Econometrics, 37 (1), 87–114. doi:10.1016/0304-4076(88)90077-2
- Coats, R., et al., 2006. The warming of Lake Tahoe. Climatic Change, 76 (1–2), 121–148. doi:10.1007/s10584-005-9006-1
- Cortés, A. and MacIntyre, S., 2020. Mixing processes in small arctic lakes during spring. Limnology and Oceanography, 65 (2), 260–288. doi:10.1002/lno.11296
- Czernecki, B. and Miętus, M., 2011. Comparison of thermal classification for selected regions of Poland. Przegląd Geofizyczny, 56, 201–233. (in Polish).
- Czernecki, B. and Ptak, M., 2018. The impact of global warming on lake surface water temperature in Poland - the application of empirical-statistical downscaling, 1971–2100. Journal of Limnology, 77 (2), 330–348. doi:10.4081/jlimnol.2018.1707
- Dembowska, E.A. and Kubiak-Wójcicka, K., 2017. Influence of water level fluctuations on phytoplankton communities in an oxbow lake. Fundamental and Applied Limnology, 190 (3), 221–233. doi:10.1127/fal/2017/0998
- Ferris, J.M. and Burton, H.R., 1988. The annual cycle of heat content and mechanical stability of hypersaline Deep Lake, Vestfold Hills, Antarctica. In: J.M. Ferris, et al., eds. Biology of the Vestfold Hills, Antarctica. Developments in hydrobiology. Vol. 34. Dordrecht: Springer, 115–128. doi:10.1007/978-94-009-3089-6_11
- Fox, A.D., et al., 2020. Relationships between breeding waterbird abundance, diversity, and clear water status after the restoration of two shallow nutrient-rich Danish lakes. Aquatic Conservation: Marine and Freshwater Ecosystems, 30 (2), 237–245. doi:10.1002/aqc.3260
- Fujisaki-Manome, A., et al., 2020. Simulating impacts of precipitation on ice cover and surface water temperature across large lakes. Journal of Geophysical Research: Oceans, 125. doi:10.1029/2019JC015950
- Gerten, D. and Adrian, R., 2001. Differences in the persistency of the North Atlantic oscillation signal among lakes. Limnology and Oceanography, 46 (2), 448–455. doi:10.4319/lo.2001.46.2.0448
- Gilbert, R.O., 1987. Statistical methods for environmental pollution monitorin. New York, NY: Van Nostrand Reinhold Co., 320.
- Górniak, A. and Piekarski, K., 2002. Seasonal and multiannual changes of water levels in Lakes of Northeastern Poland. Polish Journal of Environmental Studies, 11, 349–354.
- Gray, E., et al., 2019. Modelling lake cyanobacterial blooms: disentangling the climate-driven impacts of changing mixed depth and water temperature. Freshwater Biology, 64 (12), 2141–2155. doi:10.1111/fwb.13402
- Hamilton, D.P., et al., 2018. Ice cover and thermal regime in a dimictic seepage lake under climate change. Inland Waters, 8 (3), 381–398. doi:10.1080/20442041.2018.1505372
- Hampton, S.E., et al., 2008. Sixty years of environmental change in the world’s largest freshwater lake - Lake Baikal, Siberia. Global Change Biology, 14 (8), 1947–1958. doi:10.1111/j.1365-2486.2008.01616.x
- Hampton, S.E., et al., 2017. Ecology under lake ice. Ecology Letters, 20 (1), 98–111. doi:10.1111/ele.12699
- Inspektorat Ochrony Środowiska, 2017. Sprawozdanie z badań i wstępna ocena stanu jeziora Hańcza w 2016 roku. Suwałki: Inspekcja Ochrony Środowiska, Wojewódzki Inspektorat Ochrony Środowiska w Białymstoku, Delegatura w Suwałkach.
- Kann, J. and Walker, J.D., 2020. Detecting the effect of water level fluctuations on water quality impacting endangered fish in a shallow, hypereutrophic lake using long-term monitoring data. Hydrobiologia, 847 (8), 1851–1872. doi:10.1007/s10750-020-04215-z
- Kendall, M.G. and Stuart, A., 1968. The advanced theory of statistics, 3. London, UK: Charles Griffin Ltd.
- Kintisch, E., 2015. Earth’s lakes are warming faster than its air: first ever global survey reveals summer lake temperatures rising at an alarming rate. Science, 350 (6267), 1449. doi:10.1126/science.350.6267.1449
- Kozłowski, J., 2008. Ichtiofauna jeziora Hańcza. In: J. Kozłowski, et al., eds. Środowisko i ichtiofauna jeziora Hańcza. Olsztyn: Wyd. IRŚ, 121–124.
- Koźmiński, Z., 1932. O stosunkach tlenowych w jeziorze Hańcza na Suwalszczyźnie. Archiwum Hydrobiologii I Rybactwa, 6, 65–85.
- Lange, W., 1993. Jeziora jako obiekty badań geograficznych. In: W. Lange, ed. Metody badań limnologicznych. Gdańsk: Uniwersytet Gdański, 1–175.
- Leppäranta, M., 2010. Modelling the formation and decay of lake ice, the impact of climate change on European Lakes. In: D.G. George, ed. Aquatic ecology series 4. London, UK: Springer Science+Business Media B.V., 63–83.
- Li, B., et al., 2016. Comparison of random forests and other statistical methods for the prediction of lake water level: a case study of the Poyang Lake in China. Hydrology Research, 47, 69–83. doi:10.2166/nh.2016.264
- Lindenschmidt, K.E., Baulch, H., and Cavaliere, E., 2018. River and lake ice processes-Impacts of freshwater ice on aquatic ecosystems in a changing globe. Water, 10(11), 1586. Article number 1586. doi:10.3390/books978-3-03897-389-8
- Magee, M.R. and Wu, C.H., 2017. Effects of changing climate on ice cover in three morphometrically different lakes. Hydrological Processes, 31 (2), 308–323. doi:10.1002/hyp.10996
- Magnuson, J.J., et al., 2000. Historical trends in lake and river ice cover in the Northern Hemisphere. Science, 289 (5485), 1743–1746. doi:10.1126/science.289.5485.1743
- Marszelewski, W., et al., 2016. Stany wody w jeziorach PN “Bory Tucholskie”. In: A. Choiński, M. Kochanowska, and W. Marszelewski, eds. Przyroda abiotyczna Parku Narodowego Bory Tucholskie. Charzykowy: Park Narodowy, Bory Tucholskie, 263–274.
- Marszelewski, W. and Skowron, R., 2006. Ice cover as an indicator of winter air temperature changes: Case study of the Polish Lowland lakes. Hydrological Sciences Journal, 51(2), 336–349. doi:10.1623/hysj.51.2.336
- Missaghi, S., Hondzo, M., and Herb, W., 2017. Prediction of lake water temperature, dissolved oxygen, and fish habitat under changing climate. Climatic Change, 141 (4), 747–757. doi:10.1007/s10584-017-1916-1
- Mitręga, J., et al., 1993. Wody podziemne Suwalszczyzny. Przeglad Geologiczny, 41, 569–574.
- Mitręga, J. and Pachla, J.P., 1993. Warunki hydrogeologiczne jeziora Hańcza- Przewodnik LXIV zjazdu PTG na Ziemi Suwalskiej, wycieczka A-1- Suwałki Park Krajobrazowy. Warszawa: PIG.
- Nowak, B. and Ptak, M., 2018. The effect of a water dam on Lake Powidzkie and its vicinity. Bulletin of Geography. Physical Geography Series, 15 (1), 5–13. doi:10.2478/14110
- Obertegger, U., Obrador, B., and Flaim, G., 2017. Dissolved oxygen dynamics under ice: three winters of high-frequency data from Lake Tovel, Italy. Water Resources Research, 53 (8), 4246–7234. doi:10.1002/2017WR020599
- Ohata, Y., Toyota, T., and Fraser, A.D., 2017. The role of snow in the thickening processes of lake ice at Lake Abashiri, Hokkaido, Japan. Tellus, Series A: Dynamic Meteorology and Oceanography, 69(1), 1391655. Article number 1391655. doi:10.1080/16000870.2017.1391655
- Pachucki, C., 1962. Uwagi o geomorfologii doliny Czarnej Hańczy. Geological Quarterly, 6, 176–183.
- Pettitt, A.N., 1979. A non-parametric approach to the change-point problem. Applied Statistics, 28 (2), 126–135. doi:10.2307/2346729
- Pochocka-Szwarc, K., et al., 2013. Hańcza Lake – preliminary results of the geological interpretation of sonograph images. Przegląd Geologiczny, 61, 187–194. (in Polish).
- Popielarczyk, D., et al., 2015. Using the geodetic and hydroacoustic measurements to investigate the bathymetric and morphometric parameters of Lake Hancza (Poland). Open Geosciences, 7, 854–869. doi:10.1515/geo-2015-0067
- Ptak, M., et al., 2020a. Tendenzen der Veränderungen der Wassertemperatur von Seen in Nord-Ost-Polen. WasserWirtschaft, 4, 42–46.
- Ptak, M., et al., 2020b. Effect of climate warming on a change in thermal and ice conditions in the largest lake in Poland – Lake Śniardwy. Journal of Hydrology and Hydrodynamics, 68 (3), 260–270. doi:10.2478/johh-2020-0024
- Ptak, M. and Nowak, B., 2016. Variability of oxygen-thermal conditions in selected lakes in Poland. Ecological Chemistry and Engineering S, 23 (4), 639–650. doi:10.1515/eces-2016-0045
- Ptak, M., Sojka, M., and Kozłowski, M., 2019a. The increasing of maximum lake water temperature in lowland lakes of Central Europe: case study of the Polish Lakeland. Annales De Limnologie - International Journal of Limnology, 55, 6. Article number 6. doi:10.1051/limn/2019005
- Ptak, M., Sojka, M., and Nowak, B., 2019b. Changes in ice regime of Jagodne Lake (North-Eastern Poland). Acta Scientiarum Polonorum Formatio Circumiectus, 18 (1), 89–100. doi:10.15576/ASP.FC/2019.18.1.89
- Ptak, M., Sojka, M. and Nowak, B., 2020c. Effect of climate warming on a change in thermal and ice conditions in the largest lake in Poland – Lake Śniardwy. Journal of Hydrology and Hydrodynamics, 68 (3), 260–270. doi:10.2478/johh-2020-0024
- R Core Development Team, 2005. R: a language and environment for statistical computing. Vienna: R Foundation for Statistical Computing.
- Schneider, P. and Hook, S.J., 2010. Space observations of inland water bodies show rapid surface warming since 1985. Geophysical Research Letters, 37 (22). Article number L22405. doi: 10.1029/2010GL045059
- Schwefel, R., et al., 2016. Effects of climate change on deepwater oxygen and winter mixing in a deep lake (Lake Geneva): comparing observational findings and modelling. Water Resources Research, 52 (11), 8811–8826. doi:10.1002/2016WR019194
- Skowron, R., 1999. Letnia stratyfikacja termiczna wody w Jeziorze Hańcza. Acta Universitatis Nicolai Copernici, Geografia XXIX-Nauki Matematyczno-Przyrodnicze, 103, 247–256.
- Sokołowski, A.W., 2000. Zagrożenie jeziora Hańcza. Chronmy Przyrode Ojczysta, 56, 86–89.
- Solarski, M. and Szumny, M., 2020. Conditions of spatiotemporal variability of the thickness of the ice cover on lakes in the Tatra Mountains. Journal of Mountain Science, 17 (10), 2369–2386. doi:10.14430/arctic2550
- Sommer, U., et al., 2012. Beyond the plankton ecology group (PEG) model: mechanisms driving plankton succession. Annual Review of Ecology, Evolution, and Systematics, 43 (1), 429–448. doi:10.1146/annurev-ecolsys-110411-160251
- Straile, D., Jöhnk, K., and Henno, R., 2003. Complex effects of winter warming on the physicochemical characteristics of a deep lake. Limnology and Oceanography, 48 (4), 1432–1438. doi:10.4319/lo.2003.48.4.1432
- Surdu, C.M., et al., 2014. Response of ice cover on shallow lakes of the North Slope of Alaska to contemporary climate conditions (1950–2011): radar remote-sensing and numerical modeling data analysis. The Cryosphere, 8 (1), 167–180. doi:10.5194/tc-8-167-2014
- Szczepański, A., 1961. Charakterystyka limnologiczna jeziora Hańcza. Polskie Archiwum Hydrobiologii, 9, 9–18.
- Tanentzap, A.J., et al., 2008. Cooling lakes while the world warms: effects of forest regrowth and increased dissolved organic matter on the thermal regime of a temperate, urban lake. Limnology and Oceanography, 53 (1), 404–410. doi:10.4319/lo.2008.53.1.0404
- Tomczyk, A.M. and Bednorz, E., 2020. The extreme year—analysis of thermal conditions in Poland in 2018. Theoretical and Applied Climatology, 139 (1–2), 251–260. doi:10.1007/s00704-019-02968-9
- Woś, A., 2010. Climate of Poland in the second half of the 20th century. Poznań, Poland: Wyd. UAM. (in Polish).
- Woolway, R.I., et al., 2017. Warming of Central European lakes and their response to the 1980s climate regime shift. Climatic Change, 142 (3–4), 505–520. doi:10.1007/s10584-017-1966-4
- Wrzesiński, D., 2019. Badania nad wpływem Oscylacji Północnoatlantyckiej na reżim hydrologiczny rzek i jezior w Polsce. In: Styszyńska, A., Błaś, M. and Migała, K, eds, NAO – jej istota, przyczyny i konsekwencje. Wrocław: IGiRR Uniwersytet Wrocławski, Stowarzyszenie Klimatologów Polskich, 47–62
- Wrzesiński, D. and Ptak, M., 2016. Water level changes in Polish lakes during 1976–2010. Journal of Geographical Sciences, 26 (1), 83–101. doi:10.1007/s11442-016-1256-5
- Wrzesiński, D., Ptak, M., Plewa, K., 2018. Effect of the North Atlantic Oscillation on water level fluctuations in lakes of Northern Poland. Geographia Polonica, 91 (2), 243–259. doi:10.7163/GPol.0119
- Yao, X., et al., 2016. Spatial-temporal variations of lake ice phenology in the Hoh Xil region from 2000 to 2011. Journal of Geographical Sciences, 26 (1), 70–82. doi:10.1007/s11442-016-1255-6
- Zdanowski, B., 2008. Środowisko abiotyczne jeziora Hańcza. In: J. Kozłowski, et al., eds. Środowisko i ichtiofauna jeziora Hańcza. Olsztyn: Wyd. IRŚ, 59–73.
- Zdorovennov, R.G., et al., 2016. Optical properties of lake Vendyurskoe. Geography, Environment, Sustainability, 9 (3), 74–87. doi:10.15356/2071-9388_03v09_2016_05
- Żurowski, W., 1992. Building activity of beavers. Acta theriologica, 3, 403–411.