
 ?Mathematical formulae have been encoded as MathML and are displayed in this HTML version using MathJax in order to improve their display. Uncheck the box to turn MathJax off. This feature requires Javascript. Click on a formula to zoom.
ABSTRACT
This study investigated the impacts of climate and socio-economic changes on water resources in the Beas-Sutlej river basin, Himalaya. Multiple-model ensembles of five climate models forced with the Representative Concentration Pathway (RCP) 8.5 scenario and the Shared Socio-economic Pathway SSP 1 were used. A validated Water Evaluation And Planning (WEAP) model of the basin was used for assessing the resulting sectoral water allocations. The results showed increasing runoff during the pre-monsoon and monsoon seasons, principally as the respective consequences of increased glaciers melting and higher rainfall. The finding also indicates that ensemble mean annual irrigation water demand will decrease by between 8 and 13% in Punjab due to the conversion of agricultural land to urban centres but will increase in Rajasthan by about 14%. These outcomes will be useful for the Bhakra and Beas Management Board in developing adaptation strategies to cope with any future water shortages that may occur in the basin.
Editor S. Archfield Associate editor S. Pande
Introduction
The Himalayas are a strategic freshwater source for 1.9 billion people across multiple South Asian river basins. In India alone, more than 900 million people rely on its water resources for agricultural, domestic, and industrial uses. However, theover demand for water in India has dramatically increased over the last few decades due to rapid population and socio-economic growth whilst the quality and quantity of the available water resources are declining due to the impacts of climate and other environmental changes (Joseph et al. Citation2020, Dau et al. Citation2021a). Shivakoti et al. (Citation2016) predict that the scarcity of water, energy, and food will probably increase by 40–50% by 2050 in Asia. For example, India is already the world’s second most populous country, but its population is projected to rise to more than 1.5 billion by 2030 and 1.7 billion by 2050 (UN Citation2019). Such a phenomenal population growth will result in high water demand, place stress on natural resources, and ultimately stifle regional economic development.
Climate change has also been recognized as a major threat to the security of freshwater resources in the Himalayan region. According to the Intergovernmental Panel on Climate Change (IPCC), India could face the harshest effects of global warming, including high levels of inequality and poverty (IPCC Citation2018). A major aspect of this is the rising temperature which has been shown to have increased by 0.74°C in the past 10 decades in the Himalaya (Du et al. Citation2004), and more significant rises of 2.36 to 5.51°C are projected for the end of the century (Chaturvedi et al. Citation2014). Increasing temperatures will result in drastic glacier losses and alteration of the hydrologic balance. The Himalayan glaciers are retreating rapidly, with an estimated average thinning rate of 0.3 to 1 m/year (Dyurgerov and Meier Citation2005). The equivalent water loss is an estimated 6.6 ± 1 Gt/year (Kulkarni and Karyakarte Citation2014). Glacier and seasonal snow melt currently contributes about 70% of the annual runoff to the Indus, Ganges, and Kabul rivers (Kattelmann Citation1987, Barnett et al. Citation2005). Within the Indus basin specifically, the glacier and snow melt contribution to the annual runoff is 59% in the Sutlej River at the Bhakra Dam, and 35% to the Beas River at Pandoh Dam (Kumar et al. Citation2007).
Although both groundwater (47%) and surface water (53%) resources are deployed to meet domestic and agricultural needs in the region (Vashisht Citation2008, CGWB Citation2020), the focus of this investigation is on the surface water resources and the two large reservoirs – Bhakra and Pong. This decision stemmed from the multipurpose use of these reservoirs for flood control and hydropower generation, in addition to domestic and irrigation water supply needs shared with groundwater resources. Thus, any deleterious impact of climate and socio-economic changes on the surface water resources will have profound consequences, beyond those affecting agriculture.
As implied in the foregoing, the Himalayan surface freshwater resources are vital for sustaining agricultural production in the Indus basin by supporting large-scale irrigation projects in the states of Punjab, Rajasthan, and Haryana. The amount of surface water currently available and used for irrigation is about 17.91 BCM (billion cubic metres) in Punjab, 17.0 BCM in Haryana, and 10.45 BCM in Rajasthan, but there remains a huge gap between this supply and the demand, especially in Rajasthan, which is the driest of the states, with almost 70% of its area classified as arid or semi-arid (RajRAS Citation2018, Rawat et al. Citation2018). This pressure on the basin’s water resources is expected to grow significantly in the future due to rising population and climatic change. Additionally, the two reservoirs also currently generate about 9000 GWH of electricity (2000 GWH at Pong reservoir and 7000 GWH at Bhakra reservoir), representing about 48% of the total energy needs of the three states. However, there is strong evidence of declining hydropower generation in the region. Official data of the Central Electricity Authority (CEA) show that the electricity generated per MW of installed generating capacity on the Beas and Sutlej has dropped by 18% and 31%, respectively, between 1998–1999 and 2012–2013 (SANDRP Citation2013a, Citation2013b). These reductions can be attributed to the declining water resources in the two basins, a situation that will worsen in the future as projected climate and socio-economic changes take hold.
The analysis reported in this work has been restricted to one RCP 8.5 and one Shared Socio-economic Pathway (SSP)1 for the sake of brevity, but with justification. The first reason is that studies investigating this mix of scenarios, while they exist for the whole of India (see e.g. Chatuvedi et al. Citation2017, Mittal et al. Citation2019, Chaturvedi et al. Citation2020, Bhadoriya et al. Citation2020, Sarkar and Maity Citation2020), are limited for the Himalayas area. The unique characteristics of the Himalayas in terms of snow/glacier and liquid precipitation contributions to the water resources demand that the impact of the scenario mix is objectively investigated. The high-emission RCP8.5 scenario was chosen because it represents business as usual and thus is very likely to represent the pathway for most of India as the country embarks on its extensive industrialization agenda aimed at lifting its population out of poverty. This industrialization is likely to rely on coal and other fossil-fuel-based energy generation systems, which do little to cut greenhouse gas emissions, and hence emissions will likely continue to rise throughout the 21st century. The adoption of the SSP1 scenario, which envisions a world of sustainability-focused growth and equality, although it may initially seem at odds with the high energy use envisioned by RCP8.5 is nonetheless compatible with the poverty-reduction agenda of the Indian government (Chatuvedi et al. Citation2017). SSP1 would be a reasonable assumption for the country without a global climate policy, as now seems likely, and the ambition of India to increase its renewable energy contribution to the energy mix by 175 GW by mid-century (Shukla et al. Citation2015, Chaturvedi et al. Citation2020). The “green road” pathway signified by SSP1 will thus assist in mitigating the consequences of the high-emission RCP8.5 climate scenario.
The aim of this study is to assess the effects of climate and socio-economic changes on the water resources system in the Beas-Sutlej River basin. The objectives are to:
Produce representative projections of climate (temperature, precipitation) change in the basins based on RCP8.5 and ensembles of five Coupled Model Intercomparison Project Phase 5 (CMIP5) General Circulation Models (GCMs) dynamically downscaled for the mid- and end-century;
Produce SSP1 projections of land use and population changes in the basins;
Develop changes in the runoff resulting from the projected climate and land use changes using a previously calibrated and validated whole basin Water Evaluation And Planning (WEAP) model;
Implement simulations of the mix of climate, land use and population scenarios in WEAP to assess the performance of the water resources system in meeting the irrigation and hydropower needs in the basin, and make recommendations.
The remainder of the manuscript is organised as follows: next the study area is presented. This is followed by the Section that details the methodology and data, which is followed by the results and discussion Section. The final conclusions and recommendations are then presented in the last Section.
Study area
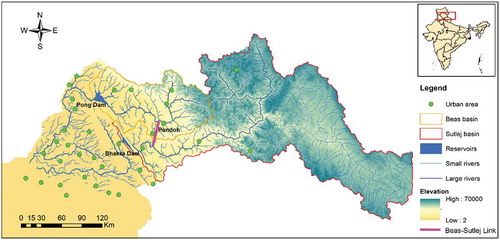
The Beas-Sutlej river basin (see ) has a total area of 76 400 km2, of which 34 100 km2 is in the Indian states of Himachal Pradesh and Punjab, and 42 300 km2 is in the Tibet Autonomous region, China. The Beas River originates from the upper part of the Himalayas and is wholly within India, whereas the Sutlej starts near Lake Rakhastal in the Tibetan Plateau (TP) outside India and then flows through Himalayan gorges before merging with the Beas at a location near Punjab State. There are two main water resource facilities in the basin – the Pong dam on the Beas River and Bhakra dam on the Sutlej – whose associated reservoirs serve large-scale irrigation projects, generate hydro-electric power and provide flood relief (Adeloye et al. Citation2019). Records of measured runoff at the inlets of the reservoirs as well as at four other sites – Thalout, Namgia, Nadaun, and Kasol (see locations in the section describing the WEAP modelling below) – were available for the study.
Figure 1. The Beas-Sutlej river basin, India
According to the India Ministry of Agriculture, the gross irrigated area is 7.442 million hectares (Mha) in Punjab, 5.446 Mha in Haryana and 8.09 Mha in Rajasthan (DAC Citation2018). In terms of crop production, Punjab produces mostly wheat, rice, and cotton. In Haryana, the Kharif crops are sugarcane, wheat, groundnut, maize, and paddy, while barley and cotton are grown in the Rabi season. Similarly, the Kharif crops in Rajasthan are bajra, pulses, jowar, maize, and groundnut, while the Rabi crops consist of barley, wheat, gram, and oilseeds (DAC Citation2018).
Rainfall mostly occurs in the monsoon season, between July and late September. The average annual rainfall is about 1800 mm at the Beas catchment and 1200 mm at the Sutlej catchment. The temperature lapse rate in the Western Himalayas ranges between 0.6 and 0.74°C/100 m (Jain et al. Citation2008), producing mean annual temperatures between −22.2 and +23.3°C depending on the altitude. In the TP where the Sutlej originates, climate is both drier and warmer in comparison to the Himalayan watershed (You et al. Citation2008). For example, the average annual rainfall in the TP is about 250 mm, while the annual minimum temperature is approximately −10 to +4°C and the annual maximum temperature is between 5 and 20°C (Ding et al. Citation2018), which has increased by about 1.8°C since the 1960s (Wang et al. Citation2017). Snow meltwater has recently shown an increase in the Himalaya during the summer due to the rising temperatures (Kulkarni and Karyakarte Citation2014).
Materials and methods
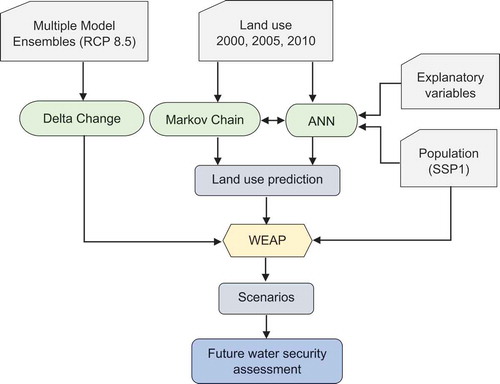
A schematic of the methodology used is shown in ; the individual components are described in detail below.
Figure 2. Schematic diagram of the research methodology
Data collection
Monthly precipitation and temperature data were obtained from the Bhakra and Beas Management Board (BBMB) for the period 1990–2007, which formed the baseline. Humidity and wind speed data were derived from the National Aeronautics and Space Administration (NASA) Science Mission Directorate’s Satellite (NASA Citation2018). Monthly streamflow data for the four gauged sites and reservoir inlets, and other reservoir information such as bathymetric data and releases, were obtained from the BBMB and various other sources. For future climate projections relative to current conditions, multimodel ensembles (Taylor et al. Citation2012) of five CMIP5 models, namely CanESM2 (2.79°× 2.81°), CNRM-CM5 (1.40°× 1.40°), EC-EARTH (1.12°× 1.12°), GFDL-CM3 (2°× 2.5°), and HadGM2-AO (1.25°× 1.87°), were used (see ).
Table 1. List of Coupled Model Intercomparison Project Phase 5 (CMIP5) climate models used
As will be seen in the next section, the downscaling of the future projections relied on the delta change approach applied on the bias-corrected Weather Research and Forecasting (WRF) high-resolution (5 km × 5 km) “hindcast” simulated baseline climate (Bannister et al. Citation2019). Our choice of the delta approach stems from the fact that it is simple and provides a more consistent approach when multiple GCMs, as considered herein, are involved. While it is possible to achieve spatial resolution downscaling using various forms of statistical and dynamical schemes (Wilby and Dawson Citation2013), these often introduce another layer of uncertainty into the analysis. Using the delta change approach avoids this uncertainty.
For describing the spatial variability of vegetation and land use, land cover maps (version 2.0.7) at 300 m spatial resolution developed by the European Space Agency Climate Change Initiative (ESA-CCI) for the years 2000, 2005, and 2010 were used (UCLouvain Citation2017). The Land and Water Development Division – Food and Agriculture Orgnisation (FAO) soil type map was also used to provide an overview of the soil distribution with respect to the soil moisture conditions of irrigation lands. Other physical datasets such as elevation, slope, roads, and river were reanalysed using the ASTER Global Digital Elevation Model (DEM) data at 30 m resolution (USGS Citation2018).
Population is an important driver for understanding potential future interactions between climate and changes in human society, not only in irrigation but also in relation to domestic water consumption. While the main consumptive water demand in the basin is irrigation, there is modest withdrawal for domestic needs, including for by New Delhi, which derives some of its drinking water from the basin and which may be impacted by population changes. This study used a time slice of projected population at 10-year intervals from 2020 to 2100 for the SSP1 scenario, obtained from the Climate and Global Dynamics Laboratory (CGD Citation2020) – part of the National Centre for Atmospheric Research (NCAR). The data have a 1/8-degree resolution as downscaled by Jones and O’Neill (Citation2016) and 1-km grid cells re-downscaled by Gao (Citation2017). These population data were used to quantify the future domestic water consumption.
Downscaling the climate model with the delta change approach
Projected rainfall and temperature data for the RCP8.5 scenario were downscaled using the delta change approach proposed by (Lenderink et al. Citation2007).
For precipitation, the delta change is given by:
And for temperature, the delta change is given by:
where is precipitation,
is temperature,
refers to a future time slice,
refers to the historical (i.e. observed) baseline period, and
refers to the specific month.
Once the delta changes were obtained, they were applied to the high-resolution (5 km × 5 km) climate “hindcast” of the baseline developed with WRF dynamical downscaling model to provide the corresponding high-resolution future climate projections for month m and year y, as given in EquationEquations (2a(2a)
(2a) ) and (Equation2b
(2b)
(2b) ). The WRF downscaling was forced with the ERA-Interim historical climate data. With appropriate bias correction subsequently applied, the resulting downscaled data exhibited high accuracy in its simulation of local-level climate patterns in the basin (Bannister et al. Citation2019).
Using EquationEquations (2a(2a)
(2a) ) and (Equation2b
(2b)
(2b) ), future projections with respect to the mid-century (2033–2050) and end-century (2083–2100) were then developed.
Projected land use change with Markov chain analysis
Markov chain analysis is a dynamic process based on the Markovian random process, which has been used extensively for projecting land cover change (Fathizad et al. Citation2015, Gibson et al. Citation2018, Dau et al. Citation2021a). The method requires the transition probability matrix, which gives the probability of land cover changes from one period to another. Once the transition probability matrix is known, the state of the system after one transition becomes (Marko et al. Citation2016, Hamad et al. Citation2018, Liping et al. Citation2018):
where St is the state of the system at time t, St+1 is the state at time t + 1 (i.e. after a single transition), and is the transition probability matrix given by:
The elements of
represent the probability of the system transitioning from state (land use type) i to state (land use type) j and n is the total number of land use types. When i = j, the system is persistent, i.e. no transition has taken place; otherwise, there is transition. Thus, the main diagonal elements of matrix
contain the persistent probabilities.
The main task for the land use cover change projections therefore is the determination of the transition probability matrix. One popular approach that has been used is to model the relationship between land use patterns and those factors that have been known to influence them. For example, it has been noted that land use is dependent on various explanatory variables such as such as elevation, slope, distance to urban area, rivers, roads, population, and gross domestic product (GDP), which can serve as factors for explaining how potential transitions of land use change respond to socio-economic changes. Given that the relationship may be complex and difficult to express in closed mathematical forms, a data-driven, multilayer perceptron artificial neural network (ANN) was used to model the relation between the explanatory variables as inputs and the transition probabilities as output. Once trained and validated, the resulting model can be used to obtain the transition probabilities for future time slices once projections of the explanatory variables are known.
The use of ANN for modelling environmental systems is well known and no useful purpose will be served by repeating its details here. The performance of the multilayer perceptron (MLP) during training is measured by root mean square error (RMSE) and R2.
For model validation, the kappa statistic was used for assessing the agreement between two categorical images, where each cell in maps has a multinomial distribution among any number of categories. Details of the kappa statistic are available elsewhere (e.g. Monserud and Leemans Citation1992, Pontius Citation2000, Citation2002). Agreement in cells of compared maps uses the information of location and quantity, and the kappa index of agreement is obtained using the following equation:
where is the observed proportion correction;
is the expected proportion correction due to chance; and
is the proportion correction when the classification is perfect for both location and quantity.
Land cover maps for the years 2000 and 2005 were used for training and testing, respectively, and the map for 2010 was used for validation.
WEAP allocation modelling
The Water Evaluation and Planning (WEAP) model developed by the Stockholm Environment Institute (SEI) (Sieber and Purkey Citation2011) has been widely used worldwide for many regional water allocation problems (e.g. Dau et al. Citation2018, Citation2021b, Kou et al. Citation2018, Dau and Kuntiyawichai Citation2020).
A schematic system of the WEAP model for the Beas-Sutlej river basin is presented in . Catchments were defined based on the of river systems within the basin, and then subdivided into different elevation bands (of roughly 600 m). Total runoff was calculated using two compartments of the soil water balance (Yates et al. Citation2005): the upper compartment that simulates surface runoff when forced with rainfall and evapotranspiration; and the lower compartment that simulates baseflow. Glacier volume changes was modelled in WEAP by multiplying the ice depth by the sub-basin area containing snow and ice. The projected glacier area was obtained from a recent study by CitationPrasad et al. (2019). Fuller details of the rainfall–runoff modelling of WEAP are available elsewhere (Dehghanipour et al. Citation2019, Sridharan et al. Citation2019, Rajeevan and Mishra Citation2020). Model calibration and validation were performed using historical records of flow at four gauging stations (Thalout, Namgia, Kasol, and Nadaun – see ) and the historical storage levels at the Pong and Bhakra reservoirs. The main inputs and outputs of the WEAP model are summarized in .
Table 2. Inputs and outputs for the Water Evaluation and Planning (WEAP) model
Figure 3. Schematic of the WEAP model for the Beas-Sutlej river basin, India
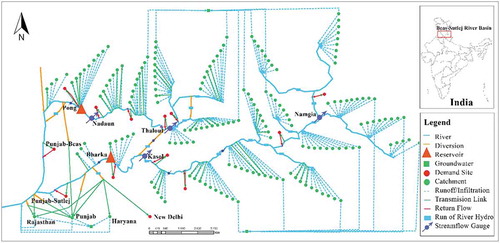
As shown in , a number of domestic water demand centres rely on the basin’s water resources. For example, New Delhi takes some of its water supply from the basin, and any significant growth in the Delhi population will negatively impact the reliability of the domestic sector allocation. According to WaterAid-India (Citation2005), daily water consumption per capita in India is estimated to be 40 L for rural areas and 135 L in urban areas. The impact of this on the overall system reliability, however, will be minimal given the dominance of irrigation water allocation over all other sectors.
As for irrigation demand, WEAP uses the MABIA (MAitrise des Besoins d’Irrigation en Agriculture) (Sieber and Purkey Citation2011, Agarwal et al. Citation2019) method to determine actual evapotranspiration or irrigation demands in the Punjab, Rajasthan, and Haryana states. MABIA uses the “dual ” method to determine the actual evapotranspiration from the reference crop evapotranspiration, ETo. ETo is estimated directly in WEAP using the Penman-Monteith formulation (Allan et al. Citation1998), which allows estimates to change as the weather factors – temperature, humidity, sunshine hours, etc. – change.
The performance of the reservoirs in meeting the various demands from their allocations was characterized using the usual indices (Adeloye and Dau Citation2019): time reliability (; volume reliability (
); and vulnerability (
). The time reliability is the ratio of the number of occasions the demand (irrigation, domestic or hydropower) was fully met to the total number of periods in the simulation. The volumetric reliability is similar to the time reliability, but instead of counting the time periods, the actual volume of water supplied is compared with the actual demand in each period. Given that the time domain reliability fails to take into account the severity of water shortage, the volumetric reliability is usually higher than the time reliability for any given water resource system (McMahon and Adeloye Citation2005). Finally, the vulnerability is a measure of the impact of water shortage and is usually estimated as the mean of the maximum water shortage occurring across the series of water shortage sequences in the simulation. The evaluation of these performance indices uses EquationEquations (5
(5)
(5) –Equation7
(7)
(7) ); further explanations (including worked examples) on how to obtain them are provided by McMahon and Adeloye (Citation2005).
where, is the total number of months out of N months that demand was met;
and
are the number of continuous sequences of failure periods and the total duration of the failures, respectively; and
and
are the actual demand and supply, respectively.
Scenario testing for future water demand
Recent debates have focused on the relative significance of climate and non-climate (socio-economic) change effects of water security. While some have argued that climate effects are more significant (Dau et al. Citation2017, Kuntiyawichai et al. Citation2017), others have concluded that the impacts of socio-economic effects are more important (e.g. Ausseil et al. Citation2019, Dau et al. Citation2021a). As is common with these debates, most of the evidence is anecdotal with very limited systematic analyses to back it up. The scenarios investigated in this study are meant to provide such evidence.
The scenarios tested are summarized in based on climate change (RCP 8.5) and socio-economic change (SSP1), the latter as represented by the land use and population projections. To accommodate the between-GCM uncertainties in climate projections, five GCMs are forced with RCP 8.5 to produce outputs for mid-century and end-century. Scenarios 1 and 2 test climate change and socio-economic change, respectively, and hence their relative importance. In scenario 3, the combined effects of climate and socio-economic changes are tested. Scenario 3 is more realistic than scenarios 1 and 2 because it recognizes that both climate and socio-economic changes will be occurring in tandem rather than either in isolation.
Table 3. Scenario testing for water security in the Beas-Sutlej river basin
Results and discussion
Climate projections: rainfall and temperature projections
For the purpose of this discussion, the parts of the catchment before the Pong and Bhakra dams are referred to as the upstream part of the basin, and the areas below these dams that comprise the irrigation fields are the downstream part. ) presents a summary of the upstream catchment precipitation, which was obtained by finding the arithmetic average at the 176 stations used in the WRF downscaling (see CitationBannister et al. 2019). Compared to the baseline, ) reveals that the monthly precipitation will increase in this upstream part of the basin, which if it materializes is a welcome development for the consumptive needs of the basin. In particular, there are significant rises in the monsoon months in the mid-century for most of the GCMs, with only one (GFDL-CM3) projecting a drier situation when compared with the baseline. The highest monthly rise during the monsoon season was projected by the CanESM2 model. The increased monsoon wetness situation in the end-century is less dramatic but still discernible. When aggregated for the whole year, the projected precipitation increased for all of the GCM models, with the annual increase ranging from 15 to 40% in the mid-century relative to the baseline. The projected annual increase in the end-century is between 10 and 30%, which is less than the mid-century effects in accordance with monthly precipitation impacts.
Figure 4. Monthly projections and annual changes for (a) precipitation and (b) temperature in the upstream of the Himalayas
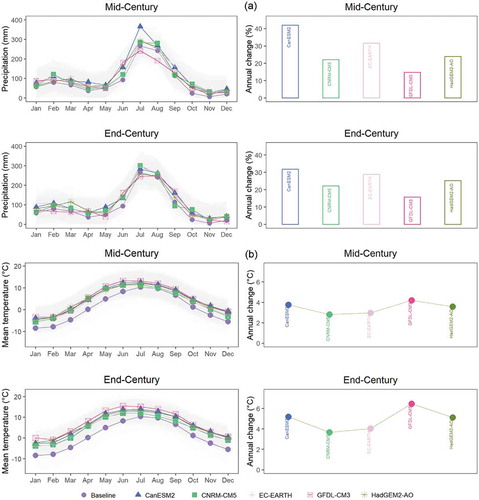
The temperature changes are shown in ), from which it is clear that all the GCMs are projecting hotter situations in the mid- and end-century relative to the baseline. The annual change in temperature varied between approximately 3 and 6°C across the GCMs, with the highest rise indicated by the GFDL-CM3 model projection.
The changes in both the precipitation and the temperature will affect the hydrology and runoff upstream of the two dams and hence the performance of the dams. They will not, however, affect the water needs in the downstream part of the basin where the irrigation fields are located. Unfortunately, the WRF downscaling did not cover the downstream irrigation plains and therefore the output of another regional climate model (RegCM4 forced with ERA-Interim) was used. RegCM4 resolution (~0.5°) is much coarser than the 5 km × 5 km of the WRF and was spatially aggregated to the areas in each state that are irrigated from canal water released from the reservoirs. For the future projections of climate in the downstream area, a similar approach to the upstream was used, with the exception that the delta changes were applied to the RegCM4 baseline outputs instead of the WRF outputs used upstream.
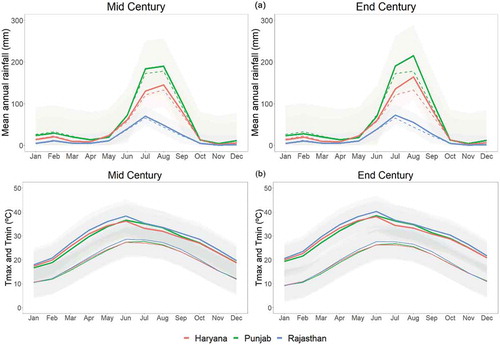
The ensemble mean rainfall projection at mid- and end-century for the three states is summarized in ) alongside the baseline rainfall. As was observed for the upstream part, the projected future rainfall is more than the baseline, with Punjab showing the highest increase, especially at end-century. A feature of ) is that the relative dryness of Rajasthan in the baseline will not change much in the future, making this state the most challenging for adaptation if water needs should increase. This will be compounded by the higher temperature in Rajasthan (relative to the other states), as shown in ), which is likely to produce higher evaporative demands.
Figure 5. Ensemble mean of monthly (a) rainfall (dotted lines are the baseline) and (b) maximum and minimum temperature in irrigated areas
Socio-economic projections
Projected population in the future
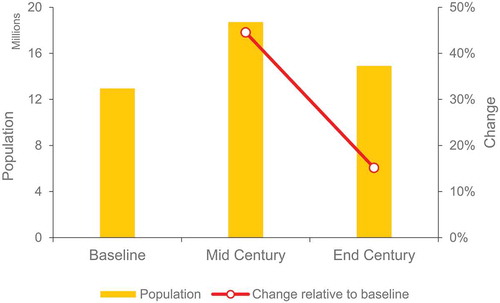
shows the projections for population under SSP1 in the study area. The population will rapidly increase in the mid-century by 45%, but by the end of the century, this population will fall back to only 15% above the baseline, with implications for the demand centre allocation. This accords with the SSP1 narrative, with the increase at mid-century being the result of the increasing trend from the past, but as sustainable development tenets (improvement of education, health services, employment prospects, etc.) kick in, the population will gradually decrease towards the end-century. Population effects on water security are not limited to what happens within the study area alone but include externalities. For example, New Delhi derives some of its water supply from the study area and its population is projected to increase by 72% and 94% in mid- and end-century, respectively, with implications for the water resources in the Beas-Sutlej. As noted earlier, these are significant population changes; however, when translated to water allocation, this is only about 1 BCM, much smaller than the current irrigation demand of 61.5 BCM in Punjab State alone.
Figure 6. Projected population under SSP1 in the Beas-Sutlej river basin
Land use change projection
Seven basic explanatory variables were used in the Beas-Sutlej river basin for land use change projections, as listed in . The correlation of these variables with land use change was determined using Cramer’s phi ( test, which is derived from Pearson’s Chi-squared statistic (Cramér Citation1946). The classification of each explanatory variable is based on the suggestion by Akoglu (Citation2018), i.e.
>0.25 is very strong; >0.15 is strong; >0.10 is moderate; >0.05 is weak; and 0 is not meaningful. The obtained
values are presented in , from which it is clear that most are strongly or very strongly correlated with land use pattern.
Table 4. Explanatory variables for land use change projection
The R2 of the MLP neural network in modelling the transition probability was very high (>0.83) during both the training and testing stages. The RMSE index varied between 0.01 and 0.37, which is very low. Additionally, the performance of the Markov chain simulation was assessed by comparing the simulated and observed land maps in 2010, i.e. kappa indices of agreement, and this was greater than 96.43%. compares the observed and simulated land use for an independent year (2010) which further confirms the high efficacy of the Markov chain model. With regard to the irrigated land, which is the main water demand sector, the model predicted the 2010 situation with only 0.2% underprediction error, which is very reassuring. The urban population was overpredicted with a 0.4% error, which is equally low and should be of little or no concern given the small contribution of urban water to the total demand mix.
Table 5. Observed and simulated land use
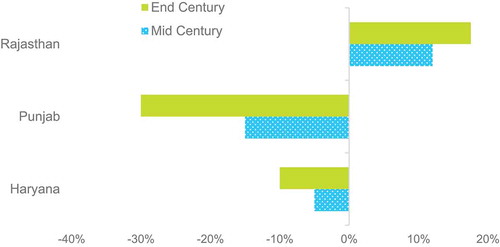
With the Markov chain model satisfactorily validated, it was used to project land use change for 5-year intervals between 2020 and 2100, and the results are shown in . It should be stressed here that the land use projection considered the entire study area, downstream and upstream; however, although the disaggregated details are not shown here, the changes in the upstream part were much modest than those projected for the downstream irrigation areas. Thus, much of the discussion henceforth will focus on the downstream areas, where irrigation activities are intensive and threats of water stress will be hugely felt. suggests that irrigation land will decrease in the Punjab by 15 to 30%, whereas it will decrease by 5 to 10% in Haryana. These findings are consistent with the observed trend during 2000 to 2005 (see ), where around 31 300 ha of irrigation land was lost due to the conversion of agricultural lands to urban centres. In contrast, Rajasthan irrigation land is expected to expand by between 12 and 18% in the future compared to the baseline period. This increment agrees with the historical data of net irrigation area in Rajasthan under canal irrigation, which was 941 000 ha in 1980–1981 but which increased to 1 928 000 ha in 2014–2015, a rise of more than 100%. While the projected rises in the mid- and end-century are not as dramatic, they are nonetheless plausible. Furthermore, based on historical land use data, a large area of shrub land has been shifted and replaced by the irrigation land, and this contributed to the dramatic expansion relative to the historical era.
Figure 7. Land use changes for mid- and end-century
Water demand allocation in different scenarios using the WEAP model
Baseline
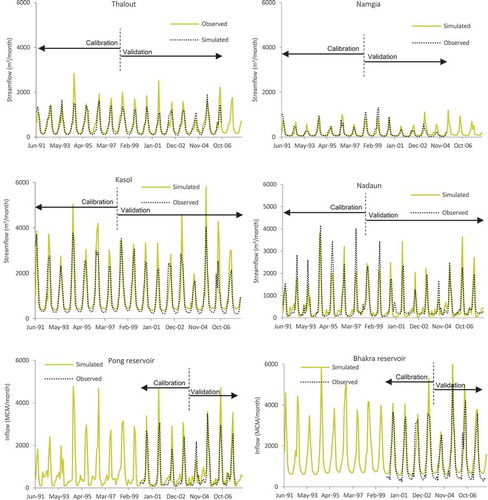
The performance of the rainfall–runoff simulation by WEAP is illustrated in which compares the measured and simulated flows at the gauged sites in the basin. In general, the performance is good, as confirmed by both the Nash-Sutcliffe efficiency criterion (Nash and Sutcliffe Citation1970) and the correlation coefficient (R) during calibration as follows: Thalout (
, R = 86%), Namgia (
, R = 80%), Namdaun (
, R = 90%), Kasol (
, R = 81%), Pong (
, R = 84%), and Bhakra (
, R = 87%). The performance of the model at the reservoir sites during low-flow conditions is very good, which is important because the low flows determine the performance of reservoirs in meeting the demand obligations placed on them. It is therefore important that the low-flow parts of the hydrographs are simulated satisfactorily.
Figure 8. Simulated and observed monthly streamflow during calibration and validation
The simulated mean annual runoff was 8.77 BCM in the Beas River at the Pong reservoir; the corresponding value in the Sutlej River at the Bhakra dam was 21.71 BCM. The average (over the 1990–2007 baseline period) total annual irrigation water demand in the states of Punjab, Haryana, and Rajasthan as simulated in WEAP was 24 BCM, comprising Punjab = 11.10 BCM, Haryana = 6.32 BCM and Rajasthan = 6.58 BCM. These allocations reflect the relative sizes of the irrigation lands in the respective states and the water needs of the cultivated crops, as discussed. The simulated total annual hydropower projection at the Pong and Bhakra reservoirs was 11 908 MW, comprising 2130 MW at the Pong and 9778 MW at Bhakra. Compared to the installed capacity at the plants, these outputs represent significant underperformance.
Scenario 1: climate change
The simulated runoff is summarized in for all of the GCM projections. As expected from the projected rainfall, all the GCMs apart from GFDL-CM3 project higher annual runoff in both the Beas and Sutlej Rivers. For example, the ensemble mean annual runoff simulated in the Beas River is 8.93 BCM (mid-century) and 10.14 BCM (end-century) under scenario 1, both of which are higher than the baseline mean annual runoff of 8.77 BCM. For the Sutlej River, the ensemble mean annual runoff is 22.92 BCM in the mid-century and 22.99 BCM in the end-century, also higher than the baseline (by 6%). The simulation suggests that there is minimal change in irrigation water demand, because irrigation water requirement is highly dependent on the amount of water consumed by crops and vegetation. The consumed water is the product of land area and evapotranspiration. The land area has not changed in this scenario, but the climate has changed, and both the temperature and rainfall are projected to increase. Increasing rainfall implies less need for irrigation water. Temperature is an input in the evapotranspiration calculation but several other weather variables, e.g. wind speed, solar radiation, sunshine hours, etc. that also feature in the calculation have been assumed to be constant. All of these have combined to produce the modest change in irrigation water demand for this scenario. For hydropower, the annual figure shows an enhancement of hydropower production in the future of 12 148 to 12 511 MW.
Table 6. Runoff generations in the Beas and Sutlej rivers measured at the Pong and Bhakra reservoirs
The WEAP simulations also showed that mean annual glacier volume in the Himalayas would decrease from the baseline value of approximately 1403 BCM to 1197 BCM by mid-century (a reduction of 14.5%) and to 876 BCM by end of century, a reduction of 37.5%.
Scenario 2: socio-economic change (i.e. baseline climate with changed land use and population)
Land use change, such as conversion of agricultural areas to urban areas, is expected to affect the runoff response upstream and hence the performance of the reservoirs; and the evapotranspiration and hence the irrigation water demand in the downstream area. Increases in population will also affect the domestic water demand, albeit in a less dramatic way. In scenario 2, the climate remains the baseline climate but the land use and population are those projected for the future. As shown in for scenario 2, the mean annual runoff at the Beas and Sutlej rivers is only slightly changed in the future compared to the baseline situations. This accords with the modest changes in the upstream land use situation, as noted.
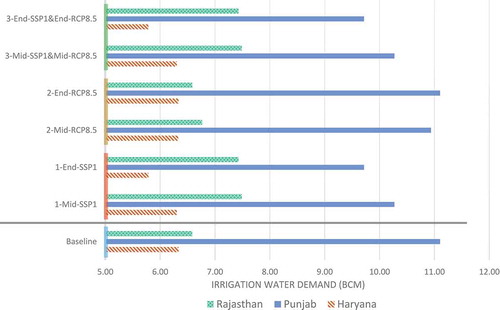
As for the downstream areas where significant land use shifts have occurred, the irrigation water demands have been significantly impacted. For example, the simulated total mean annual irrigation water demand decreased from the baseline of 24 BCM to 22.93 BCM (i.e. –4.45%) in the end-century (see ). The reduction is due to change in the cultivated land area downstream, which has decreased via conversion to urban centres. This finding ultimately suggests that climate change has less impact on irrigation water demand than do land use and other socio-economic changes. The hydropower generation under this scenario was approximately 11 923 MW, which is nearly equivalent to the baseline.
Figure 9. Mean of the projected irrigation water demand for different scenarios
Scenario 3: socio-economic change and climate change (land use, population and climate)
The runoff response for this scenario summarized in shows that the ensemble mean annual runoff will rise by 1.25% (mid-century) and 13.9% (end-century) in the Beas River; the corresponding rises in the Sutlej River are 5.94% and 6.06%, respectively. Compared to scenario 1 (with runoff rises of 1.8% and 15.6% in the mid- and end-century, respectively), this mixed scenario 3 results in slightly less water availability at the Beas basin. However, scenario 3 is much better from a runoff point of view than scenario 2, which had produced a slight reduction (−0.8%) in the ensemble mean runoff relative to the baseline. The situation of the mixed scenario (scenario 3) at the Sutlej is much closer to both its scenario 1 and 2 projections. As a reminder, these runoff changes relate to the upstream where, as noted, the simulated changes in land use were minimal and hence any changes in runoff would be dictated by the climate driver. The simulated runoff changes for scenario 3 are therefore as expected from the outcomes of scenarios 1 and 2.
The irrigation demands for scenario 3 are also shown in . This shows that the mean irrigation water demand will decrease from 24 to 22.93 BCM annually in the end-century. Although full details are omitted here, there was significant between-GCM variability in the simulated irrigation water demand, with Punjab registering reductions that ranged between 8 and 13% depending on the GCM; the corresponding range for Haryana was 1 to 9%. Irrigation water demand rose as expected for Rajasthan, by 13–14% depending on the GCM, but given that the basin-wide irrigation water projection under scenario 3 was a reduction, the increase at Rajasthan was not sufficient to offset the reductions at both Punjab and Haryana. In any case, these changes agree with the land use changes reported in , in which it was revealed that significant conversion of irrigation lands will take place at both Punjab and Haryana, whereas the reverse is projected for the State of Rajasthan. Since irrigation water demand is directly related to the area of land under cultivation, it is not at all surprising that the irrigation water demand is significantly influenced by land use change.
Reservoir performance
Although references were made in the preceding sections to the irrigation water allocations and generated hydropower, the actual performance of the Pong and Bhakra reservoirs in supplying these needs have not been discussed.
The performance indices of the water resource systems in meeting the irrigation water demands were calculated using EquationEquations (5(5)
(5) –Equation7
(7)
(7) ). The reduction in irrigation lands in the Punjab has no doubt translated into much better performance of the water resource systems in satisfying the smaller demand. As indicated in , the time- and volume-based reliability (89% and 90%, respectively) at Punjab in the future exceed those of the baseline (80% and 85%, respectively). The same is true for Haryana State, where the time- and volume-based reliability (77% and 80%, respectively) in the future also exceed the baseline (75% and 76%, respectively). More importantly, the vulnerability that characterizes the maximum single-period water shortage in Punjab will decrease significantly, from 45% (baseline) to 25% (end-century). Similarly, at Haryana, the vulnerability will decrease from 26% to 20%.
Figure 10. Performance indices for irrigation water allocation at (a) mid-century and (b) end-century based on different scenarios
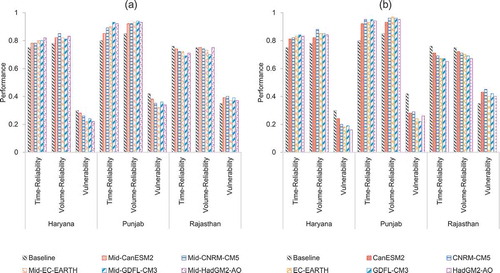
Due to the expansion of agriculture land in the future, the reliability of the irrigation water demand in Rajasthan is expected to decrease from 74% to 67% (time domain) and from 75% to 70% (volume domain). At the same time, vulnerability will increase from 30% to 40%.
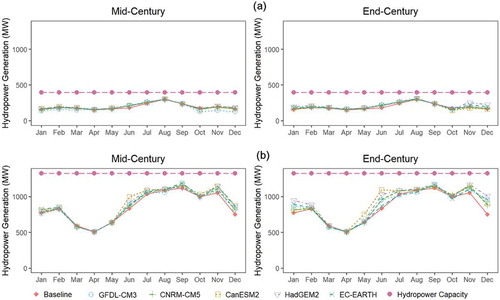
The performance in relation to hydro-electric power generation at both the Pong and Bhakra reservoirs is shown in . The hydropower performance has been enhanced at the Pong and Bhakra reservoirs, as one would expect from the increased runoff projected for the future and the smaller irrigation water demand, both of which will enhance the available head for hydropower generation at both reservoirs. The results also show that apart from during the monsoon months, generation was lower than the installed capacity at both plants. Nevertheless, in relation to its demand requirements, power generated by the Bhakra reservoir reveals a more reliable performance compared to the Pong reservoir. The study also suggests that hydropower production in the system would be sufficient, except for a slight shortage (about 1.5 billion kWh) in the mid-century due to increasing urban demands under the SSP1 projection.
Figure 11. Hydropower generation at the (a) Pong and (b) Bhakra reservoirs for different scenarios
Conclusions
Evaluation of the effects of global climate and socio-economic changes on water resource security in the Beas-Sutlej river basin in the India Himalaya was carried out. Multimodel ensemble simulations forced with RCP8.5 climate were used to produce the future climate, while population and land-use situations were derived from the SSP1 scenario. These were combined to develop three possible future scenarios, namely climate change alone (scenario 1), land use change alone (scenario 2), and mixed climate and land use change (scenario 3). These derived scenarios were used to force a calibrated and validated WEAP model of the basin to produce future water availability situations.
The results reveal significant between-GCM variability but consistent higher runoff during the pre-monsoon and monsoon seasons, as consequence of glacier melting associated with rising temperature and the heavy rainfall for scenario 1. The impact of this on downstream irrigation water demand was minimal since any increase in the evapotranspiration (and hence irrigation water demands) due to the rising temperature appeared to be cancelled out by the higher rainfall. For scenario 2, extensive analyses of land use changes in the downstream irrigation areas suggest large shifts of irrigation lands to urban centres in the downstream states of Punjab and Haryana, whereas the opposite occurred in the State of Rajasthan. The simulated land use change in the upstream parts of the basin was minimal, resulting in little effect on the runoff response. The effects of these land use changes were significant decreases in annual irrigation water demands at Punjab (down by 13% on average) and Haryana (down by 9% on average). Conversely, the requirement at Rajasthan increased by 14%. The outcome for scenario 3, which combined both climate and land use change, was not very different from that of scenario 2 because of the dominance of socio-economic (land use) impacts over climate change impacts. In terms of the performance implications for the two reservoirs, the Pong and Bhakra, there were general improvements because of the enhanced runoff in the upstream part and reduced irrigation water demands in the downstream. Also, due to high inflows expected to arrive at the Pong and Bhakra reservoirs in the future and the reduced allocation to irrigation needs, hydropower generation at the two reservoirs is projected to be enhanced in the future, leading to improved performance.
All of the above insights will be useful for planning adaptation strategies to cope with the drivers (climate and socio-economic changes) of water insecurity in the Beas-Sutlej river basin. The study is, however, not without its limitations, which must be borne in mind. The first is that we have only employed a single RCP and SSP, and while we have tried to justify our actions, it might be necessary to also explore other possibilities and compare the outcomes with the results obtained here. Our use of the delta change approach for downscaling the climate data may also warrant scrutiny, by implementing more formal statistical and dynamical downscaling approaches and comparing the outcomes with the approach we adopted here. Finally, the water demand and allocation outcomes have been affected by the operational policies for the Pong and Bhakra reservoirs. Our use of the WEAP tool has constrained us to use its default zone-based rule curves, but there is no guarantee that the operators of the reservoirs will operate according to these default policies, meaning that the actual outcomes may be different. A further limitation of the default curves is that they are developed by trial and error and hence may not be optimal.
Acknowledgements
The work reported here was funded by the UK-NERC (Project NE/N016394/1) – “Sustaining Himalaya Water Resources in a Changing Climate (SusHi-Wat)” – as part of the UK–India Newton- Bhabha Sustainable Water Resources (SWR) thematic programme.
Data availability
The data that support the findings of this study are openly available in [4TU.Research Data] at http://doi.org/10.4121/uuid:b55e1df0-7dd2-4c25-bb26-54fe1121f7c8.
Disclosure statement
No potential conflict of interest was reported by the authors.
Additional information
Funding
References
- Adeloye, A.J., et al., 2019. Height–area–storage functional models for evaporation-loss inclusion in reservoir-planning analysis. Water, 11 (7), 1413. doi:10.3390/w11071413
- Adeloye, A.J. and Dau, Q.V., 2019. Hedging as an adaptive measure for climate change induced water shortage at the Pong reservoir in the Indus Basin Beas River, India. Science of the Total Environment, 687, 554–566. doi:10.1016/j.scitotenv.2019.06.021
- Agarwal, S., et al., 2019. Assessment of water supply-demand using water evaluation and planning (WEAP) model for Ur River watershed, Madhya Pradesh, India. Journal of the Institution of Engineers (India): Series A, 100, 21–32. doi:10.1007/s40030-018-0329-0
- Akoglu, H., 2018. User’s guide to correlation coefficients. Turkish Journal of Emergency Medicine, 18 (3), 91–93. doi:10.1016/j.tjem.2018.08.001
- Allan, R., et al., 1998. Crop evapotranspiration-guidelines for computing crop water requirements-FAO irrigation and drainage paper 56 (Vol. 56). Available from: http://www.fao.org/3/x0490e/x0490e00.htm [Accessed 20 Jun 2018].
- Ausseil, A.G.E., et al., 2019. Towards an integrated assessment of climate and socio-economic change impacts and implications in New Zealand. Environmental Modelling & Software, 119, 1–20. doi:10.1016/j.envsoft.2019.05.009
- Bannister, D., et al., 2019. Bias correction of high-resolution regional climate model precipitation output gives the best estimates of precipitation in Himalayan catchments. Journal of Geophysical Research: Atmospheres, 124 (24), 14220–14239. doi:10.1029/2019jd030804
- Barnett, T.P., Adam, J.C., and Lettenmaier, D.P., 2005. Potential impacts of a warming climate on water availability in snow-dominated regions. Nature, 438 (7066), 303–309. doi:10.1038/nature04141
- Bhadoriya, U.P.S., et al., 2020. Implications of climate change on water storage and filling time of a multipurpose reservoir in India. Journal of Hydrology, 590, 125542. doi:10.1016/j.jhydrol.2020.125542
- CGD (Climate and Global Dynamics Laboratory), 2020. Spatial population scenarios. Available from: http://www.cgd.ucar.edu/iam/modeling/spatial-population-scenarios.html [Accessed 15 Jan 2020].
- CGWB (Central Ground Water Board), 2020. State profile. India: Central Ground Water Board, Ministry of Jal Shakti, Department of Water Resources, River Development and Ganga Rejuvenation. Available from: http://cgwb.gov.in [Accessed 16 Dec 2020].
- Chaturvedi, R.K., et al., 2014. Glacial mass balance changes in the Karakoram and Himalaya based on CMIP5 multi-model climate projections. Climatic Change, 123 (2), 315–328. doi:10.1007/s10584-013-1052-5
- Chaturvedi, V., et al., 2020. Cooperation or rivalry? Impact of alternative development pathways on India’s long-term electricity generation and associated water demands. Energy, 192, 116708. doi:10.1016/j.energy.2019.116708
- Chatuvedi, V., et al., 2017. Implications of shared socio-economic pathways for India’s long-term electricity generation and associated water demands. New Delhi: Council on Energy, Environment and Water.
- Cramér, H., 1946. Mathematical Methods of Statistics (PMS-9). Vol. 9. New Jersey, USA: Princeton University Press.
- DAC (Department of Agriculture Cooperation), 2018. State farmer guide. Available from: http://farmech.dac.gov.in [Accessed 10 Jan 2019].
- Dau, Q.V. and Kuntiyawichai, K., 2020. Identifying adaptive reservoir operation for future climate change scenarios: a case study in Central Vietnam. Water Resources, 47 (2), 189–199. doi:10.1134/S009780782002013X
- Dau, Q.V., Kuntiyawichai, K., and Adeloye, A.J., 2021b. Future changes in water availability due to climate change projections for Huong Basin, Vietnam. Environmental Processes, 8, 77–98. doi:10.1007/s40710-020-00475-y
- Dau, Q.V., Kuntiyawichai, K., and Plermkamon, V., 2017. Quantification of flood damage under potential climate change impacts in Central Vietnam. Irrigation and Drainage, 66 (5), 842–853. doi:10.1002/ird.2160
- Dau, Q.V., Kuntiyawichai, K., and Suryadi, F.X., 2018. Drought severity assessment in thelower Nam Phong River Basin, Thailand. Songklanakarin Journal of Science and Technology, 40 (4), 985–992. doi:10.14456/sjst-psu.2018.99
- Dau, Q.V., Momblanch, A., and Adeloye, A.J., 2021a. Adaptation in a Himalayan water resources system under a sustainable socio-economic pathway in a high-emission context. Journal of Hydrologic Engineering, 26 (3), 04021003. doi:10.1061/(ASCE)HE.1943-5584.0002064
- Dehghanipour, A.H., et al., 2019. A WEAP-MODFLOW surface water-groundwater model for the irrigated Miyandoab plain, Urmia lake basin, Iran: multi-objective calibration and quantification of historical drought impacts. Agricultural Water Management, 223, 105704. doi:10.1016/j.agwat.2019.105704
- Ding, J., et al., 2018. Monthly and annual temperature extremes and their changes on the Tibetan Plateau and its surroundings during 1963–2015. Scientific Reports, 8 (1), 11860. doi:10.1038/s41598-018-30320-0
- Du, M., et al., 2004. Mutual influence between human activities and climate change in the Tibetan Plateau during recent years. Global and Planetary Change, 41 (3), 241–249. doi:10.1016/j.gloplacha.2004.01.010
- Dyurgerov, M.B. and Meier, M.F., 2005. Glaciers and the changing earth system: a 2004 Snapshot. www.instaar.colorado.edu.
- Fathizad, H., Rostami, N., and Faramarzi, M., 2015. Detection and prediction of land cover changes using Markov chain model in semi-arid rangeland in western Iran. Environmental Monitoring and Assessment, 187 (10), 629. doi:10.1007/s10661-015-4805-y
- Gao, J., 2017. Downscaling global spatial population projections from 1/8-degree to 1-km grid cells. NCAR Technical Note NCAR/TN-537+STR. National Center for Atmospheric Research, 9. doi:10.5065/D60Z721H
- Gibson, L., et al., 2018. Future land cover change scenarios in South African grasslands - implications of altered biophysical drivers on land management. Heliyon, 4 (7), e00693–e00693. doi:10.1016/j.heliyon.2018.e00693
- Hamad, R., Balzter, H., and Kolo, K., 2018. Predicting land use/land cover changes using a CA-Markov model under two different scenarios. Sustainability, 10 (10), 3421. doi:10.3390/su10103421
- IPCC (Intergovernmental Panel on Climate Change), 2018. Global warming of 1.5°C (An IPCC special report on the impacts of global warming of 1.5°C above pre-industrial levels and related global greenhouse gas emission pathways, in the context of strengthening the global response to the threat of climate change, sustainable development, and efforts to eradicate poverty). Available from: www.ipcc.ch/sr15 [Accessed 12 Sep 2020].
- Jain, S.K., Goswami, A., and Saraf, A.K., 2008. Determination of land surface temperature and its lapse rate in the Satluj River basin using NOAA data. International Journal of Remote Sensing, 29 (11), 3091–3103. doi:10.1080/01431160701468992
- Jones, B. and O’Neill, B.C., 2016. Spatially explicit global population scenarios consistent with the Shared Socioeconomic Pathways. Environmental Research Letters, 11 (84003). doi:10.1088/1748-9326/11/8/084003
- Joseph, N., et al., 2020. Investigation into sustainable water use in India using combined large-scale earth system-based modelling and census-based statistical data. Journal of Hydrology, 587, 124930. doi:10.1016/j.jhydrol.2020.124930
- Kattelmann, R., 1987. Uncertainty in assessing Himalayan water resources. Mountain Research and Development, 7 (3), 279–286. doi:10.2307/3673206
- Kou, L., et al., 2018. Simulation of urban water resources in Xiamen based on a WEAP model. Water, 10 (6), 732. doi:10.3390/w10060732
- Kulkarni, A. and Karyakarte, Y., 2014. Observed changes in Himalayan glaciers. Current Science, 106 (2), 237–244.
- Kumar, V., Singh, P., and Singh, V., 2007. Snow and glacier melt contribution in the Beas River at Pandoh Dam, Himachal Pradesh, India. Hydrological Sciences Journal, 52 (2), 376–388. doi:10.1623/hysj.52.2.376
- Kuntiyawichai, K., et al., 2017. Climate change vulnerability mapping for the Greater Mekong Sub-region. Chiang Mai University Journal of Natural Sciences, 16 (3), 165–173. doi:10.12982/CMUJNS.2017.0013
- Lenderink, G., Buishand, A., and van Deursen, W., 2007. Estimates of future discharges of the river Rhine using two scenario methodologies: direct versus delta approach. Hydrology and Earth System Sciences, 11 (3), 1145–1159. doi:10.5194/hess-11-1145-2007
- Liping, C., Yujun, S., and Saeed, S., 2018. Monitoring and predicting land use and land cover changes using remote sensing and GIS techniques—A case study of a hilly area, Jiangle, China. PLOS ONE, 13 (7), e0200493. doi:10.1371/journal.pone.0200493
- Marko, K., Zulkarnain, F., and Kusratmoko, E., 2016. Coupling of Markov chains and cellular automata spatial models to predict land cover changes (case study: upper Ci Leungsi catchment area). IOP Conference Series: Earth and Environmental Science, 47, 012032. doi:10.1088/1755-1315/47/1/012032
- McMahon, T.A. and Adeloye, A., 2005. Water resources yield. Littleton, Colorado, USA: Water Resources Publications.
- Mittal, S., Ahlgren, E.O., and Shukla, P.R., 2019. Future biogas resource potential in India: a bottom-up analysis. Renewable Energy, 141, 379–389. doi:10.1016/j.renene.2019.03.133
- Monserud, R.A. and Leemans, R., 1992. Comparing global vegetation maps with the Kappa statistic. Ecological Modelling, 62 (4), 275–293. doi:10.1016/0304-3800(92)90003-W
- NASA (National Aeronautics and Space Administration), 2018. Data to information. Available from: www.science.nasa.gov/data-information [Accessed 15 Aug 2019].
- Nash, J.E. and Sutcliffe, J.V., 1970. River flow forecasting through conceptual models part I — a discussion of principles. Journal of Hydrology, 10 (3), 282–290. doi:10.1016/0022-1694(70)90255-6
- Pontius, R., 2000. Quantification error versus location error in comparison of categorical maps. Photogrammetric Engineering & Remote Sensing, 66 (8), 1011–1016.
- Pontius, R., 2002. Statistical methods to partition effects of quantity and location during comparison of categorical maps at multiple resolutions. Photogrammetric Engineering and Remote Sensing, 68 (10), 1041–1050.
- Prasad, V., et al., 2019. Large losses in glacier area and water availability by the end of twenty-first Century under high emission scenario, Satluj Basin, Himalaya. Current Science, 116, 1721–1730. doi:10.18520/cs/v116/i10/1721-1730
- Rajeevan, U. and Mishra, B.K., 2020. Sustainable management of the groundwater resource of Jaffna, Sri Lanka with the participation of households: insights from a study on household water consumption and management. Groundwater for Sustainable Development, 10, 100280. doi:10.1016/j.gsd.2019.100280
- RajRAS (Rajasthan Administrative Services), 2018. Rajasthan geography. RajRAS. Available from: https://books.google.fr/books?id=AX6kDwAAQBAJ [Accessed 20 Aug 2020].
- Rawat, S., Lahari, S., and Gosain, A., 2018. Integrated water resource assessment of irrigation system of Haryana. Agricultural Sciences, 9, 489–510. doi:10.4236/as.2018.94034
- SABDRP (South Asia Network on Dams, Rivers and People), 2013a. Hydropower generation performance in Beas River basin. South Asia Network on Dams, Rivers and People. New Delhi, India. Available from: http://www.sandrp.in [Accessed 21 Dec 2020].
- SABDRP (South Asia Network on Dams, Rivers and People), 2013b. Hydropower generation performance in Sutlej River basin. South Asia Network on Dams, Rivers and People. New Delhi, India. Available from: http://www.sandrp.in [Accessed 21 Dec 2020].
- Sarkar, S. and Maity, R., 2020. Increase in probable maximum precipitation in a changing climate over India. Journal of Hydrology, 585, 124806. doi:10.1016/j.jhydrol.2020.124806
- Shivakoti, G., et al., 2016. Redefining diversity and dynamics of natural resources management in Asia, Volume 4: the reciprocal relationship between governance of natural resources and socio-ecological systems dynamics in West Sumatra Indonesia. Amsterdam, Netherlands: Elsevier.
- Shukla, P., et al., 2015. Pathways to deep decarbonization in India. SDSN - IDDRI. Available from: http://deepdecarbonization.org/wp-content/uploads/2015/09/DDPP_IND.pdf [Accessed 26 Apr 2020].
- Sieber, J. and Purkey, D., 2011. WEAP, water evaluation and planning system [User guide]. Available from: https://www.weap21.org [Accessed 15 Jan 2019].
- Sridharan, V., et al., 2019. The Impact of climate change on crop production in Uganda—An integrated systems assessment with water and energy implications. Water, 11 (9), 1805. doi:10.3390/w11091805
- Taylor, K.E., Stouffer, R.J., and Meehl, G.A., 2012. An overview of CMIP5 and the experiment design. Bulletin of the American Meteorological Society, 93 (4), 485–498. doi:10.1175/BAMS-D-11-00094.1
- UCLouvain, 2017. ESA climate change initiative - land cover. Available from: http://maps.elie.ucl.ac.be/CCI/viewer/download.php [Accessed 15 Feb 2019].
- UN (United Nations), 2019. World population prospects 2019: highlights. Available from: www.un.org [Accessed 14 Jun 2020].
- USGS, 2018. ASTER global digital elevation model. Available from: https://asterweb.jpl.nasa.gov/gdem.asp [Accessed 10 Feb 2019].
- Vashisht, A., 2008. Status of water resources in Punjab and its management strategies. Journal of Indian Water Resources Society, 28, 1–8.
- Wang, X., et al., 2017. Evaluation of climate on the Tibetan Plateau using ERA-Interim reanalysis and gridded observations during the period 1979–2012. Quaternary International, 444, 76–86. doi:10.1016/j.quaint.2016.12.041
- WaterAid-India, 2005. Drinking water and sanitation status in India (coverage, financing and emerging concerns). Available from: www.wateraidindia.in [Accessed 22 Jun 2020].
- Wilby, R.L. and Dawson, C.W., 2013. The statistical downscaling model: insights from one decade of application. International Journal of Climatology, 33 (7), 1707–1719. doi:10.1002/joc.3544
- Yates, D., et al., 2005. WEAP21—A demand-, priority-, and preference-driven water planning model. Water International, 30 (4), 501–512. doi:10.1080/02508060508691894
- You, Q., et al., 2008. Changes in daily climate extremes in the eastern and central Tibetan Plateau during 1961–2005. Journal of Geophysical Research, 113, D07101. doi:10.1029/2007jd009389