
 ?Mathematical formulae have been encoded as MathML and are displayed in this HTML version using MathJax in order to improve their display. Uncheck the box to turn MathJax off. This feature requires Javascript. Click on a formula to zoom.
ABSTRACT
Accurately quantifying transpiration (T) in apple orchards and its proportion of precipitation (P) is important for comprehending hydrological and ecological processes. A field experiment was conducted during the growing seasons (May to September) of 2013–2016 on the Loess Plateau of China to investigate the characteristics of T in apple (Malus domestica, cv. Fuji) orchards of different ages at multiple temporal scales. The results indicated that tree age clearly influenced T for the young (8-year-old) and old (18-year-old) apple orchards. Transpiration was consistently higher in the old than the young orchard at the same time scales (p < 0.05). At the monthly scale, T was not significantly correlated with leaf area index (LAI) or soil relative extractable water (REW) for either orchard. Average ratios of T to P for the four years were 37.7% and 50.2% for the young and old orchards, respectively. These results identified that trees age should be considered when evaluating T and sustainably developing revegetation activities on the Loess Plateau and in other similar regions.
Editor A. Fiori Associate Editor D. Penna
Introduction
Land use has been transformed on a large scale throughout China over the last 20 years, particularly on the Loess Plateau (Wang et al. Citation2019). The scale and participation level among these land conversions of the Grain for Green project, where marginal cropland was usually converted to forest, grassland or shrubland, strongly supported the state to protect the ecological environment (Deng et al. Citation2014). Forests were mostly planted on the Loess Plateau in this project, to conserve soil and water (Peng and Li Citation2018). Many economic trees, such as apple trees, were also planted in comprehensive consideration of farmer livelihood and socioeconomic factors. Planting apple trees can also effectively reduce soil erosion, but transpiration (T) is always stronger in apple trees than traditional crops, because apple trees could consume more soil water than croplands and soil drying has been raised (Jia et al. Citation2019).
The Loess Plateau is one of the two best areas for the cultivation of apples in China due to its abundant sunlight, good ventilation and large diurnal difference in temperature (Wang and Wang Citation2017). Governmental strategies have continued to expand the cultivation of apple trees in recent years, so the plateau has large areas of apple orchards with different ages. Apple trees on the plateau are typical rainfed vegetation due to the unique geographical location and environmental factors (Zhao et al. Citation2018). The consumption of water resources in this region is mainly from evapotranspiration (ET) (Zhang et al. Citation2001, Wang et al. Citation2009), much of which is contributed by T in apple orchards (Gong et al. Citation2007, Liu et al. Citation2012, Wang and Wang Citation2017). Comprehensively analysing T in apple orchards with different ages and quantifying the proportion of T in total precipitation (P) after converting cropland to forests are therefore necessary.
Transpiration is the movement of water in plants that is subsequently lost as water vapour through foliar stomata (Rothfuss et al. Citation2010). Most of the water used in plant production is obtained through T, such as apple trees (Wu et al. Citation2021). Transpiration is also the key to the water balance of stands and the water yields from forested catchments (Fang et al. Citation2016). Soil water storage, atmospheric evaporation demand, and other ecosystem parameters are affected by T (Oren and Pataki Citation2001) and, vice versa, the T is controlled by physiological factors such as leaf area index, and environmental factors, such as solar radiation, air temperature, and soil water availability (Wu et al. Citation2021). Sap flow (SF) is the flux of water across a given cross-section of trunk within a given period and is an important indicator of the variety of plant T (Liu et al. Citation2012). Daily cumulative SF in trees can be essentially equal to total T for periods of one day or longer (Čermák et al. Citation1995). Measurement of SF is one of the most extensive methods for T researching (Čermák et al. Citation1995, Green et al. Citation1997, Nicolas et al. Citation2005, Kumagai et al. Citation2007, Forrester et al. Citation2010, Cammalleri et al. Citation2013, Jiao et al. Citation2016). Nevertheless, there are still some insufficiencies in the characteristics studying of the T. First, some studies have mainly focused on hourly sap flow velocity (Js) for trees of a specific age without further calculating T, especially in Loess Plateau (Li et al. Citation2008, Chirino et al. Citation2011, Chang et al. Citation2014, Chen et al. Citation2014). The second is that the length of T monitoring is not enough, mostly in a short time period (Nicolas et al. Citation2005, Kumagai et al. Citation2007, Jiao et al. Citation2016). For example, Wu et al. (Citation2021) measured the SF changes of Malus pumila of only one age using thermal dissipation probes (TDP) and calculated the T during one growing season in a semi-arid region. Furthermore, stand age plays an important role in the heterogeneity of stand T (Phillips et al. Citation2002). But some studies only considered the T dynamics of one age under different growth stages (Liu et al. Citation2012) and among different study years (Gong et al. Citation2007). Few studies have explored the influence of tree age on the T dynamics at multiple temporal scales over many years. Our knowledge of the characteristic of T for different ages comparison is limited. Illustrating the T dynamics of apple orchards with different ages is thus clearly needed. The specific objectives of the study were to: (1) quantify and compare T of different aged apple orchards at multiple temporal scales; (2) analyse meteorological factors, leaf area index (LAI) and soil relative extractable water (REW), the main variables contributing to T, and (3) determine ratios of T to precipitation (P) for the orchards at an annual scale. Our results will contribute to the understanding of the basic rules of water movement in apple orchards of different ages under similar water-limited areas and provide a scientific reference for managing soil and water resource and formulating appropriate strategies for apple orchard of land use strategy.
Material and methods
Study site
A field experiment was conducted from May to September in 2013, 2014, 2015 and 2016 at the Changwu Agro-ecological Experimental Station (35.1°N, 107.4°E; 1219.0 m a.s.l.) in the Wangdonggou watershed on the southern Loess Plateau, Shaanxi Province, northwestern China (). The watershed is flat with a deep unsaturated soil layer and is one of the main topographical ecological units on the plateau. This area has a subhumid climate with a mean annual reference ET (ET0) of 1016.0 mm. Precipitation is unevenly distributed throughout the year, with an average of 584.0 mm.
Figure 1. Location of the 8- and 18-year-old apple orchards in the Wangdonggou watershed on the Loess Plateau of China
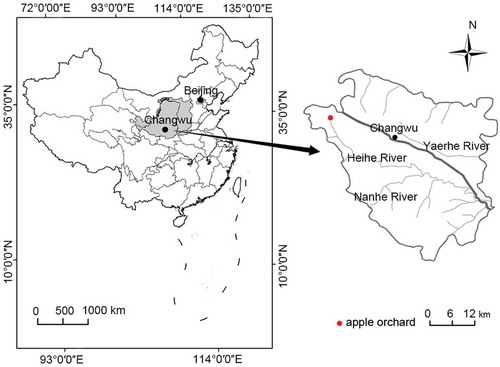
Most of the apple trees (Malus domestica, cv. Fuji) in this region were planted in 1996 and 2006 because of local governmental strategies. The ages of the trees in 2013 were thus mainly 8 and 18 years. Two nearby orchards were selected, an 8-year-old (young) and an 18-year-old (old), which were assumed to have the same meteorological conditions. The orchards were oriented east-west and were 70.0 m long and 16.0 m wide. Tree and row spacing were 3.5 and 4.0 m, respectively, for a density of 720 trees ha−1. These two orchards were rainfed and managed by farmers following local traditional practices. The soil of the two orchards was a dark loess, with a volumetric field capacity and wilting point of 30.7% (cm3 cm−3) and 10.3% (cm3 cm−3), respectively. Precipitation is the only source of water in the area, because the groundwater is deep (50.0–80.0 m) and surface runoff is negligible due to the flat tableland.
Meteorological data
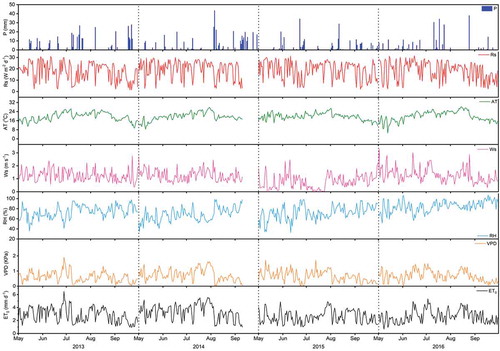
Precipitation was recorded as daily totals using a horizontally positioned tipping-bucket rain gauge. Measurements of solar radiation (Rs), air temperature (AT), relative humidity (RH) and wind speed (Ws) were recorded every 10 min by national meteorological stations at the Changwu experimental station 300.0 m from the orchards. Vapour pressure deficit (VPD) was used to comprehensively represent the synergistic effects of AT and RH. Reference evapotranspiration was calculated from daily meteorological data for 2013, 2014, 2015 and 2016. Climatic variables were daily maximum and minimum temperature at a height of 2 m, atmospheric pressure, sunshine duration, maximum and minimum relative humidity and wind speed at a height of 10.0 m were also provided by the Changwu Experimental Station maintained by the Chinese Meteorological Administration (http://www. cma.gov.cn). Data for wind speed obtained at a height of 10.0 m were converted to speeds for the standard height of 2.0 m using a logarithmic wind-speed profile and conversion factor (Allen et al. Citation1998). Penman-Monteith formula recommended by the Food and Agricultural Organization was used to calculate daily ET0 (mm d−1) (Penman Citation1948, Monteith Citation1981, Allen et al. Citation1998). The variation of daily ET0, Rs, AT, RH, Ws and VPD in 2013, 2014, 2015 and 2016 are shown in .
Figure 2. Variation of precipitation (P), solar radiation (Rs), air temperature (AT), wind speed (Ws), relative humidity (RH), vapour pressure deficit (VPD) and daily reference evapotranspiration (ET0) in 2013, 2014, 2015 and 2016
Transpiration
Eight trees were selected in each orchard for calculating T between May and September for each year. The TDP (Granier Citation1985, Citation1987) method was used to measure Js. One to three trees were selected for these measurements to represent trees in four classes of diameter at a height of 0.8 m. The frequency distributions in the two orchards are shown in .
Table 1. Numbers of sample trees and frequencies of trees in four diameter classes in the 8- and 18-year-old orchards
The Granier system, installations and data collection have been described in more details by Wang and Wang (Citation2017). Standard uncalibrated Js was calculated using the equation developed by Granier (Citation1987) and validated by Clearwater et al. (Citation1999):
where Js is in mm s−1, ∆T is the difference in temperature between the heated and unheated thermocouples and ∆Tmax is the difference in temperature at zero SF. The stand Js for each orchard was calculated from the average mean velocities for the trees representing each diameter class, with frequency-weighting. Stomata are closed under nighttime evaporative demand, and Js can be assumed to be zero or minimal during this period (Dawson et al. Citation2007), so zero-flow measurements were automatically recorded every seven days between 02:00 and 05:00 standard local time.
The sap flow velocity measured for the selected trees was divided by sapwood area for calculating SF (Zhao et al. Citation2009). The sapwood areas of the trees were determined by cutting neighbouring trees to avoid injuring the sampled trees and discriminating between the sapwood and the heartwood based on colour differences. The sapwood area was considered to be constant during the experimental period. A regression equation was established between sapwood area and tree diameter (both of these were measured in 2013), thereby allowing the sapwood area of the sampled trees to be calculated from their diameters (Peng et al. Citation2014):
where is the diameter at a height of 0.8 m (cm),
is the sapwood area (cm2), R2 = 0.98.
Stand T (mm d−1) was extrapolated from the measurements of SF for individual trees (Kumagai et al. Citation2007)
where is the average velocity of trees in diameter class
(mm s−1),
is the total cross-sectional area of the sapwood of trees in diameter class
(cm2), n is the number of diameter classes in the orchard,
is the area of the orchard (m2) and
is a conversion coefficient equal to 8.64 m2 s cm−2 d−1.
Coefficient of variation () was calculated as:
where is in %,
is standard deviation of samples,
is average value of samples.
Leaf area index and soil relative extractable water
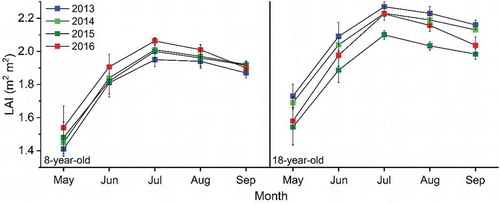
Six plots were randomly established to measure LAI in the orchards from May to September 2013–2016 using a LAI-2200C plant canopy analyser (Li-Cor Inc., Lincoln, USA). Four below-canopy and one above-canopy layer were measured, which was repeated once on clear days to correct for light scattering to reduce the uncertainty of collecting LAI data under direct sunlight. Leaf area index was measured a total of 12 times each month for a selection of six trees, the measurement time is the middle and end of the month, and the averages were used as the monthly average LAI for each orchard ().
Figure 3. Variation of monthly leaf area index (LAI) of the 8- and 18-year-old apple orchards in 2013, 2014, 2015 and 2016
Soil was collected using a soil auger (5 cm in diameter) for measuring soil water content (SWC) at the middle and end of each month from May to September 2013–2016. Soil water content was measured at intervals of 10 cm to a depth of 100 cm and at intervals of 20 cm from 100 to 600 cm. The measurements were appropriately delayed for one or two days after a rain. The temporal variations of REW at 0–600 cm for 2013–2016 are shown in . REW was calculated as (Bréda et al. Citation2006):
Figure 4. Relative extractable water (REW) at 0–600 cm in the 8-year-old and 18-year-old apple orchards in 2013, 2014, 2015 and 2016. The dot line indicates the threshold of soil water deficits
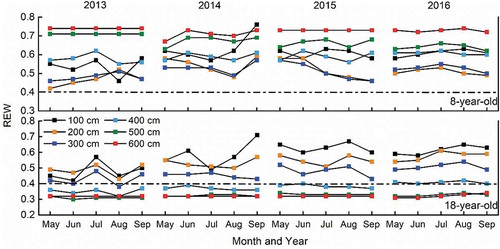
where is the actual amount of extractable soil water, and
is the difference in SWC between the field capacity and the minimum water content (usually the permanent wilting point). An REW of 0.4 was considered to be the threshold of soil water deficits during the study period (Granier Citation1987, Chirino et al. Citation2011).
Data analysis
The sap flow velocity for both orchards could not be obtained from 11 September to 30 September in 2014 due to equipment failure. The stand daily Js for both orchards was the sum of hourly Js in a day. The stand monthly and annual T for both orchards were the sums of daily and monthly T, respectively. The least significant difference test at α = 0.05 was used for identifying differences in daily mean T between the young and old orchards in 2013, 2014, 2015 and 2016. Pearson correlation analyses were used to determine the relationships among Js with meteorological factors, ET0 at daily scale and between T and LAI, REW at monthly scale. Partial correlation analyses were used to test the impact of a factor on Js when other factors were controlled. Multivariate stepwise linear regression was used to further determine the strength of the relationships between daily Js, meteorological factors and ET0 for the young and old trees. Coefficient of variation was used to determine the degree of T, P and T/P variation. The difference of P and T at the monthly scale is the value of P minus T. All statistical analyses were performed using SPSS 24.0 (SPSS 24.0 Inc., Chicago, IL, USA), and the graphs were constructed using OriginPro 2016 (OriginLab Corporation, Northampton, MA, USA) for Windows.
Results
Comparisons transpiration at daily scale
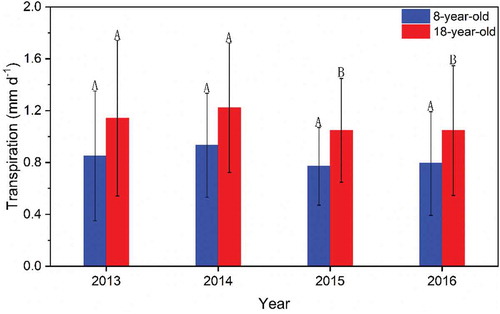
Tree age clearly influenced daily T in both orchards (). Daily T was consistently higher in the old orchard in each year (p < 0.05). The range of daily T was 0.0–2.1, 0.0–1.9, 0.1–1.5 and 0.1–1.8 mm d−1 for the young orchard and 0.0–2.4, 0.1–2.2, 0.2–2.0 and 0.3–2.2 mm d−1 for the old orchard in 2013, 2014, 2015 and 2016, respectively. Daily T was highest on the same day for both orchards in each year, on 7 July 2013, 8 May 2014, 28 July 2015 and 3 July 2016, respectively. The day that daily T for the same tree age was highest differed among the four years. Daily mean T for the young and old orchards was 0.9 and 1.1, 0.9 and 1.2, 0.8 and 1.1 and 0.8 and 1.1 mm d−1 in 2013, 2014, 2015 and 2016, respectively, with four-year averages of 0.8 and 1.1 mm d−1, respectively (). Daily mean T between the orchards did not differ significantly in 2013 or 2014 (p > 0.05) but differed significantly in 2015 and 2016 (p < 0.05). Daily T for both orchards had no consistent trend in each year.
Figure 5. Daily transpiration in the 8- and 18-year-old apple orchards and differences (18 years minus 8 years) between the two orchards in 2013, 2014, 2015 and 2016
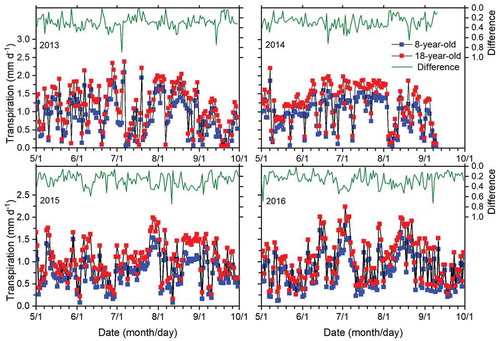
Figure 6. Daily mean transpiration in the 8- and 18-year-old apple orchards in 2013, 2014, 2015 and 2016. The same capital letters indicate no significant difference according to the least significant difference (LSD0.05) test. The error bars indicate the coefficient of variation of daily mean transpiration in each year
The daily variation of T was mainly caused by the daily variation of Js (EquationEquation (3)(3)
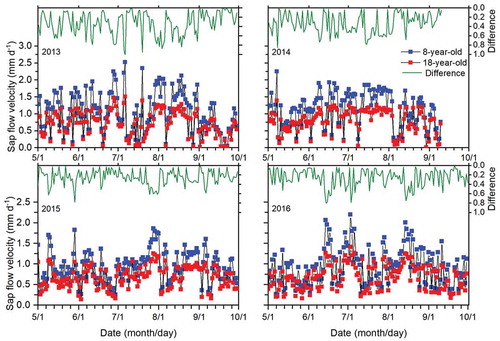
(3) ). Tree age clearly influenced Js of the trees, and daily Js was consistently higher for the younger trees (p < 0.05), in contrast to the diurnal dynamic regularity of T in the two orchards (). The range of daily Js was 0.0–2.5, 0.1–2.3, 0.2–1.9 and 0.3–2.2 mm d−1 for the young trees and 0.0–1.5, 0.0–1.4, 0.1–1.3 and 0.2–1.4 mm d−1 for the old trees in 2013, 2014, 2015 and 2016, respectively. Daily Js for the young and old trees was correlated with the meteorological factors and ET0, and the correlation coefficients between daily Js and each environmental factor differed between the two trees ages (). Js for the young and old trees was correlated positively with ET0, Rs, AT, Ws and VPD but negatively with RH. The Pearson correlation coefficient was higher between Js and ET0 than between Js and the other factors. The correlation coefficient was significantly higher for the younger orchard (p < 0.01). The partial correlation analysis indicated that Js for the young orchard was significantly correlated with ET0 (p < 0.01) in each year and for the average of the four-year period. Js for the old orchard was significantly correlated with ET0 in 2013, 2015, 2016 and the four-year period (p < 0.01).
Table 2. Pearson correlation and partial correlation coefficients between daily sap flow velocity, meteorological factors and ET0 for the 8- and 18-year-old apple orchards for 2013, 2014, 2015 and 2016
Figure 7. Daily sap flow velocity of the 8- and 18-year-old apple orchards and differences (8 years minus 18 years) between the two orchards in 2013, 2014, 2015 and 2016
Further analysis led to a linear regression model for daily Js, meteorological factors and ET0 for both orchards. Multivariate regression models differed between the young and old trees in each year, even for the same tree age, and among the four years (). Daily Js for the young and old trees in 2013 and 2014 was determined by ET0, Rs and AT. Daily Js in 2015 was mainly influenced by ET0 for the young trees and by ET0 and Rs for the old trees. Daily Js in 2016 was mainly influenced by ET0, VPD and Ws for the young trees and by ET0 for the old trees. Daily Js for both ages were consistently determined by the same factor, ET0, each year.
Table 3. Multivariate regression models for daily sap flow velocity in the 8- and 18-year-old apple orchards during the growing season of 2013–2016
Relationships between transpiration, leaf area index or soil relative extractable water at the monthly scale
Total T at the monthly scale was consistently higher for the older orchard (p < 0.05). Monthly total T was similar for both orchards, at 14.1–35.6 and 21.8–45.3, 5.2–39.0 and 7.5–49.5, 18.0–28.7 and 25.8–37.8 and 18.9–31.0 and 25.2–40.7 mm in 2013, 2014, 2015 and 2016, respectively (). The variation of monthly T for the young and old orchards was highest in July 2013, September 2014, June 2015 and July 2016, with CV of 76.1 and 62.2, 78.5 and 70.0, 52.2 and 47.4, and 52.5 and 49.5%, respectively.
Table 4. Characteristics of monthly transpiration for the 8- and 18-year-old apple orchards in 2013, 2014, 2015 and 2016
Monthly mean LAI for the young and old orchards varied between 1.4 and 2.1 m2 m−2 and between 1.5 and 2.3 m2 m−2, respectively. Leaf area index increased rapidly in May and peaked in July in each year. Leaf area index for the young orchard increased in the same month each year, which fluctuated increase between years. LAI for the old orchard decreased from 2013 to 2015 year by year but rebounded slightly in 2016, maintaining a low LAI, the average AT in 2016 may have been higher in the beginning of trees branching leaves, and the longer sunshine duration during the growth of leaves compared to the previous three years could account for the phenomenon. Monthly mean T was not well correlated with monthly mean LAI in either the young (T = 0.0562LAI+0.9733, R2 = 0.0011, p = 0.432) or old (T = 0.3009LAI+1.3568, R2 = 0.0346, p = 0.496) orchard on monthly scale during 2013–2016.
REW varied from 0.4 to 0.8 for the young orchard and from 0.3 to 0.7 for the old orchard. Soil water deficits did not occur in the young orchard but mainly occurred in the 400–600 cm layer in the old orchard during 2013–2016. The monthly dynamic regularity of T was similar for both orchards. Transpiration was not significantly correlated with REW in either the young (T = 0.5767exp(0.0224REW), R2 = 0.0142, p = 0.889) or the old (T = 0.77exp(−0.172REW), R2 = 0.0378, p = 0.418) orchard at the monthly scale during 2013–2016.
Comparison of transpiration and precipitation
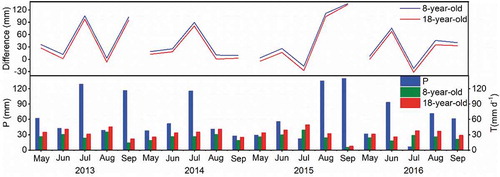
The difference of monthly P and T for the young and old orchards varied from 2.8 to 105.6 and −6.9 to 97.5 mm in 2013, from −17.0 to 135.2 and −27.5 to 132.9 mm in 2014, from −22.5 to 75.6 and −31.6 to 67.8 mm in 2015 and from 8.9 to 89.7 and 0.4 to 80.8 mm in 2016, respectively (). Monthly total P met monthly T for both orchards in 2016, but monthly total T exceeded monthly P in August 2013 and May 2014 for the old orchard and in July 2014 and July 2015 for both orchards.
Figure 8. Monthly total precipitation (P), transpiration (T) and differences (P minus T) for the 8- and 18-year-old apple orchards in 2013, 2014, 2015 and 2016
Annual P was 388.7, 383.3, 264.6 and 271.0 mm from May to September in 2013, 2014, 2015 and 2016, respectively, with a CV of 20.6% for the four years. Annual T was consistently higher for the older orchard (p < 0.05). Annual T was 130.3, 124.0, 118.0 and 121.4 mm for the young orchard and 174.6, 162.5, 160.3 and 160.1 mm for the old orchard in 2013, 2014, 2015 and 2016, respectively. Annual mean T for the young and old orchards for the four years was 123.4 and 164.4 mm, with CV of 4.2 and 4.2%, respectively (). Precipitation met T at the annual scale for both orchards in each year (). The ratio of transpiration to precipitation at the annual scale was consistently higher for the older orchard (p < 0.05), and T/P for the same tree age differed among the four years. The ratio of transpiration to precipitation for the four years ranged from 32.4 to 44.6% for the young orchard and from 42.4 to 60.6% for the old orchard ().
Table 5. Annual precipitation, transpiration and the ratio of transpiration to precipitation for the 8- and 18-year-old apple orchards in 2013, 2014, 2015 and 2016
Discussion
Characteristics of transpiration for trees with different ages
Many studies of T have been conducted using TDP method, some measurement errors using this method have been reported (Chen et al. Citation2014, Tie et al. Citation2017, Rana et al. Citation2019, Tian et al. Citation2019), but which can serve to indicate differences. The TDP method determines zero SF before dawn (Granier Citation1987), but nighttime T can occur under favourable climatic conditions (Dawson et al. Citation2007). T for both orchards in our study may therefore be underestimated due to the limitation of this method (Steppe et al. Citation2010).
Transpiration was consistently higher for the older orchard at daily, monthly and annual scale (p < 0.05). Other studies have reported similar findings. For example, Jiao et al. (Citation2016) found that T was higher in a 28-year-old than a 12-year-old stand of black locust on the Loess Plateau at a daily scale (p < 0.001). Röll et al. (Citation2015) reported that T for the oil palm was very low in a 2-year-old stand and increased with stand age. Dunn and Connor (Citation1993), however, found that T for mountain ash (Eucalyptus regnans) in southeastern Australia decreased as tree age increased, from 50 to 90 to 150 to 230 years. This finding was inconsistent with our results, perhaps due to a change in the area of the sapwood of the trees, which had a large impact on T. The areas of sapwood for the old and young apple trees in our study varied only slightly during the four years. Except for the sapwood area, Js also strongly influenced T. Zimmermann et al. (Citation2000) reported that changes in Js in Siberian pines of different ages affected T along a time series. Daily Js was used to analyse the effect of tree age on T. The sap flow velocity in our study differed between the trees with different ages, daily Js was higher in the young than the old orchard. Forrester et al. (Citation2010) also reported that Js also differed between 2- and 8-year-old Eucalyptus globulus trees in southeastern Australia. Previous studies have noted that there are widespread radial variations in Js of different tree species, indicating that Js of the same tree species was affected by the measured orientation (Green and Clothier Citation1988, Cohen et al. Citation2007). Delzon et al. (Citation2004) reported that ignoring the radial variation of Js in pine could affect the measurement of T. Moreover, older xylems are also more prone to embolism (Sperry et al. Citation1991). Resistance to embolism has been correlated with wood density (Lachenbruch and McCulloh Citation2014), which differs with tree age (Dunham et al. Citation2008). Embolism can reduce the hydraulic conductivity of the xylem under water stress, slowing the rate at which plants transport water from roots to leaves (Sperry and Tyree Citation1988). The soil water condition in this study was better in the young orchard where there was no soil water deficit than old orchard where soil water deficits occurred below 400 cm in four years. Under the influence of water deficit, xylem embolism may thus have differed between the young and old trees, which would affect Js.
Several previous studies had indicated that Js depends strongly on meteorological factors (Chang et al. Citation2014, Zhang et al. Citation2016, Tian et al. Citation2019). Peng et al. (Citation2014) found that Js of Salix matsudana on the Loess Plateau was significantly positively correlated with ET0, Rs, VPD, AT, RH and Ws (p < 0.05), and Zhang et al. (Citation2016) noted that Rs, RH and AT influenced Js of apple trees on the southern Loess Plateau. We found that Js of the apple trees of different ages was positively correlated with ET0, Rs, AT, Ws and VPD (p < 0.05), similar to the results of other studies (Chang et al. Citation2014, Peng et al. Citation2014, Méndez-Toribio et al. Citation2016, Zhang et al. Citation2016). The multiple regression equations indicated ET0 was more critical than Rs, AT, Ws and VPD. Dang et al. (Citation2019) noted that Js of apple trees could be better modelled based on daily ET0. Tognetti et al. (Citation2004) found that Js for olive trees was more strongly correlated with ET0 than with any single meteorological factor. Overall, ET0 was generally the key environmental factor controlling Js in our study. Jiao et al. (Citation2016) indicated that black locust trees of different ages had different physiological activity on the semiarid Loess Plateau. The correlation between Js and ET0 in our study was higher for the younger orchard (p < 0.01), perhaps because trees of different ages are differentially physiological active in response to the same meteorological factors. The integrated impact of the meteorological factors may thus have driven the responses to Js at the whole-tree level (O’Brien et al. Citation2004). Improving the accuracy of ET0 measurements as much as possible is thus critical for calculating Js.
Responses of transpiration to leaf area index and soil relative extractable water at the monthly scale
Interactions of meteorological factors with the phenological status of plants and with the availability of water are important for regulating T (Zhao et al. Citation2009). Water vapour is exchanged at the surfaces of leaves, namely the majority of T (most transpiration water is lost through foliar stomata) (Rogiers et al. Citation2011). Some studies have indicated that the relationship between T and LAI varies as LAI increases (Liu et al. Citation2012, Otieno et al. Citation2017). Tie et al. (Citation2017), however, reported that the control of T by meteorological and physiological factors was seasonally transformed. Changes in LAI greater than 1.0 m2 m−2 did not significantly affect T in Korean aspen (Populus davidiana). Liu et al. (Citation2012) found that LAI of apple trees in an arid region in northwestern China increased to 1.7 m2 m−2 when leaves and trunks grew rapidly and then stabilized. Minimum LAI since early May for the young and old orchards in our study was 1.4 and 1.5 m2 m−2, respectively, which was relatively high. The amount of foliage is mostly responsible for T in temperate deciduous forests (Oren and Pataki Citation2001). Even if LAI increased further, canopy T would not increase substantially because of the limitation of foliar surfaces to capture energy (Tie et al. Citation2017). Leaf area index in our study was no longer a limiting factor for the variation of T at the monthly scale. Our results also indicated that Js and ET0 were significantly positively correlated in the discussion of previous section, so the effect of LAI on T was less obvious compared to the effect of meteorological factors on T. These two findings may account for the lack of a correlation between LAI and T. These results were consistent with the results of other studies conducted on perennial deciduous plants (Gong et al. Citation2007, Liu et al. Citation2012, Xu et al. Citation2017).
Soil relative extractable water in rainfed areas is one aspect that helps us to understand the variation in T (Tian et al. Citation2019). Plants lose a lot of water through stomata by T, which is compensated by absorbing water from the soil (Huber et al. Citation2014). Gaines et al. (Citation2016) indicated that trees tended to absorb water from shallow soil layers (less than 60 cm), regardless of species and soil texture. Previous studies found that more than 60.0% of fine roots in apple orchards were in the 0–200 cm layer, and root density at each depth increased with stand age (Parker and Van Lear Citation1996, Song et al. Citation2018). The root depth of apple trees increases with tree age, and the water stored in deep soil layers also contributes available water to the plants (Li et al. Citation2019a). The difference in planting time between the young and old orchards in our study was 10 years, so the older trees had deeper and denser roots in each soil layer (Song et al. Citation2018). The change of SWC in the young and old orchards in our study were closely related to associated with the roots under the same climatic conditions, which absorbed water to supplement the consumption of water by T (Li et al. Citation2019a). The older trees also had thicker trunks at a height of 0.8 m, so more water was needed to ensure normal physiological activity (Li et al. Citation2019b). Old trees need to absorb more water through the roots than young trees, leading to soil water stress in the 400–600 cm layer. But T of tree for most forests was only inhibited when subjected to a severe soil water deficit (Ford et al. Citation2005). Transpiration and REW in our study were not correlated of for either orchard, suggesting that T may not have been limited by soil water, because adequate water can be supplied by P during experimental periods (Tie et al. Citation2017).
Ratio of transpiration to precipitation for trees with different ages
Mean annual P in study area is 584.0 mm, approximately 55.0–78.0% of which falls between June and September (Jia et al. Citation2019). The loessial layer of soil is deep (Suo et al. Citation2019) and the land is flat, so surface runoff is minimal. The maximum infiltration of P in rainy years in grassland in this area is 300 cm, which cannot direct supplement the soil water of deeper layers (Chen et al. Citation2008). Evapotranspiration is the main component of hydrological processes in subhumid ecosystems (Wu et al. Citation2021), and annual P nearly completely consumed by ET, with only some stored as soil water (Zhang et al. Citation2016). P and ET consequently differed little during our experimental period.
The ratio of transpiration to evapotranspiration (T/ET) represents the percentage of water vapour flux allocated by physical and biological processes (Hu et al. Citation2008). The ratio of transpiration to evapotranspiration is fundamental and important but has been studied in only a few places, and the results have been quite inconsistent (Huxman et al. Citation2005). Previous study showed that T of apple trees was most intense in summer, and T/ET averaged 87.0% in a subhumid region adjacent to the southern Loess Plateau (Gong et al. Citation2007). The ratio of transpiration to evapotranspiration ranged from 50.0 to 80.0% for both Hippophae rhamnoides and Caragana intermedia in the loessial areas of northwestern China (Guo et al. Citation2010) and from 25.0 to 89.0% for Nitraria on the western Loess Plateau (Qiu et al. Citation2015). The ratio of transpiration to evapotranspiration averages 64.0 ± 13.0% globally (Good et al. Citation2015) and 61% for broadleaved forests (Wei et al. Citation2017). The ratio of transpiration to precipitation was used to analyse the ratio of water consumed by T to P on an annual scale in our study. Precipitation and ET were similar in the study area, so T/P could be approximated as T/ET. The ratio of transpiration to precipitation in our study and T/ET in the above studies notably differed at the regional scale. The interactions among plant morphology and environmental conditions such as weather, SWC may account for part of the difference between studies, in addition to the underestimation of Js using TDP method (Wei et al. Citation2017). The difference between T/P in our study and global T/ET was smaller for the older orchard, suggesting that T for the old orchard at this age was more representative of the average T in this region. The ratio of transpiration to precipitation for apple trees of different ages under the same meteorological conditions, though, have, to the best of our knowledge, been rarely reported. Our study accurately determined the proportion of P consumed by T for apple trees of different ages in this rainfed area. The old orchard used more water resources under the same meteorological condition compared to young orchard. The average yield per acre was also lower for the older orchard based on the actual yields of the two orchards during the experimental period. From the perspective of water-resource use, the age range of the apple trees in this area should be appropriately shortened.
Conclusions and implications
Quantifying T of different aged apple orchards will definitely benefit a better understanding of ecohydrological processes. This study comprehensively analysed the T characteristics of two typical ages for apple orchard for four consecutive years in the Loess Plateau at different timescales. By analysing T for apple orchards of different ages (8- and 18-year-old) in 2013–2016, it showed that tree age clearly influenced the characteristics of T. Transpiration of the 18-year-old apple orchard was higher than 8-year-old apple orchard at daily, monthly and annual scales, respectively. The change of T was reflected by the daily Js, the relative size of Js for 8-year-old apple orchard was higher than 18-year-old apple orchard. ET0 always played a decisive role in daily Js of the different aged apple orchard. The variation of LAI did not affect T for either orchard and REW was not the limitation factor on T for either orchard at the monthly scale. Through the comparison of T/P at annual scale, the T for 18-year-old apple orchard may be more representative of the average T than 8-year-old apple orchard for this region. Our accurate results about T on a daily, monthly and annual basis provide useful parameters and data, which fills up the gap of continuous years research on T of different aged trees. The comparison of T and T/P of different aged apple orchard is pivotal to better understand the soil-water cycle research and also to improve the management of regional land.
Transpiration is constrained by atmospheric conditions and physiological conditions of trees (Tie et al. Citation2017). More vegetation characteristics, such as the root system of trees and physiological indicators representing the dynamics of tree growth and phenology need to be obtained to comprehensively analyse T, which is also the limitations of the presented study. In the future, further mechanistic studies are needed to clarify the extent of tree age affecting T and determine the specific physiological indicator affected by age of tree. Our results also showed that the amount of water consumed by T of apple trees was related to the tree age. Furthermore, revegetation has already reached its sustainable water resources limit on the Loess Plateau (Huang and Shao Citation2019). Therefore, adding more age series of apple trees for comparison may obtain more meaningful results, which is crucial for determining the change of regional water yield and finding the balance between economic development and ecosystem environment.
Acknowledgements
We acknowledge Chinese Ecosystem Research Network-Changwu Agro-ecological Experimental Station.
Disclosure statement
No potential conflict of interest was reported by the author(s).
Additional information
Funding
References
- Allen, R.G., et al., 1998. Crop evapotranspiration. Guidelines for computing crop water requirements. Rome: FAO, FAO Irrigation and Drainage, Paper no. 56.
- Bréda, N., et al., 2006. Temperate forest trees and stands under severe drought: a review of ecophysiological responses, adaptation processes and long-term consequences. Annals of Forest Science, 63 (6), 625–644. doi:10.1051/forest:2006042.
- Cammalleri, C., et al., 2013. Combined use of eddy covariance and sap flow techniques for partition of ET fluxes and water stress assessment in an irrigated olive orchard. Agricultural Water Management, 120, 89–97. doi:10.1016/j.agwat.2012.10.003.
- Čermák, J., et al., 1995. Individual variation of sap-flow rate in large pine and spruce trees and stand transpiration: a pilot study at the central NOPEX site. Journal of Hydrology, 168, 17–27. doi:10.1016/0022-1694(94)02657-W.
- Chang, X.X., Zhao, W.Z., and He, Z.B., 2014. Radial pattern of sap flow and response to microclimate and soil moisture in Qinghai spruce (Picea crassifolia) in the upper Heihe River Basin of arid northwestern China. Agricultural & Forest Meteorology, 187, 14–21. doi:10.1016/j.agrformet.2013.11.004.
- Chen, D.Y., et al., 2014. Response of relative sap flow to meteorological factors under different soil moisture conditions in rainfed jujube (Ziziphus jujuba Mill.) plantations in semiarid Northwest China. Agricultural Water Management, 136, 23–33. doi:10.1016/j.agwat.2014.01.001.
- Chen, H.S., Shao, M.A., and Li, Y.Y., 2008. The characteristics of soil water cycle and water balance on steep grassland under natural and simulated rainfall conditions in the Loess Plateau of China. Journal of Hydrology, 360, 242–251. doi:10.1016/j.jhydrol.2008.07.037.
- Chirino, E., Bellot, J., and Sánchez, J.R., 2011. Daily sap flow rate as an indicator of drought avoidance mechanisms in five Mediterranean perennial species in semi-arid southeastern Spain. Trees, 25 (4), 593–606. doi:10.1007/s00468-010-0536-4.
- Clearwater, M.J., et al., 1999. Potential errors in measurement of nonuniform sap flow using heat dissipation probes. Tree Physiology, 19, 681–687. doi:10.1093/treephys/19.10.681.
- Cohen, Y., et al., 2007. Variations in the radial gradient of sap velocity in trunks of forest and fruit trees. Plant and Soil, 305 (1–2), 49–59. doi:10.1007/s11104-007-9351-0.
- Dang, H.Z., et al., 2019. Response of sap flow rate of apple trees to environmental factors in Loess Plateau of western Shanxi Province, China. Chinese Journal of Applied Ecology, 30 (3), 823–831. doi:10.13287/j.1001-9332.201903.015.
- Dawson, T.E., et al., 2007. Nighttime transpiration in woody plants from contrasting ecosystems. Tree Physiology, 27, 561–575. doi:10.1093/treephys/27.4.561.
- Delzon, S., et al., 2004. Radial profiles of sap flow with increasing tree size in maritime pine. Tree Physiology, 24, 1285–1293. doi:10.1093/treephys/24.11.1285.
- Deng, L., Liu, G.B., and Shangguan, Z.P., 2014. Land-use conversion and changing soil carbon stocks in China’s ‘Grain-for-Green’ program: a synthesis. Global Change Biology, 20 (11), 3544–3556. doi:10.1111/gcb.12508.
- Dunham, S.M., et al., 2008. Partitioning variation in Douglas-fir xylem properties among multiple scales via a Bayesian hierarchical model. Tree Physiology, 28, 1017–1024. doi:10.1093/treephys/28.7.1017.
- Dunn, G.M. and Connor, D.J., 1993. An analysis of sap flow in mountain ash (Eucalyptus regnans) forests of different age. Tree Physiology, 13 (4), 321–336. doi:10.1093/treephys/13.4.321.
- Fang, S.M., Zhao, C.Y., and Jian, S.Q., 2016. Canopy transpiration of Pinus tabulaeformis plantation forest in the Loess Plateau region of China. Environmental Earth Sciences, 75, 376. doi:10.1007/s12665-016-5291-4.
- Ford, C.R., et al., 2005. Modeling canopy transpiration using time series analysis: a case study illustrating the effect of soil moisture deficit on Pinus taeda. Agricultural & Forest Meteorology, 130, 163–175. doi:10.1016/j.agrformet.2005.03.004.
- Forrester, D.I., Collopy, J.J., and Morris, J.D., 2010. Transpiration along an age series of Eucalyptus globulus plantations in southeastern Australia. Forest Ecology & Management, 259, 1754–1760. doi:10.1016/j.foreco.2009.04.023.
- Gaines, K.P., et al., 2016. Reliance on shallow soil water in a mixed-hardwood forest in central Pennsylvania. Tree Physiology, 36 (4), 444–458. doi:10.1093/treephys/tpv113.
- Gong, D.Z., et al., 2007. Estimation of evapotranspiration and its components from an apple orchard in northwest China using sap flow and water balance methods. Hydrological Processes, 21 (7), 931–938. doi:10.1002/hyp.6284.
- Good, S.P., Noone, D., and Bowen, G., 2015. Hydrologic connectivity constrains partitioning of global terrestrial water fluxes. Science, 349 (6244), 175–177. doi:10.1126/science.aaa5931.
- Granier, A., 1985. A new method of sap flow measurement in tree stems. Annals of Forest Science, 42 (2), 193–200. doi:10.1051/forest:19850204.
- Granier, A., 1987. Evaluation of transpiration in a Douglas-fir stand by means of sap flow measurements. Tree Physiology, 3, 309–320. doi:10.1093/treephys/3.4.309.
- Green, S.R. and Clothier, B.E., 1988. Water use of kiwifruit vines and apple trees by the heat-pulse technique. Journal of Experimental Botany, 39 (198), 115–123. doi:10.1093/jxb/39.1.115.
- Green, S.R., Clothier, B.E., and McLeod, D.J., 1997. The response of sap flow in apple roots to localised irrigation. Agricultural Water Management, 33, 63–78. doi:10.1016/S0378-3774(96)01277-2.
- Guo, W.H., et al., 2010. Effects of water stress on water use efficiency and water balance components of Hippophae rhamnoides and Caragana intermedia in the soil–plant–atmosphere continuum. Agroforestry Systems, 80 (3), 423–435. doi:10.1007/s10457-010-9337-4.
- Hu, Z.M., et al., 2008. Effects of vegetation control on ecosystem water use efficiency within and among four grassland ecosystems in China. Global Change Biology,14 (7), 1609–1619. doi:10.1111/j.1365-2486.2008.01582.x
- Huang, L.M. and Shao, M.A., 2019. Advances and perspectives on soil water research in China’s Loess Plateau. Earth-Science Reviews, 199, 102962. doi:10.1016/j.earscirev.2019.102962.
- Huber, K., et al., 2014. Modelling the impact of heterogeneous rootzone water distribution on the regulation of transpiration by hormone transport and/or hydraulic pressures. Plant and Soil, 384 (1–2), 93–112. doi:10.1007/s11104-014-2188-4.
- Huxman, T.E., et al., 2005. Ecohydrological implications of woody plant encroachment. Ecology, 86 (2), 308–319. doi:10.1890/03-0583.
- Jia, X.X., et al., 2019. Spatial variations in soil-water carrying capacity of three typical revegetation species on the Loess Plateau, China. Agriculture Ecosystems & Environment, 273, 25–35. doi:10.1016/j.agee.2018.12.008.
- Jiao, L., et al., 2016. Comparison of transpiration between different aged black locust (Robinia pseudoacacia) trees on the semi-arid Loess Plateau, China. Journal of Arid Land, 8 (4), 604–617. doi:10.1007/s40333-016-0047-2.
- Kumagai, T., et al., 2007. Sap flow estimates of stand transpiration at two slope positions in a Japanese cedar forest watershed. Tree Physiology, 27, 161–168. doi:10.1093/treephys/27.2.161.
- Lachenbruch, B. and McCulloh, K.A., 2014. Traits, properties, and performance: how woody plants combine hydraulic and mechanical functions in a cell, tissue, or whole plant. New Phytologist, 204 (4), 747–764. doi:10.1111/nph.13035.
- Li, H., et al., 2019a. Deep soil water extraction by apple sequesters organic carbon via root biomass rather than altering soil organic carbon content. Science of the Total Environment, 670, 662–671. doi:10.1016/j.scitotenv.2019.03.267.
- Li, H.B., et al., 2008. Research on sap flow velocity of red Fuji apple trees by heat pulse probe method. Acta Agriculturae Boreali-Occidentalis Sinica, 5, 244–247.
- Li, H.J., et al., 2019b. Water mining from the deep critical zone by apple treesgrowing on loess. Hydrological Processes, 33, 320–327. doi:10.1002/hyp.13346.
- Liu, C.W., et al., 2012. Trunk sap flow characteristics during two growth stages of apple tree and its relationships with affecting factors in an arid region of northwest China. Agricultural Water Management, 104, 193–202. doi:10.1016/j.agwat.2011.12.014.
- Méndez-Toribio, M., et al., 2016. Effects of slope aspect and topographic position on environmental variables, disturbance regime and tree community attributes in a seasonal tropical dry forest. Journal of Vegetation Science, 27 (6), 1094–1103. doi:10.1111/jvs.12455.
- Monteith, J.L., 1981. Evaporation and surface temperature. Quarterly Journal of the Royal Meteorological Society, 107, 1–27. doi:10.1002/qj.49710745102.
- Nicolas, E., et al., 2005. Evaluation of transpiration in adult apricot trees from sap flow measurements. Agricultural Water Management, 72 (2), 131–145. doi:10.1016/j.agwat.2004.09.008.
- O’Brien, J.J., Oberbauer, S.F., and Clark, D.B., 2004. Whole tree xylem sap flow responses to multiple environmental variables in a wet tropical forest. Plant Cell Environment, 27, 551–567. doi:10.1111/j.1365-3040.2003.01160.x.
- Oren, R. and Pataki, D.E., 2001. Transpiration in response to variation in microclimate and soil moisture in southeastern deciduous forests. Oecologia, 127 (4), 549–559. doi:10.1007/s004420000622.
- Otieno, D., et al., 2017. Spatial heterogeneity in stand characteristics alters water use patterns of mountain forests. Agricultural & Forest Meteorology, 236, 78–86. doi:10.1016/j.agrformet.2017.01.007.
- Parker, M.M. and Van Lear, D.H., 1996. Soil heterogeneity and root distribution of mature loblolly pine stands in piedmont soils. Soil Science Society of America Journal, 60, 1920–1925. doi:10.2136/sssaj1996.03615995006000060043x.
- Peng, S.Z. and Li, Z., 2018. Incorporation of potential natural vegetation into revegetation programmes for sustainable land management. Land Degradation & Developmen, 29, 3503–3511. doi:10.1002/ldr.3124.
- Peng, X.P., et al., 2014. Discrepancy of sap flow in Salix matsudana grown under different soil textures in the water-wind erosion crisscross region on the Loess Plateau. Plant and Soil, 390 (1–2), 383–399. doi:10.1007/s11104-014-2333-0.
- Penman, H.L., 1948. Natural evaporation from open water, hare soil and grass. Proceedings of the Royal Society of London, 193 (1032), 120–145. doi:10.1098/rspa.1948.0037.
- Phillips, N., et al., 2002. Canopy and hydraulic conductance in young, mature and old Douglas-fir trees. Tree Physiology, 22, 205–211. doi:10.1093/treephys/22.2-3.205.
- Qiu, G.Y., Li, C., and Yan, C.H., 2015. Characteristics of soil evaporation, plant transpiration and water budget of Nitraria dune in the arid Northwest China. Agricultural & Forest Meteorology, 203, 107–117. doi:10.1016/j.agrformet.2015.01.006.
- Rana, G., et al., 2019. Field scale recalibration of the sap flow thermal dissipation method in a Mediterranean vineyard. Agricultural & Forest Meteorology, 269–270, 169–179. doi:10.1016/j.agrformet.2019.02.018.
- Rogiers, S.Y., et al., 2011. Stomatal response of an anisohydric grapevine cultivar to evaporative demand, available soil moisture and abscisic acid. Tree Physiology, 32 (3), 249–261. doi:10.1093/treephys/tpr131.
- Röll, A., et al., 2015. Transpiration in an oil palm landscape: effects of palm age. Biogeosciences, 12, 5619–5633. doi:10.5194/bg-12-5619-2015.
- Rothfuss, Y., et al., 2010. Partitioning evapotranspiration fluxes into soil evaporation and plant transpiration using water stable isotopes under controlled conditions. Hydrological Process, 24 (22), 3177–3194. doi:10.1002/hyp.7743.
- Song, X.L., et al., 2018. Soil water and root distribution of apple tree (Malus pumila Mill) stands in relation to stand age and rainwater collection and infiltration system (RWCI) in a hilly region of the Loess Plateau, China. Catena, 170, 324–334. doi:10.1016/j.catena.2018.06.026.
- Sperry, J.S., Perry, A.H., and Sullivan, J.E.M., 1991. Pit membrane degradation and air-embolism formation in ageing xylem vessels of populus tremuloides michx. Journal of Experimental Botany, 42 (244), 1399–1406. doi:10.1093/jxb/42.11.1399.
- Sperry, J.S. and Tyree, M.T., 1988. Mechanism of water stress-induced xylem embolism. Plant Physiology, 88, 581–587. doi:10.1104/pp.88.3.581.
- Steppe, K., et al., 2010. A comparison of sap flux density using thermal dissipation, heat pulse velocity and heat field deformation methods. Agricultural & Forest Meteorology, 150 (7–8), 1046–1056. doi:10.1016/j.agrformet.2010.04.004.
- Suo, G.D., et al., 2019. Long-term effects of different surface mulching techniques on soil water and fruit yield in an apple orchard on the Loess Plateau of China. Scientia Hortic-Amsterdam, 246, 643–651. doi:10.1016/j.scienta.2018.11.028.
- Tian, A., et al., 2019. Partitioning the causes of spatiotemporal variation in the sunny day sap flux density of a larch plantation on a hillslope in northwest China. Journal of Hydrology, 571, 503–515. doi:10.1016/j.jhydrol.2019.02.004.
- Tie, Q., et al., 2017. Environmental and physiological controls on sap flow in a subhumid mountainous catchment in North China. Agricultural & Forest Meteorology, 240–241, 46–57. doi:10.1016/j.agrformet.2017.03.018.
- Tognetti, R., et al., 2004. Irrigation effects on daily and seasonal variations of trunk sap flow and leaf water relations in olive trees. Plant and Soil, 263, 249–264. doi:10.1023/B:PLSO.0000047738.96931.91.
- Wang, D. and Wang, L., 2017. Dynamics of evapotranspiration partitioning for apple trees of different ages in a semiarid region of northwest China. Agricultural Water Management, 191, 1–15. doi:10.1016/j.agwat.2017.05.010.
- Wang, S., et al., 2019. Discrepancy in tree transpiration of Salix matsudana, Populus simonii under distinct soil, topography conditions in an ecological rehabilitation area on the Northern Loess Plateau. Forest Ecology & Management, 432, 675–685. doi:10.1016/j.foreco.2018.10.011.
- Wang, X.P., et al., 2009. Water balance change for a re-vegetated xerophyte shrub area/Changement du bilan hydrique d’une zone replantée d’arbustes xérophiles. Hydrological Sciences Journal, 49, 283–295.
- Wang, Y.H., et al., 2017. The spatiotemporal variation of tree cover in the Loess Plateau of China after the ‘Grain for Green’ project. Sustainability, 9 (5), 739–753. doi:10.3390/su9050739.
- Wei, Z.W., et al., 2017. Revisiting the contribution of transpiration to global terrestrial evapotranspiration. Geophysical Research Letters, 44, 2792–2801. doi:10.1002/2016GL072235.
- Wu, W.J., et al., 2021. Precipitation dominates the transpiration of both the economic forest (Malus pumila) and ecological forest (Robinia pseudoacacia) on the Loess Plateau after about 15 years of water depletion in deep soil. Agricultural and Forest Meteorology, 297, 108244. doi:10.1016/j.agrformet.2020.108244.
- Xu, X.Y., et al., 2017. Sap flow of irrigated Populus alba var. pyramidalis and its relationship with environmental factors and leaf area index in an arid region of Northwest China. Journal of Forest Research, 16 (2), 144–152. doi:10.1007/s10310-010-0220-y.
- Zhang, J., et al., 2016. The relationship between sap flow velocity and environmental factors of the 19a apple trees on the Loess Plateau at different time scales. Scientia Agricultura Sinica, 49 (13), 2583–2592.
- Zhang, L., Dawes, W.R., and Walker, G.R., 2001. Response of mean annual evapotranspiration to vegetation changes at catchment scale. Water Resources Research, 37 (3), 701–708. doi:10.1029/2000WR900325.
- Zhao, J., et al., 2018. Soil moisture response to rainfall on the Chinese Loess Plateau after a long-term vegetation rehabilitation. Hydrological Process, 32 (12), 1738–1754. doi:10.1002/hyp.13143.
- Zhao, W., Chang, X., and Zhang, Z., 2009. Transpiration of a Linze jujube orchard in an arid region of China. Hydrological Process, 23 (10), 1461–1470. doi:10.1002/hyp.7272.
- Zimmermann, R., et al., 2000. Canopy transpiration in a chronosequence of Central Siberian pine forests. Global Change Biology, 6, 25–37. doi:10.1046/j.1365-2486.2000.00289.x.