
 ?Mathematical formulae have been encoded as MathML and are displayed in this HTML version using MathJax in order to improve their display. Uncheck the box to turn MathJax off. This feature requires Javascript. Click on a formula to zoom.
ABSTRACT
Socio-hydrology has recently garnered attention as a promising research paradigm among hydrologists. In this paper, we argue that viewing the socio-hydrological systems as a network of causal factors can assist in these efforts by revealing emergent properties of socio-hydrological systems. These factors, which are neither actors nor affiliations but symbolic representations of miscellaneous phenomena, represent the key variables affecting socio-hydrological system behaviour. Despite being crucial for understanding system dynamics, these factors are not captured by most equations of coupled human–water coevolutionary models. To demonstrate our method, we use qualitative case study research to analyse the Jaguaribe Basin in Ceará State-Brazil as a network of factors, i.e. mental conceptions, and representations of water resource management experts. We show that most results are unsurprising, exhibiting expected causal relationships. However, there was at least one unexpected result, which showed that the variable “conflict” was the single most sensitive variable to systemic evolution.
Editor S. Archfield Associate editor S. Pande
1 Introduction
Socio-hydrology has gained considerable attention in recent literature (Holländer et al. Citation2009, Sivapalan et al. Citation2012, Citation2014, Sivapalan and Blöschl Citation2015, Srinivasan et al. Citation2017, Melsen et al. Citation2018, Mostert Citation2018, Ross and Chang Citation2020) with its focus on the coevolution of coupled human–water systems. Socio-hydrological models are focused on understanding patterns, feedbacks, and emergent phenomena (Sivapalan et al. Citation2012, Sivapalan and Blöschl Citation2015) and, in certain cases, may rely on quantitative methods to make long-term predictions of future system behaviour. However, there is much debate regarding the possibility of accurately predicting the long-term behaviour of complex socioenvironmental systems or at least regarding the degree to which these predictions are accurate enough to ensure the model’s validity.
Holländer et al. (Citation2009), for example, present evidence suggesting that models constructed to make a priori prediction of catchment discharge are not only ineffective but are also biased by modeler presuppositions. Melsen et al. (Citation2018) also argue that socio-hydrological models are not “value-free” but inherently contested as part of a political competition for “agenda setting”. In their own words, “when models explaining socio-natural water behaviour are seen as ‘real’ … their assumptions and conventions are hidden” (Melsen et al. Citation2018, p. 1438). Recent work by Ghoreishi et al. (Citation2020) and by Wei et al. (Citation2021) has drawn attention to the fact that conflict for water resources is a fundamental feature of complex human–water systems. We believe that conflict should be made more prominent and explicit in socio-hydrological models.
An alternative approach that could be complementary to coupled models of human–water systems is case study research (Mostert Citation2018), which seeks to identify key factors affecting actor decision-making and activities. The point of case study research would be to “zoom in on those factors that have the most explanatory power in the specific case” (Mostert Citation2018, p. 319). Socio-hydrological systems can be better mapped as a set of causal human–water interrelationships if viewed as a socioecological network of interrelationships between factors (i.e. variables), where the most influential drive long-term system behaviour.
In this paper we present a method for analysing case study data, which visualizes coupled human–water systems as a network of factors. Unlike most models describing human–water systems at the macro-level of analysis, our approach unravels the underlying network that makes up the socio-hydrological system, which allows an identification of the key factors affecting decisions and actions of agents of the catchment under study. Specifically, we analyse the Jaguaribe Basin located in the State of Ceará, Northeast Brazil, where the research team collected the data for mapping the network of relationships.
Water management becomes complex due to each region’s different socioeconomic and environmental realities, mainly with the possibility of generating conflicts between donor and recipient basins (Azevedo et al. Citation2005). This conflict can still be aggravated due to the region suffering from water scarcity.
Therefore, we characterized the Jaguaribe Metropolitano System as a socio-hydrological system and questioned whether the interrelationships between factors could help decision-makers in public actions and policies mainly concerning drought. Therefore, the work intends to capture, from the perspective of COGERH specialists, the factors that are determinant in the evolution of the system and, through the networks’ analysis, to discover which of these factors are the most relevant.
We also made two hypotheses: Do the Bottom-up method allow us to identify the system’s emerging characteristics and visualize the relevant variables? Can the socio-natural system be visualized as a network of interconnections?
This paper is organized as follows. Section 2 presents the theoretical framework for analyzing the basin and section 3 describes the methodology used to map the network of factors. Our results are presented in section 4 and we close with a conclusion/discussion in section 5.
2 Site description
The Jaguaribe-Metropolitano System is located in the State of Ceará and is the main reservoir system in that State. A highly variable annual flow characterizes it due to climatic variability and high evaporation rates (Silva et al. Citation2017).
It comprises the Metropolitan Region of Fortaleza (RMF) and the Jaguaribe River basin, which is divided into five sub-basins, namely: Alto Jaguaribe, Banabuiú, Médio Jaguaribe, Salgado and Baixo Jaguaribe.
The Metropolitan Region of Fortaleza is home to the most crucial water-consuming center in the State of Ceará and has a population of 4,074,730 inhabitants, which is the largest metropolitan region in the Northeast (IBGE Citation2018). Its demand consists of human supply, industry, services, and tourism.
The Jaguaribe River basin has an area of 72 thousand km2, which corresponds to approximately 48% of the State and 1,562,716 inhabitants. Irrigation represents about 90% of water users in this basin (Silva et al. Citation2017, ANA Citation2019).
Two instruments of water transfer Canal do Trabalhador and the Eixão das Águas compose the Jaguaribe-Metropolitano system. They try to solve the water deficit and expand the supply matrix of the RMF.
Thus, eight reservoirs carried out the surface supply of the RMF, in which five of them are in the RMF (Gavião, Pacoti, Riachão, Pacajus, and Aracoiaba), with an accumulation capacity of 871 hm3, and three in the Jaguaribe basin (Orós, Castanho, and Banabuiú), 10,241 hm3 (Silva et al. Citation2019).
3 Theoretical framework
Our theoretical framework (Schwartz Citation2000, Grumbach and Marcial Citation2008, Godet and Durance Citation2011, Scott Citation2017) combines strategic prospective techniques with social network analysis (SNA) to frame socio-hydrology as a network of causal interrelationships between factors of a coupled human–water system. In this sense, it mixes the quantitative and qualitative aspects of socio-hydrology in a single unified framework.
Strategic prospective became part of the planning of many organizations to reduce the uncertainties of the future, as some authors describe (Porter Citation1989, Godet and Durance Citation2011, Oliveira et al. Citation2018). It is a technique widely applied in several fields. The prospective strategy associated with the structural matrix method to identify factors of great importance was applied in Abdoli et al. (Citation2018) to draw up a development plan for Bushehr, Iran.
Creating scenarios is also part of strategic prospective and was applied by Golfam et al. (Citation2019) using multi-criteria decision making (MCDM) methods to determine the best scenario adapting to climate change in agriculture for the Gharanghu basin in Northwest Iran for a 30-year period. Also, Surahman et al. (Citation2018) have employed the strategic perspective and the construction of scenarios to identify the most influential and dependent variables in an Indonesian agricultural production system, to allow the short-term agricultural use of degraded peatlands in a relatively sustainable way.
The study contributes to strategic prospective because it considers the anticipation, performs analysis, and evaluates the options associated with identifying variables that impact scenario building. This results in working proactively, preparing for the expected changes. For our study, strategic prospective was used to identify variables, and gave us an idea of how the variables can be structured. It gives us a sense of the causal relationships between them.
Social Network Analysis represents one of the best-developed sociological methods for studying social relations because it focuses on the relationship between actors and the implications of these relations. Thus, using this technique, it was possible to identify metrics that provide an actor and network-level description of the network, graphical visualization of the network, and community detection (Prell and Bodin Citation2011, Kim and Hastak Citation2018). This methodology’s advantage is that it can capture, model, simulate and analyse the complex relationship between various nodes (Yang Citation2014). SNA has been implemented in various water resources studies that give insights into the management process, helping stakeholders decide (Chaffin et al. Citation2016, Ogada et al. Citation2017, Krupa et al. Citation2018, Ahmadi et al. Citation2020).
The SNA enabled the identification of the network’s systems and subsystems and the characterization of the network applying the metrics’ analysis. Our methodology consists of a mixed methods research focused on a qualitative and quantitative analysis of factors that structure a socio-hydrological network and shapes its evolution in time. Recognizing the need to understand both social and environmental aspects of water resource planning and management, we focus on anthropic side of coupled systems, by extracting those factors that are central to the workings of the entire socio-hydrological network.
4 Methodology
We used qualitative and quantitative methods to construct a social network from the analysis of statistical data collected during research (). Mapping the human–water network of the Jaguaribe Basin followed the natural data collection sequence starting with literature survey followed by interviews with relevant specialists. Once the data was analysed, a workshop was set up by the research team to ensure that all relevant variables necessary to describe the system were accounted for.
Figure 1. Flowchart with methodology steps
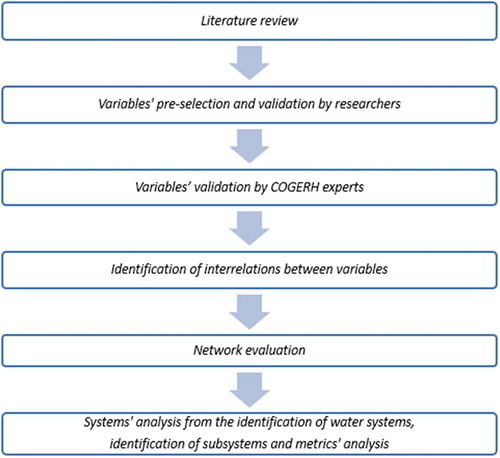
We relied extensively on the work of do Nascimento et al. (Citation2010) to identify the set of universal variables found in most Brazilian socio-hydrological systems. It is a comprehensive compilation of the most relevant variables needed to adequately model most of Brazil’s socio-hydrological systems and comprises not only Brazil’s 2006 National Plan for Water Resources but also the set of regional and national workshops conducted across the country to select those variables.
The set of variables contemplated in do Nascimento et al. (Citation2010) were evaluated by university researchers in order to select those adhering to the dynamics of the study area. After this selection, a workshop was set up with water management experts to further scrutinize the selected variables. Water management experts were asked separately to rank variables on a structural matrix that indexes their degrees of influence on a scale of 0 (no influence) to 3 (strong influence). These individual matrices were compiled into a single “median matrix” representing a composite degree of influence of any given variable on the network. From the median matrix, all variables were organized on a chart by degree of influence and dependence.
With the degree of influence measured and ranked for every variable, a process of selecting factors that either exhibited high influence and low dependence (i.e. determinant variables) or that exhibited high influence and high dependence (i.e. relay variables) to other variables in the human–water network. Once these factors were selected, graph theory algorithms programmed on R software’s igraph package (Csardi and Nepusz Citation2006) was used to establish causal relationships between them. System characteristics were extracted from graph structure/architecture, whereas network characteristics emerged from graph metrics. In each of the following subsections, we provide a more detailed description of research steps and procedures.
4.1 Surveying the variables
As a first step, the research team conducted a literature review to identify and select crucial variables characterizing water resources systems in Brazil. The most comprehensive of these studies was conducted by do Nascimento et al. (Citation2010) in a survey that identified 59 “universal” variables pertaining to all 12 hydrographic regions established on Brazil’s National Water Agency (ANA) 2006 Water Resource Plan.
Our study focused on the Jaguaribe Basin, which is the most important hydrological catchment area of the Brazilian state of Ceará and one of Brazil’s 12 hydrographic regions, and additional bibliographic research (with archival materials generously provided both by Ceará’s state government and its water resources management company) was needed to check which variables had been surveyed and identified in previous studies describing socio-hydrological systems of the region. Of the 59 variables (do Nascimento et al. Citation2010) submitted to leading researchers at Universidade Federal do Ceará’s (UFC) Hydrology Department (DEHA), 47 were confirmed as being important components of the Jaguaribe Basin network.
A third phase of research was realized at Ceará state’s Water Resources Management Company (COGERH) to ensure that the 47 selected variables accurately described the network structure of Jaguaribe Basin. COGERH holds Ceará’s leading water policymaking, water policy implementation, and water use regulation community with experience from decades of water management and planning services. The research team used social science qualitative methods, distributing questionnaires and conducting structured interviews with senior and junior water resource experts, technicians, and managers of COGERH.
A two-day workshop was organized to help experts fill-out structural matrices (Godet and Durance Citation2011) designed by the research team (see Appendix A, ). After a detailed explanation on how each variable was defined and classified by university researchers, participants were asked to fill-out a structural matrix individually. Specifically, they were asked to decide whether there was a direct relation between variables and then to rank how much each column item influenced its respective line item for each pair of variables.
Each separate structural matrix ranked every variable from most influential to most system-dependent and was subsequently compiled into single median matrix representing the entire network of factor relationships of the Jaguaribe socio-hydrological system. It was this “median matrix” which was used to construct the influence-dependence chart, which shows the interrelationships between variables within the network. The goal of this tool was to capture in a standardized way how network variables related to one another according to a common definition. The structural matrices allowed the research team to determine the degree of influence each factor had on the socio-hydrological network.
4.2 Defining variable typology
To classify each variable in a typology of factors capable of influencing network behaviour, the research team compiled the filled-out structural matrices into a single median structural matrix. The median matrix attributed weights to every single factor influencing (or being influenced by) the socio-hydrological network. Using an index from 0 to 3, where zero was categorized as having “no influence” and three categorized as having “strong influence” (Godet and Durance Citation2011, p. 99), the experts ranked each of the 47 variables. The research team used the R software (Kolaczyk and Csárdi Citation2014) to construct the influence-dependence chart (), which distributed the variables into four categories according to the dimensions of dependence (represented on the x-axis) and influence (represented on the y-axis). The Influence x Dependence values of each variable are in Appendix A, .
Figure 2. Influence-dependence chart with 47 variables. Source: Author
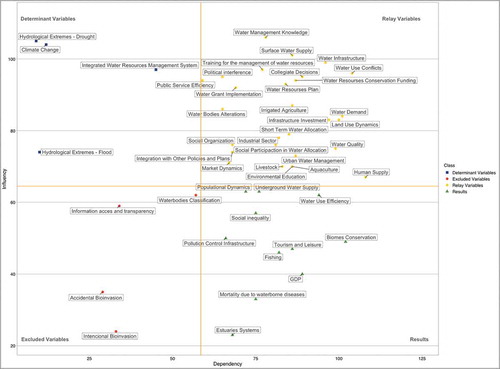
We categorized the variables by quadrant according to the following typology of the median structural matrix (): Type-1 relay variables (quadrant I) are both highly influential and highly dependent on the behaviour of other variables and, thus, increase or decrease instability in the system work by amplifying or diffusing shocks; Type-2 influence or determinant variables (quadrant II) are the explanatory variables which condition (and perhaps drive) events that impact future system configurations. They are highly influential but minimally dependent on other variables of the network; Type-3 excluded variables (quadrant III) are neither influential nor dependent on other variables of the network, representing trends or factors that have developed autonomously given their tenuous connections to the system; and Type-4 dependent or result variables (quadrant IV) are highly impacted by system behaviour but exert minimal influence on other variables, being the variables most closely related to the emergent properties of the system.
It was possible to simplify the resulting graph given that we were interested only in the strong-influence variables. Thus, the matrix of 47 elements was reduced to a matrix containing the 32 relevant variables (i.e. quadrant I and II). These factors could then be classified as being either “hubs” or “authorities” according to the degree or number of connections flowing in or out. The factors with a higher number of “degree-in” than “degree-out” are called “authorities”, whereas the factors with a higher number of “degree-out” than “degree-in” are called “hubs”.
A similar method was explored by Ogada et al. (Citation2017), who used influence/interest plot and network diagram to analyse stakeholders’ social and structural characteristics in Lake Naivasha basin, Kenya. In this paper, however, socio-hydrological variables were determined in advance. It is important to highlight that these hubs and authorities are the ones that essentially determine the system’s “social preferential flow” (Sivapalan and Blöschl Citation2015, p. 7001), and will be discussed in detail in the fourth section, where the results of graph interrelationships are presented.
4.3 Elaboration of the graph interrelations
The influence-dependence chart is ideal to study the properties of the Jaguaribe Basin because it allows the socio-hydrological system to be visualized as a network of subsystems, providing considerable insight into the cross-scale structure of the socio-hydrological system. It fulfills two key requisites of qualitative case study research, e.g. public participation (of water management experts) and the inclusion of the most influential variables and processes (Mostert Citation2018, p. 318), to complement coupled human–water system models.
To complement the qualitative analysis provided by the median structural matrix, we graphed the relationships between the 32 factors that structure Ceará’s water resource network. Graphing the interrelationships between all factors to their pairwise connections allowed the research team to represent the “microstates” of the system, making the chart a planning tool water researchers and managers can use to define short- and long-term strategies even in uncertain environments (Sousa Citation2013).
However, to visualize the causal relationship between factors and analyse network metrics, we constructed an adjacency matrix from the data represented by the median structural matrix. We followed Scott (Citation2017, p. 59–63) to build a directed graph that represents the network of interrelationships that make up Ceará’s socio-hydrological network system. Using R software’s igraph algorithms (Kolaczyk and Csárdi Citation2014), we showed which 32 factors had the most influence on network dynamics, what the causal relationship between them was, and obtained several metrics necessary to describe the structure of Ceará’s water resource network and analyse its evolution.
In the network graph, variables will be represented by nodes (i.e. vertices), whereas the connection and interrelationship between nodes are called links (i.e. edges). Links have a causal property associated with regard to variable influence and/or dependency on other variables. On the one hand, this means that factors are always directed and, on the other hand, that one can assess the importance of any given node relative to any other within the network of interrelationships.
Graphically, links appear as arrows showing the causal direction from one variable to the next. An arrow pointing from variable A to variable B establishes a relationship between the two variables that can be read either as “A influences B” or as “B is dependent on A”. If connections are reciprocal, then the link establishes a mutual relationship between variables, which are then classified as “relay” variables. Once these basic relationships are established, it is possible to define the social network metrics of the Jaguaribe socio-hydrological system.
4.4 Defining SNA metrics using igraph
To evaluate the components of the socio-hydrological network system, we used graph theory to define the following metrics: diameter, reciprocity, transitivity, centrality, density and centralization. The diameter of the graph corresponds to the largest geodesic distance of the graph, that is, the longest path between the vertices. Reciprocity shows which variables have mutual links in directed graphs, whereas transitivity measures the probability that adjacent vertices are connected, providing a clustering coefficient in a local region of the network or as a measure of global agglomeration. Centrality measures the importance and power of a vertex in a graph. When a given vertex has a higher number of links compared to others, it can be said that it is central in the network. There are four centrality measures widely used in network analysis: degree centrality, betweenness centrality, closeness centrality, and eigenvector centrality.
In mathematical terms, the degree centrality ki of a vertex i is expressed by EquationEquation (1)(1)
(1) :
where is the number of incident edges,
are elements of the adjacency matrix (is a matrix when the edges are adjacent
is 1 and when is not adjacent i and j are zero) and n the number of vertices.
The higher the value of centrality or proximity the more any one factor is close to any other. Thus, centrality emphasizes the independence of the factors in the sense that each one factor of the network does not depend on intermediaries to reach any other. A message originating in the most central position of a network spreads throughout the network in minimal time (Watts and Strogatz Citation1998). Thus, centrality is measured by observing the factors that have the shortest distance concerning other factors. This is the concept of closeness centrality and it can be given by EquationEquation (2)(2)
(2) :
where Cc is the closeness centrality value, n is the number of vertices, is the sum of all distances for all vertices, and d(i, j) is the number of shortest paths connecting vertices i and j.
Betweenness centrality quantifies the number of times a node acts as a bridge along the shortest path between two other nodes. Thus, the closer to zero, nothing changes in the network if the node is removed. It can be calculated by EquationEquation (3)(3)
(3) :
Where Cb is the betweenness centrality value of a point pk, we add its partial betweenness values for all unordered pairs of points where i # j # k and n is the number of points in the graph.
The eigenvector centrality is a measure of the influence of a node in a network, in which the higher scores represent higher importance. It is calculated using EquationEquation (4)(4)
(4) :
If we denote the centrality of vertex i by xi, then we can allow for this effect by making xi proportional to the average of the centralities of i’s network neighbors where λ is a constant. Defining the vector of centralities x = (x1, x2, …), we can rewrite this equation in matrix form as and hence we see that x is an eigenvector of the adjacency matrix with eigenvalue λ. The rewrite formula is shown in EquationEquation (5)(5)
(5) :
Finally, the properties that denote the cohesion of the system are density and centering. Density is defined by the ratio between the number of communication links observed in a network and the maximum number of possible links (De Laat et al. Citation2007). Scott (Citation2017) states that in directed graphs the matrix is asymmetric, that is, a line from A to B may not be reciprocal. Thus, the density formula is described in EquationEquation (6)(6)
(6) :
However, degree centralization calculates how much only one factor is monopolizing the ties of the network. According to Freeman (Citation1979), one can calculate the centralization by EquationEquation (7)(7)
(7) :
Where defined the measure of a central point any i and
the largest measure of the network.
4.5 Identification of subsystems
To identify the subsystems of the socio-hydrological system we searched for clusters in the network. Clusters are homogenous groups that share similar features and can, therefore, facilitate the study of the variables. The classification of the network into subsystems was based on greedy optimization of the system’s modularity. Modularity is a property that divides the network into communities (Clauset et al. Citation2004), measuring nontrivial group structures, or how far apart the different vertex types are from each other using a Q parameter, represented in EquationEquation (8)(8)
(8) below, where m is the number of edges, Aij is the element of the A adjacency matrix in row i and column j, ki is the degree of i, kj is the degree of j, ci is the type (or component) of i, cj that of j, the sum goes over all i and j pairs of vertices, and delta(x,y) is 1 if x = y and 0 otherwise.
With these metrics, we were able to identify the properties of each factor affecting the Jaguaribe socio-hydrological system by understanding its network properties. Most results came of no surprise and confirmed what we already knew about the system, but one result related to the importance of the “conflict” factor stimulated a rethinking of how coupled human–water systems could be more accurately analysed.
5 Results
5.1 Identification of relevant variables (i.e. network factors)
Given the variable typology defined in the methodology section, we interpret the coupled human–water system that is the Jaguaribe Basin as a network regulated by 32 central factors (). If we return to , we find that the most influential variable was “water management knowledge” (i.e. influence value 106) and the most dependent variable was “human supply” (i.e. dependence value 107). We also observed that the “surface water supply” (i.e. influence value 99) factor has a stronger influence than the “irrigated agriculture” (i.e. influence value 85) factor, while “infrastructure investment” (96, i.e. dependence value) was more dependent than the “training for the management of water resources” factor (77, i.e. dependence value). It was observed that 59,6% of the variables were relay-type and caused instability to the system, due to its high dependence and influence on the other variables and 8,5% were high-influence and low-dependency variables, they are responsible for the future events.
Figure 3. Influence-dependence chart with 32 variables. Source: Author
The chart () also identified four key variables central water resource implementation plan used by COGERH and government officials: (i) “drought” (i.e. influence value 104 and dependence value 9); (ii) “flood” (i.e. influence value 74 and dependence value 10); (iii) climate change (i.e. influence value 103 and dependence value 12); and (vi) SINGERH, which is Brazil’s Integrated System for Water Resources Management (i.e. influence value 97 and dependence value 45). These were in quadrant II and are the factors with the highest influence and lowest dependence values, being the factors mostly responsible in directing future events in the network and, to some extent, its evolution. Consequently, these variables are the ones that provide greatest support to projected system behaviour in prospective scenarios. On the other hand, the chart suggests an unstable network given that most factors were relay variables. Any action on any one of them would impact and change another variable.
5.2 Evaluation metrics of the water resources system
We further evaluated the interrelationship between factors of the socio-hydrological network system by graphing the metrics described in the methodology section (e.g. diameter, reciprocity, transitivity, centrality, density and centralization), to visualize the central factors influencing the socio-hydrological system.
5.3 Diameter
The two most distant vertices represent the diameter of the network. In the case of the Jaguaribe Basin “market dynamics” and “public sector efficiency” were separated by the largest distances with the longest path between being the three intermediaries, namely: “integration with other policies and plans”, “water grant implementation” and “irrigated agriculture”. The diameter is relatively small since the connection between two variables has at most three intermediaries. Therefore, the system is very interconnected, and the information transfer is fast.
5.4 Reciprocity
The measure of reciprocity is defined by the propensity of mutual connections in a directed graph and ranges from zero, i.e. no feedback between factors, to one, i.e. feedback between all factors. The value for the Jaguaribe Basin was 0.447, which means that there is an intense feedback between factors in the network since nearly half of these are relay variables.
5.5 Transitivity
Transitivity measures the global or local strength of ties. The global clustering coefficient is designed to provide an overview of the clustering in the network and the local clustering coefficient indicates the insertion of individual nodes (see Appendix A, ). In our analysis, we found that the Jaguaribe Basin exhibited a global value of 0.60, expressing a high degree of redundancy between connections in the network.
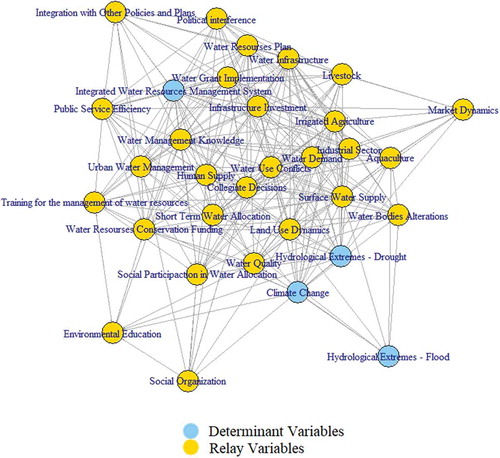
5.6 Degree centrality
The degree centrality was obtained from the structural matrix, with the measure of degree-in obtained from the sum of values in the columns and the measure of degree-out from the sum of the values in the lines. The average degree of the network is 21.25 and is obtained by summing the degrees of all vertices (see the Appendix A, ). We see that “human supply” (i.e. total degree centrality 29) and “water use conflicts” (i.e. total degree centrality 35) are in red (), this happened because they have the highest number of incidental connections, so they have the most considerable number of factors influencing it. For example, “water management knowledge” (i.e. total degree centrality 32), “water use conflicts” and “water infrastructure” (i.e. total degree centrality 34) are the variables with the highest total number of degrees and, therefore, the crucial variables that determine the system. While “integrated water resources management system” (i.e. out degree centrality 20) and “water management knowledge” (i.e. out degree centrality 21) are the most influential because they have the most significant number of connections coming out of them, so a change in these variables can act strongly on the rest of the system. It is necessary to observe that comparisons can only be made between graphs that have the same size because the degree of a point depends very much on the size of the graph.
Figure 4. Number of degrees by variable. Source: Author
The degree distribution also tells us what kind of network the socio-hydrological system is, allowing the research team to assess the strength of factors. In our case, the vertices in the Jaguaribe Basin network exhibited a Poisson distribution suggesting that it is scale-free and, therefore, that the hubs (i.e. influence variables) are “strong” (i.e. work as catalysts).
It was observed that the maximum number of connections is 35 and, within the 30 to 35 connection range, 3 variables were well connected (i.e. “water use conflicts”, “water infrastructure” and “water management knowledge”), meaning they had direct contacts between them. As for eigenvector centrality “water use conflicts” obtained the maximum value of 1.0, appearing as the most crucial variable of the system, followed by “human supply” with a value of 0.97. Also, the betweenness centrality is expressed by the gatekeepers who tend to control the flow of information (Oliveira and Gama Citation2012), this means that “surface water supply”, which has the highest value (i.e. 90.96), is the bridge between two non-adjacent factors, followed by “collegiate decisions” (i.e. 85.09) and “water use conflicts” (i.e. 84.27).
Points with less closeness centrality are considered peripheral points, so they are loosely connected into the network, they are represented by “flood” (i.e. a value of 0.0182), “social organization” (i.e. a value of 0.0181) and “environmental education” (i.e. a value of 0.0180). In other words, none of these three factors was considered important by the technicians and experts who filled-out the matrices.
5.7 Density and centralization
Density is defined by the ratio between the number of communication links observed in a network and the maximum number of possible links (De Laat et al. Citation2007) and is a measure that ranges from 0 to 1, with zero being sparse and one being dense. Calculating the Jaguaribe network’s maximum number of potential connections as a directed graph yielded a total of 496 potential leads, which were multiplied by two since one must account for the edges arriving and leaving in directed graphs, totaling 992 potential leads. The density obtained for the Jaguaribe Network was 0.343, below the 0.5 mark which characterizes a sparse graph.
Centralization is a measure of how much a given factor is “monopolizing” the ties of the network and, like density, its values range from 0 to 1 (zero being that every factor has the same number of loops and one being a single factor having all loops). We found that the value of centralization for the socio-hydrological network was 0.37. Given the eigenvector centrality value of 1.0 for “water use conflicts”, the highest value amongst all factors measured, it dominates 37% of the Jaguaribe Basin network ties.
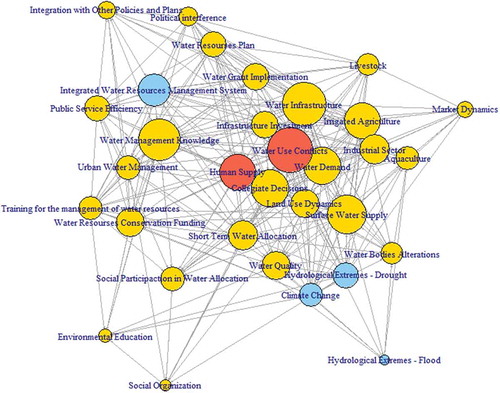
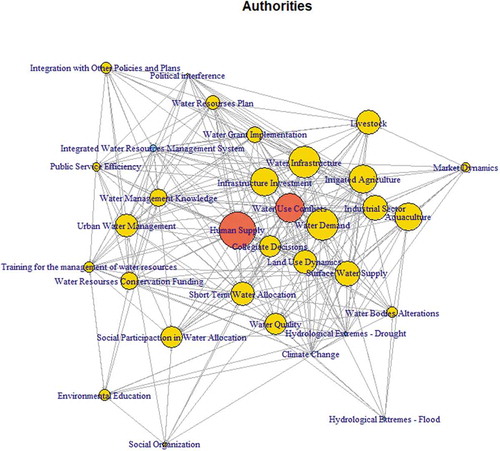
5.8 Hubs and authorities
There are two types of vertices essential for connecting and distributing information throughout the network: hubs and authorities. The hubs and authorities are highly connected central nodes and can be understood as a refinement of input and output degrees. The research team identified the factors that represent the hubs () and authorities () of the Jaguaribe Basin. shows the nodes of various sizes with the largest spheres representing the number of connections. The factors “drought”, “climate change”, and “SINGERH” are the most important hubs, whereas “human supply” and “water use conflicts” the most important authorities.
Figure 5. Proportional strength of hubs. Source: Author
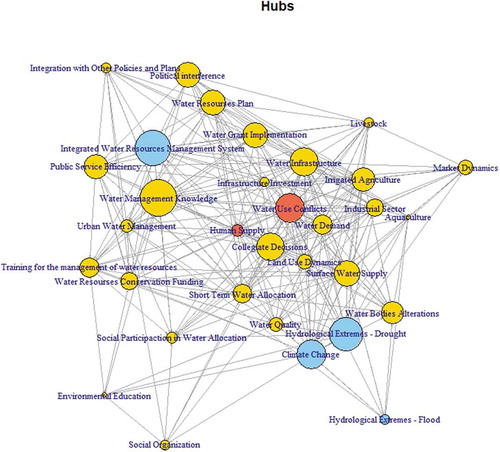
Figure 6. Proportional strength of authorities. Source: Author
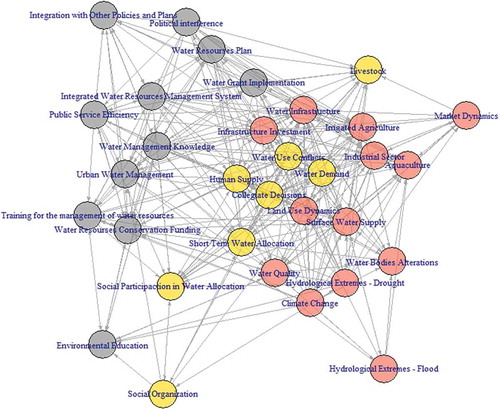
5.9 Identification of subsystems: clusters
The last part of the analysis consists of taking the quantitative metrics to identify qualitative characteristics of the socio-hydrological network. An interesting property of networks is the emergent self-organizing features that arise from the factor interrelationships. Analogous to agents, factors tend to group themselves together by similar characteristics, having different number of connections with different factors. The level of similarity can be measured by counting the number of points connecting two or more vertices, i.e. factors. Thus, they coalesce into subgroups, which exhibit strong relationships with those other factors that are in the same subgroup while “segregating” factors that are part of another subgroup.
Using an igraph algorithm based on the greedy optimization of modularity, we identified clusters that naturally coalesced in the Jaguaribe socio-hydrological system. Our algorithm divided the socio-hydrological system according to the connections between factors. These naturally grouped themselves in three clusters that form the subsystems of the network as shown in .
Figure 7. Quantitative clustering. Source: Author
From the qualitative research it was possible to establish the characteristics of the influential factors of the Jaguaribe Network and, given the connection between factors, it was possible to group all relevant variables into five clusters or network subsystems (). These subsystems were labeled: (1) “economics and water use”; (2) “climate and hydrological regime”; (3) “politics, institutions and social dynamics”; (4) “quantity and quality”; and (5) “internal dynamics of the hydrosystem”.
Figure 8. Qualitative clustering. Source: Author
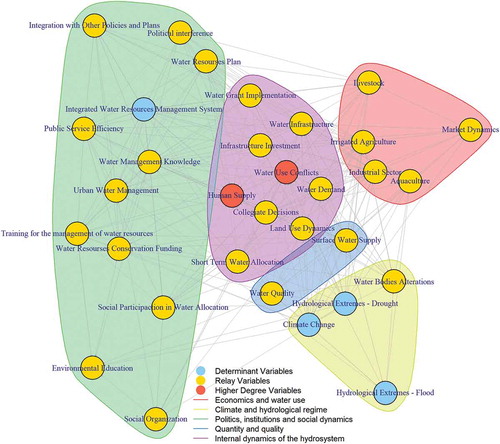
It was observed that 37.5% of the variables are in the subgroup of “Politics, institutions and social dynamics”; 28.12% “Internal dynamics of the hydrosystem”; 15.62% “Economics and water use”; 12.5% “Climate and hydrological regime” and 6.25% “Quantity and Quality”. An interesting but unsurprising result was that the four key factors, which govern the behaviour of the whole system, were located in two subsystems (): “climate and hydrological regime” (i.e. yellow cluster) and “politics, institutions and social dynamics” (i.e. green cluster). These directly impact the “internal dynamics of the hydrosystem” (i.e. purple cluster), a third subsystem that naturally acts as an integrating subsystem since it contains the two variables with the largest connections.
The “climate and hydrological regime” subsystem has three factors indispensable for the operation of the socio-hydrological system – “climate change”, “drought”, and “flood” – since they determine the amount of water availability. It connects to all others, but mainly to the “internal dynamics of the hydrosystem” and “economics and water use”, because climatic events directly impact the economy and create conflicts over multiple uses of water.
Despite having only two factors (i.e. “water quality” and “surface water supply”) the smallest subsystem, “quantity and quality” (i.e. blue cluster), is a cluster that relates to all others. The “water quality” factor has the largest number of connections with the group “politics, institutions and social dynamics”, an unsurprising result since water quality impacts supply costs as most clean water comes from treated sewage water. “Surface water supply” is crucial for the network, with the largest value betweenness centrality of the system (90.96), acting as a bridge, i.e. the shortest path between two other nodes.
The subsystem “economics and water use” (i.e. red cluster) consists of variables related to the various types of water use that directly affect the market dynamics. They are interconnected with each other and with all subgroups, especially with “internal dynamics of the hydrosystem”. The most relevant variable for the subsystem is “irrigated agriculture” because it has more connections, also an unsurprising finding given the relevance of irrigation to agriculture in the state of Ceará.
The next subgroup “internal dynamics of the hydrosystem” is considered the heart of the system because it contains two variables with the highest number of system connections and the highest values of eigenvector centrality and closeness centrality, respectively, 1.0 and 0.025 for “water use conflicts”, and 0.97 and 0.025 for “human supply”.
The largest subgroup “politics, institutions and social dynamics” consists of twelve variables and deals with the development of water policy, water bodies, social participation, environmental education and the financing process of the system. A key variable, the “integrated water resources management system” (SINGERH), is also located here. The factor with the highest number of connections is “water management knowledge” (a degree-all of 32) and “social organization” is the factor with the lowest number of connections (a degree-all of 9). In comparison to other subsystems, the eigenvector centrality values were smaller for this group. However, one factor belonging to this subgroup, “social participation in water allocation”, stands out with an eigenvector centrality of 0.61, which is a crucial node for this subgroup. “Water management knowledge” is also a crucial factor since it exhibited the highest value of betweenness centrality (58.36).
6 Discussion
Key variables of the system, such as “drought”, “climate change”, and the institutional implementation of SINGERH, were those with the highest influence and lowest dependency in the system, and should be the main focus of prospective studies regarding Ceará water resources system. Other variables identified as well connected are “water use conflicts”, “water management knowledge” and “water infrastructure”, which is unsurprising given that droughts have historically marked the semi-arid region of Ceará state and that climate change is currently the subject of several discussions worldwide.
Statistical measures in the SNA provided insights about the structure of the network. We measured reciprocity, transitivity, and centrality (degree, betweenness, closeness, eigenvector) in the social network to identify the importance of vertices in the network. We observed that almost half of their connections are mutual and that it has a 60% probability of forming clusters. Using eigenvector centrality, we identify that there are certain vertices as the central in the social network, which are “water use conflicts” and “human supply”. For density, the graph was considered sparse – that is, the number of connections is not so close to the maximum number of edges. The results unsurprisingly suggested that individuals and agencies/organizations have different roles in social networks during emergency responses. What was unexpected, however, was the emergence of conflict as a central variable, a finding that gave us confidence in suggesting that it should be treated as a feature of system dynamics.
Identifying the connectivity of the variables and the delimitation of clusters of a set of variables can prove invaluable to the construction of integrated management of water resources. Variables with high centrality are of great relevance to the water resources management system, and should be considered central concerns for the water resources manager who must address specific policies to address these variables. The clusters of variables indicate thematic sets, and due to their significant interrelation, they must be treated together in such a way as to produce more robust solutions for the management of water resources.
As an example, we have the variable “Climate Change” classified as a key variable that directly affects another key variable “Hydrological Extremes – Drought” which in turn reflects in “Water Bodies Alterations” and “Water Quantity” and so on, creating the network where actions in one variable have consequences in several others. The percentage obtained indicates a high interrelation between the variables and that this translates into the elaboration of public policies that must address the problem as a whole.
It should be noted that developing this study was not without difficulties, be it due to the logistics of applying the matrix, be it because of the scarce financial resources available to the team. Therefore, it is recommended that the study be applied to a greater number of stakeholders in water resources management in Ceará. In addition, it is suggested that in future studies, the development of prospective scenarios be performed based on the key and central variables identified in this present analysis. This methodology allows delineating future actions and measures if these key variables disturb the system.
The framework presented here is a sketch of a method that could prove useful in the study of socio-hydrological systems. Social network theory can contribute to an understanding of socio-hydrological systems beyond the analytical methods of coupled human–water systems. We suggested that the best way to model such systems is by viewing them as networks of “factors”. Viewing the system as a network is useful to understand how it “thinks”, where the systemic “thought process” emerges from the causal relationship between factors. We believe it is a promising method for linking the hydrosphere to the biosphere and the noosphere (Vernadsky Citation1997) in a way that is more adequate for understanding the Anthropocene.
One particular finding that illustrates the potential of the present study for socio-hydrology was the discovery that conflict is the central factor in the network of socio-environmental interrelationships. This discovery was only possible by first reconstructing the Jaguaribe Basin system as a network of factors identified through painstaking fieldwork with COGERH experts and then using network analysis to detect emergent phenomena from the interrelationships of factors.
Thus, the analysis presented here illustrates some surprising emergent phenomena that is generally overlooked by models that view conflict simply as an antisocial instinct, turning their focus to the discovery of system rules that can “resolve” conflict through normative paradigms (Basurto Citation2005, Ostrom Citation2007). More research is needed on this front to determine how the study of conflict can best assist in the construction of more accurate models of coupled human–water systems.
The revelation that conflict is the single most important variable of the socio-hydrological system of the present study, i.e. the Jaguaribe Basin, finds support in the social, biological, and anthropological literature that regards conflict as a functional social regulatory force (Rappaport Citation1967, Clastres Citation1989, de Waal Citation2000, Mauss Citation2000). Viewing conflict from this functional/regulatory perspective may be an important step toward solidifying socio-hydrology as a “use-inspired” predictive science (Sivapalan et al. Citation2014, p. 228).
7 Conclusions
The socio-hydrological system of the Jaguaribe Basin is a dynamic network where factors, i.e. the nodes representing symbolic interrelationships, are assigned values which can be modified in time according to political, socioeconomic and climatic changes. This modulates the spread of information and the decisions made by policy makers, water managers and users alike. Water allocation is, therefore, a complex process involving multiple actors and interests, established rules, diverse levels of conflicts, accumulated knowledge and information, physical and social heterogeneities, normative apparatus and a reality marked by uncertainties and risks related to climate and socioeconomics. In this polycentric system (Ostrom Citation2010), COGERH has attributions and powers to define rules of water operation and allocation, finding itself in a privileged position to classify the most important factors in the socio-hydrological network that makes up the Jaguaribe coupled human–water system.
Intuitively, COGERH experts already knew that relatively small changes in connectivity would result in large changes in the whole network structure. The methodology used in this study provides a more rigorous, quantitative analysis of what was held to be everyday knowledge by COGERH experts. Using a structural matrix method coupled with SNA, we were able to confirm what was known about the structural properties of the system. We were further able to identify subsystems from the median structural matrix developed in the workshop.
Di Baldassarre et al. (Citation2019) have shown how sociohydrology can assist in the analysis of management processes by combining three important fields of study: (1) water resource systems (WRS); (2) integrated water resources management (IWRM); and (3) interdisciplinary frameworks that explore “the mutual shaping of society and nature” (p. 6328). Furthermore, they discuss how the field of sociohydrology can potentially “bridge the gap between the [broadly defined Sustainable Development Goals of the United Nations Agenda 2030] and the more specific IWRM/WRS set of principles and methodologies” (p. 6330).
In this context, our methodology identified the subsystems (i.e. the clusters) where public policies must act, thus reducing financial resources costs. We found SINGERH as a result confirming his importance to the system. Considering drought, one can mention as policies the water block tariff implementation and amplification of the region’s supply matrix. As for climate change, we should focus on pollution reduction policies and studies aimed at climate forecasting, such as Ceará Foundation of Meteorology and Water Resources (FUNCEME) does.
Therefore, we discover and explain among the countless possible variables those that influence and those that are influenced by the system, while illustrating that such variables are central to each subsystem’s regulation. Thus, there is the emergence of the centrality of conflicts in regulating the system and the possibility of specifying the central variables for each subsystem and the whole system. The fact that “conflict” has emerged as central is an example of a “surprise” characteristic of emergent phenomena that we would otherwise not think to be central to well-managed systems.
Acknowledgements
The study was financed in part by the Conselho Nacional de Desenvolvimento Científico e Tecnológico- Brasil (CNPq), the Coordenação de Aperfeiçoamento de Pessoal de Nível Superior (CAPES) and the Fundação Cearense de Apoio ao Desenvolvimento Científico e Tecnológico (FUNCAP) – Finance Code 001.
Disclosure statement
No potential conflict of interest was reported by the authors.
Data availability statement
Simulation data from this work will be archived in the Consortium of Universities for the Advancement of Hydrologic Science, Inc. (CUAHSI) data website https://www.hydroshare.org/resource/9a40f5ef4e024044a0080d3fdb8bbcf9/
References
- Abdoli, S., Habib, F., and Babazadeh, M., 2018. Making spatial development scenario for south of Bushehr province, Iran, based on strategic foresight. Environment, Development and Sustainability, 20 (3), 1293–1309. doi:10.1007/s10668-017-9940-x
- Agência Nacional de Águas (Brasil), 2019. https://www.ana.gov.br/aguas-no-brasil/sistema-de-gerenciamento-de-recursos-hidricos/comites-de-bacia-hidrografica/comites-estaduais/ceara.
- Ahmadi, A., et al., 2020. A stakeholder-based decision support system to manage water resources. Journal of Hydrology, 589, 125138. doi:10.1016/j.jhydrol.2020.125138
- Azevedo, L.D., Porto, R.L.L., Méllo Junior, A.V., Pereira, J.G., Arrobas, D.L.P., Noronha, L., and Pereira, L.P., 2005. Transferência de água entre bacias hidrográficas. Brasília: Banco Mundial.
- Basurto, X., 2005. How locally designed access and use controls can prevent the tragedy of the commons in a Mexican small-scale fishing community. Society and Natural Resources, 18 (7), 643–659. doi:10.1080/08941920590959631
- Chaffin, B.C., et al., 2016. Institutional networks and adaptive water governance in the Klamath River Basin, USA. Environmental Science & Policy, 57, 112–121. doi:10.1016/j.envsci.2015.11.008
- Clastres, P., 1989. Society against the state: essays in political anthropology. Princeton University Press.
- Clauset, A., Newman, M.E., and Moore, C., 2004. Finding community structure in very large networks. Physical Review E, 70 (6), 066111. doi:10.1103/PhysRevE.70.066111
- Csardi, G. and Nepusz, T., 2006. The igraph software package for complex network research. InterJournal, Complex Systems, 1695 (5), 1–9.
- De Laat, M., Lally, V., Lipponen, L., and Simons, R. J., 2007. Investigating patterns of interaction in networked learning and computer-supported collaborative learning: A role for Social Network Analysis. International Journal of Computer-Supported Collaborative Learning, 2(1), 87–103.
- de Waal, F.B.M., 2000. Primates – a natural heritage of conflict resolution. Science, 289, 586–590. doi:10.1126/science.289.5479.586
- Di Baldassarre, G., et al., 2019. Sociohydrology: scientific challenges in addressing the sustainable development goals. Water Resources Research, 55 (8), 6327–6355. doi:10.1029/2018WR023901
- do Nascimento, E.P., Neves, M.J.M., and Christofidis, D., 2010. Prospecção no universo das águas: a experiência da construção de cenários no plano nacional de recursos hídricos no Brasil, 2005-2006. Geosul, 25 (49), 27–62. doi:10.5007/2177-5230.2010v25n49p27
- Freeman, L.C., Roeder, D., and Mulholland, R.R., 1979. Centrality in social networks: II. Experimental results. Social Networks, 2(2), 119–141.
- Ghoreishi, M., et al., 2020. Socio-hydrological approach to understand conflict and cooperation dynamics in transboundary rivers. In EGU General Assembly Conference Abstracts, 7148.
- Godet, M. and Durance, P., 2011. La prospectiva estratégica. Paris: Lipsor.
- Golfam, P., et al., 2019. Prioritization of water allocation for adaptation to climate change using multi-criteria decision making (MCDM). Water Resources Management, 33 (10), 3401–3416.
- Grumbach, R.J.D.S. and Marcial, E., 2008. Prospective scenarios: building a better future. Rio de Janeiro: FGV.
- Holländer, H.M., et al., 2009. Comparative predictions of discharge from an artificial catchment (Chicken Creek) using sparse data. Hydrology and Earth System Sciences, 13, 2069–2094. doi:10.5194/hess-13-2069-2009
- Instituto Brasileiro de Geografia e Estatística, 2018. Estimativas da população residente para os municípios e para as unidades da federação com data de referência em 1º de julho de 2018.
- Kim, J. and Hastak, M., 2018. Social network analysis: characteristics of online social networks after a disaster. International Journal of Information Management, 38 (1), 86–96. doi:10.1016/j.ijinfomgt.2017.08.003
- Kolaczyk, E.D. and Csárdi, G., 2014. Statistical analysis of network data with R (Vol. 65). New York: Springer.
- Krupa, M., et al., 2018. Mapping the stakeholders: using social network analysis to increase the legitimacy and transparency of participatory scenario planning. Society & Natural Resources, 31 (1), 136–141. doi:10.1080/08941920.2017.1376140
- Mauss, M., 2000. The gift: the form and reason for exchange in archaic societies. Routledge.
- Melsen, L.A., Vos, J., and Boelens, R., 2018. What is the role of the model in socio-hydrology? Discussion of “prediction in a socio-hydrological world”. Hydrological Sciences Journal, 63 (9), 1435–1443. doi:10.1080/02626667.2018.1499025
- Mostert, E., 2018. An alternative approach for socio-hydrology: case study research. Hydrology and Earth System Sciences, 22, 317–329. doi:10.5194/hess-22-317-2018
- Ogada, J.O., et al., 2017. Managing resources through stakeholder networks: collaborative water governance for Lake Naivasha basin, Kenya. Water International, 42 (3), 271–290. doi:10.1080/02508060.2017.1292076
- Oliveira, A.S., et al., 2018. Prospective scenarios: a literature review on the Scopus database. Futures, 100, 20–33. doi:10.1016/j.futures.2018.03.005
- Oliveira, M., and Gama, J., 2012. An overview of social network analysis. Wiley Interdisciplinary Reviews: Data Mining and Knowledge Discovery, 2 (2), 99–115. doi:10.1002/widm.1048
- Ostrom, E., 2007. A diagnostic approach for going beyond panaceas. PNAS, 104 (39), 15181–15187. doi:10.1073/pnas.0702288104
- Ostrom, E., 2010. Beyond markets and states: polycentric governance of complex economic systems. American Economic Review, 100, 1–33. doi:10.1257/aer.100.3.641
- Porter, M.E., 1989. Competitive advantage: creating and sustaining superior performance. 19ª ed. Rio de Janeiro: Campus.
- Prell, C. and Bodin, Ö., ed., 2011. Social networks and natural resource management: uncovering the social fabric of environmental governance. Cambridge: Cambridge University Press.
- Rappaport, R.A., 1967. Ritual regulation of environmental relations among a New Guinea people. Ethnology, 6 (1), 17–30. doi:10.2307/3772735
- Ross, A. and Chang, H., 2020. Socio-hydrology with hydrosocial theory: two sides of the same coin? Hydrological Sciences Journal, 65 (9), 1443–1457.
- Schwartz, P., 2000. The art of long vision. São Paulo: Nova Cultural.
- Scott, J., 2017. Social network analysis. London: Sage.
- Silva, S.M.O., et al., 2019. Proposta de gestão integrada das águas urbanas como estratégia de promoção da segurança hídrica: o caso de Fortaleza. Engenharia Sanitaria e Ambiental, 24 (2), 239–250. doi:10.1590/s1413-41522019181776
- Silva, S.M.O.D., Souza Filho, F.D.A., and Aquino, S.H.S., 2017. Avaliação do risco da alocação de água em período de escassez hídrica: o caso do Sistema Jaguaribe-Metropolitano. Engenharia Sanitaria e Ambiental, 22, 749–760. doi:10.1590/s1413-41522017161303
- Sivapalan, M., et al., 2014. Socio‐hydrology: use‐inspired water sustainability science for the Anthropocene. Earth’s Future, 2 (4), 225–230. doi:10.1002/2013EF000164
- Sivapalan, M. and Blöschl, G., 2015. Time scale interactions and the coevolution of humans and water. Water Resources Research, 51 (9), 6988–7022. doi:10.1002/2015WR017896
- Sivapalan, M., Savenije, H.H., and Blöschl, G., 2012. Socio‐hydrology: a new science of people and water. Hydrological Processes, 26 (8), 1270–1276. doi:10.1002/hyp.8426
- Sousa, C.S.G.D., 2013. Cenários prospectivos da produção do biodiesel no Brasil em 2020.
- Srinivasan, V., et al., 2017. Prediction in a socio-hydrological world. Hydrological Sciences Journal, 62 (3), 338–345.
- Surahman, A., Soni, P., and Shivakoti, G.P., 2018. Improving strategies for sustainability of short-term agricultural utilization on degraded peatlands in Central Kalimantan. Environment, Development and Sustainability, 1–21. doi:10.1007/s10668-018-0090-6
- Vernadsky, V.I., 1997. Scientific thought as a planetary phenomenon. Russian Academy of Sciences. Moscow: Nauka.
- Watts, D.J., and Strogatz, S.H., 1998. Collective dynamics of ‘small-world’networks. Nature, 393(6684), 440–442.
- Wei, J., et al., 2021. News media coverage of conflict and cooperation dynamics of water events in the Lancang–Mekong River basin. Hydrology and Earth System Sciences, 25 (3), 1603–1615.
- Yang, R.J., 2014. An investigation of stakeholder analysis in urban development projects: empirical or rationalistic perspectives. International Journal of Project Management, 32 (5), 838–849. doi:10.1016/j.ijproman.2013.10.011
Appendix A
Table A1. Potential structural analysis matrix. Source: Author
Table A2. Influence and dependence values of each variable
Table A3. Local transitivity
Table A4. Degree
Table A5. Centralities