
ABSTRACT
This study investigated the influence of land use change and climate change on changes in streamflow in the Bengawan Solo River (BSR, 16 389 km2) basin, Indonesia. We applied the excess water and energy approach to three tributaries of the BSR, namely Pidekso, Madiun and Kening rivers, which represent the up-, mid-, and downstream parts of the BSR, respectively. This study used hydrological data from 1982−2013 and land use data for the years 1994 and 2013. The results show that from 1982 to 2013, the annual streamflow of the Pidekso and Madiun River increased, while in the Kening River it decreased. Based on attribution measures, the increasing streamflow trend in the Pidekso and Madiun rivers is mainly attributed to land use change, while the decreasing streamflow trend in the Kening River is mainly attributed to climate change. These conclusions are supported by statistical analyses and land use change analysis.
Editor S. Archfield; Associate editor K. Ryberg
1 Introduction
Hydrology in tropical regions is unique. It differs from that in other regions by having greater energy inputs with large spatial and temporal variability and faster rates of change including human-induced change (Wohl et al. Citation2012). A continuous reduction of tropical forest area due to cropland expansion, an increase in the average temperature,and changes of unknown magnitude in the spatial and temporal variability of rainfall have been projected to increase the frequency of disastrous events in tropical regions (Marfai et al. Citation2008, Wohl et al. Citation2012, Nobre et al. Citation2016).
In recent decades, Java Island in Indonesia experienced many water-related hazards such as floods and droughts (Marfai et al. Citation2008, Islam et al. Citation2016). These natural hazards are partly caused by human-induced land use changes, such as deforestation and urbanization (Verburg and Bouma Citation1999, Marhaento et al. Citation2017a, Citation2017b), aggravated by climatic variability and climate change (Hulme and Sheard Citation1999, Aldrian and Djamil Citation2008). These hazards have societal, economic and ecological implications at local as well as regional levels (Naylor et al. Citation2007, Marfai et al. Citation2008). Furthermore, it was predicted that future population growth and increasing demand for food and fibre in Java would put further pressure on the need for land and water to meet the demands (Syaukat Citation2011), and future climate change will cause more extreme weather and events (Aldrian and Djamil Citation2008). These changes will increase the vulnerability of populated areas to floods and droughts and will further impact food security.
To mitigate the water-related hazards, the Indonesian government established land use and water management measures to improve the availability of water resources (e.g. balancing the seasonal water availability, where more water is available in the dry season and less water flows in the wet season). However, it remains a challenge to measure the effectiveness of land use and water management projects, due to complex interactions between land use and climate variability (Zhang et al. Citation2008, Romanowicz and Booij Citation2011). Land use change and climate change may not only result in accelerating changes in hydrological processes (Legesse et al. Citation2003, Marhaento et al. Citation2018), but may also offset each other (Zhang et al. Citation2016).
Information on the relative impacts of land use change and climate change on water availability would help to estimate the effectiveness of land use management practices at the landscape level (Marhaento et al. Citation2017b). Numerous scholars argue that changes in land use management may also lead to changes in total runoff within a catchment (Azevedo et al. Citation2005, Zhang et al. Citation2012, Marhaento et al. Citation2019). However, there is less evidence regarding the type and direction of these impacts, particularly for large catchments where interference with climate change becomes more critical (DeFries and Eshleman Citation2004). Furthermore, knowledge on how changes in water availability can be attributed to changes in land use versus changes in climate is also needed as a basis for payment for environmental services (PES) schemes (payments for proper land management with the idea that this helps to maintain, for example, natural river flows), which are under development in many tropical countries, including Indonesia (Southgate and Wunder Citation2009, Lapeyre et al. Citation2015, Ota et al. Citation2020). The United Nations Food and Agriculture Organization (FAO Citation2004) noted that PES schemes in catchments require an accurate quantitative assessment of land use impacts on the quantity and quality of downstream water, so that payment to upstream landowners to maintain or modify a particular land use can be estimated.
In general, there are two ways to separate impacts of land use change and climate change on streamflow, namely a modelling and a nonmodelling approach. A modelling approach is often used to measure the relative effects of land use change and climate variability on water availability (Shi et al. Citation2013, Khoi and Suetsugi Citation2014). However, the ability to produce reliable outcomes is offset by the need for large amounts of data. Moreover, models require calibration, which is a time-consuming activity. As an alternative, nonmodelling approaches were introduced, which are data driven and able to provide reasonable results (Tomer and Schilling Citation2009, Zhang et al. Citation2012, Citation2014).
This study aims to quantify the relative contributions of land use change and climate change to changes in streamflow of the Bengawan Solo River (BSR) in Java, Indonesia, which is well known for its rapid deforestation and for the development of agricultural areas and settlements over the past few decades (see Margono et al. Citation2014). A nonmodelling approach from Marhaento et al. (Citation2017b) was used to achieve the objective. In this approach, the observed time series of rainfall, streamflow and calculated potential evapotranspiration of the study catchment were used to attribute changes in the streamflow to land use change and climate change based on changes in the proportion of excess water relative to changes in the proportion of excess energy.
The method of Marhaento et al. (Citation2017b) was tested for a large sample set of 472 catchments in the United States and Australia, and the contributions of land use change versus climate change to changes in the streamflow of those catchments were successfully distinguished (Booij et al. Citation2019). Although the method is applicable to catchments with various characteristics, it has never been applied to a large catchment (> 10 000 km2). This study applied the method to upstream, midstream and downstream catchments within one large catchment (16 389 km2), where land use and climate variability operate at different scales. This study will contribute to the scientific field of hydrology in two ways: first, it will be useful to the advancement of the attribution method we developed; and, second, it will provide insight into the impacts of changes in land use and climate on water availability in a large tropical catchment that is still not well understood.
The structure of the paper is as follows. A description of the study area and an overview of the data used are given in Section 2. Section 3 explains the methods used to quantify the attribution of changes in streamflow to land use change and climate change and to validate the results through trend analysis and land use change analysis. The results are presented and discussed in Sections 4 and 5, respectively. Conclusions are drawn in Section 6.
2 Study area and data
2.1 Catchment description
The BSR is the largest river basin in Java Island, Indonesia, with a total length of 548 km and a catchment area of about 16389 km2. It is located between latitudes 6°48′ and 8°60′ S and between longitudes 110°25′112°40′ E. The BSR flows through 17 districts and three cities within two provinces, namely Central Java and East Java, and plays an important role in the economy of those districts and cities. However, the population living along the BSR frequently suffers from water-related disasters, such as floods and drought (Rukmana et al. Citation2016).
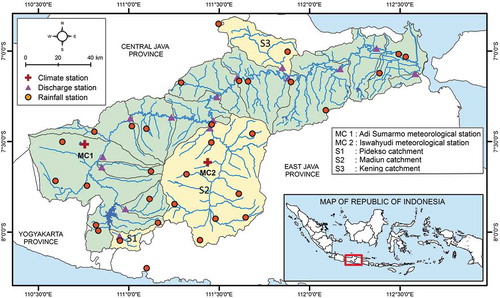
In this study, 15 catchments of the Bengawan Solo basin (see ) were delineated based on the outlets where discharge gauges are located. Subsequently, three catchments representing the upstream (i.e. the Pidekso catchment), the midstream (i.e. the Madiun catchment) and the downstream (i.e. the Kening catchment) parts were examined. The characteristics of these three catchments are given in .
Table 1. Catchment characteristics of the study area
Figure 1. Location of the Bengawan Solo catchment and the distribution of gauges. The catchments marked in yellow are part of the study area
2.2 Data availability
2.2.1 Hydrometeorological data
Daily streamflow data for the three catchments were provided by the Balai Besar Wilayah Sungai Bengawan Solo (Bengawan Solo River Basin Organization) for the period 1982–2013. The reliability of the time series was ensured through data screening and a visual check of the hydrograph. The errors found and missing streamflow values (less than 5% of the data) were corrected using a nonlinear recession model (Wittenberg Citation1994). This method was selected after Pearson’s test showed low correlation coefficients between discharge stations in the study area and adjacent discharge stations, which inhibited the use of widely used regional regression models to estimate the discharge. Moreover, the recession model is conceptually simple where the depletion of the storage volume decreases exponentially with time. However, it should be noted that this method is more applicable to low-flow periods, which was the case in this study where the corrected values were mostly present in the dry period.
Daily rainfall data from 30 rainfall stations located within the vicinity of the Bengawan Solo catchment were provided by the Bengawan Solo River Basin Organization. As with the discharge data, a quality analysis was carried out to check for errors in the data since most of the rainfall and meteorological data were manually recorded from the gauges. Doubtful and unrealistic values (e.g. negative rainfall values) and missing data were corrected using the normal ratio method (Paulhus and Kohler Citation1952). The normal ratio method is appropriate for our study area because it has significant topographic variations (Tung Citation1983) with large station-to-station variations (more than 10%) (McCuen Citation1989).
To provide the rainfall depths for the entire catchment, daily rainfall values were averaged for each catchment using the Thiessen polygon method (Thiessen Citation1911). This is a simple and practical method to compute average values of an area based on weighting stations (Ahmed et al. Citation2020a, Citation2020b). However, we found that the mean elevations of the Thiessen stations were different from the mean elevations of the catchments. Therefore, a precipitation–elevation relation was used to correct the rainfall data. We performed a linear regression between the mean annual rainfall and the elevation of 30 stations. A strong relationship between rainfall and elevation (R2= 0.63) was found, with an increase of approximately 214 mm of rainfall per 100 m increase in elevation. This value is close to the result of Basist et al. (Citation1994), who found an increase in average annual rainfall of around 200 mm per 100 m increased elevation in a tropical region. However, it is higher than the result of Subarna et al. (Citation2014), who estimated a slope of approximately 140 mm/100 m for the Cisangkuy catchment in West Java Province, Indonesia.
Meteorological data for the study areaother than rainfall data were made available from two meteorological stations, at Adi Sumarmo Airport and Iswahyudi Airport, for the period 1982–2013. The Penman-Monteith method was used to estimate potential evapotranspiration (ET0). However, about 30% of the meteorological data from the Iswahyudi station was missing for the period 1982−1997. Data from the Adi Sumarmo meteorological station were used to fill in the missing values using the normal ratio method, because of its robust and complete dataset. Moreover, the Pearson’s test showed high correlation coefficients for all meteorological variables (i.e. minimum and maximum temperature, relative humidity, wind speed, and solar radiation) between Adi Sumarmo and Iswahyudi stations, which allowed the use of the normal ratio method to fill the missing values. However, for several dates we found that no data were available for either station. In these cases we determined the daily potential evapotranspiration based on data from the Consultative Group on International Agricultural Research – the Consortium for Spatial Information (CGIAR-CSI). They provide a historical global estimation of potential evapotranspiration from 1901 to 2006 on a monthly basis at a spatial resolution of 0.5° x 0.5°.
However, before using the CGIAR-CSI data to fill the missing ET0 values, we corrected the bias between the ground station data and the CGIAR-CSI data using a correction factor that was calculated from the ratio between the mean monthly evapotranspiration value from CGIAR-CSI and ground station data. This procedure applied to less than 1% of the data. Next, we averaged daily ET0 for each catchment based on its geographic distance to the climate stations. An elevation correction for ET0 was not performed since our data availability was not sufficient to determine the correlation between potential evapotranspiration and elevation. However, the elevation gap between the mean elevation of catchments and the meteorological station is minor. shows the hydrological characteristics of the three catchments.
Table 2. Hydrological characteristics of the study area
2.2.2 Spatial data
This study used Landsat images from the United States Geological Survey (USGS) archives to obtain land use information. The data scene (path/row) numbers are 119/65, 119/66, 120/65 118/65. We used Landsat images because these are widely used in land use/land cover mapping and span more than 30 years of data with global coverage (Wulder et al. Citation2008). The acquisition dates used for 1994 and 2013 were in the dry season (April–September) to ease the distinction between forested and nonforested areas (i.e. agriculture area) and to avoid image interference due to cloud cover. We selected a threshold for cloud cover of less than 10% per image scene for further analysis. In addition, we used an elevation map of Bengawan Solo catchment with a contour interval (CI) of 12.5 m from the Geospatial Information Agency of Indonesia to delineate the catchment boundaries and determine the catchment characteristics (i.e. average elevation, average slope and stream density) listed in .
3 Methods
3.1 Quantifying the contribution of land use change and climate change to streamflow variation
We followed the method of Marhaento et al. (Citation2017b) to quantify the relative contributions of land use change and climate change to changes in streamflow of the study area. The method comprises two main steps. First, the hydrological time series are split into two parts, a baseline and an altered period, when land use change and climate change might have contributed to streamflow change. Second, the attribution method is applied to three sub-catchments within the Bengawan Solo catchment.
For the first step, the hydrological time series from 1982 to 2013 was split into two periods: the years 1982–1997 as the baseline period and the years 2003–2013 as the altered period. The selected years correspond to the period of national political changes which directly and indirectly affected land use change in the study area (Hidayat Citation2008). According to Resosudarmo et al. (Citation2012), the period 1998–2003 is the “reformation era,” when many local communities in Java, including those in the research area, reclaimed the state forests and massively converted forest areas to other land uses including agriculture. This situation is likely similar to the earlier period in the 1950s–1970s (i.e. after independence) when a fair proportion of forest area was converted to dry-land agriculture and built-up area, which later affected the hydrological processes in several catchments in Java (Bruijnzeel Citation1989).
To calculate the attribution, we follow the method of Marhaento et al. (Citation2017b), who extended the concept of Tomer and Schilling (Citation2009) to attribute changes in streamflow to land use change and climate change using changes in the relative partitioning of excess water and energy in a two-dimensional plot. The extended method of Marhaento et al. (Citation2017b) was tested by Booij et al. (Citation2019) for a large sample set of 472 catchments in the United States and Australia.
The basic concept of Tomer and Schilling (Citation2009) is that the impacts of land use change and climate change on streamflow alteration are independent where climate (represented by potential evapotranspiration and rainfall, ET0 and P) and land use (represented by actual evapotranspiration, ET) are not explicitly related. An increase (decrease) in the ratio of ET to P balances with a decrease (increase) in the ratio of ET to ET0, and the sum of the two terms will be constant. Renner et al. (Citation2012) found that the basic concept of change directions in excess water and energy from Tomer and Schilling works for an area where the long-term average ET0 equals P, specifically in a range between 2/3 < ET0/P < 3/2, and the results of Tomer and Schilling (Citation2009) are similar to the results from the Budyko framework (Budyko Citation1974). In addition, Renner et al. (Citation2012) indicated that the concept of orthogonality using Pex (i.e. amounts of excess water divided by the available water amount, 1 – ET/P) against Eex (i.e. amounts of excess energy divided by the available energy amount, 1 – ET/ET0) does not work when ET is close to a limit (ET/P ~ 1 or ET/ET0 ~ 1), because then the orthogonality assumption violates the principles of mass and energy conservation. After checking the relationship between ET0 and P for the study catchments, we found that the aridity index values (i.e. ET0/P) of the Pidekso, Madiun and Kening catchments are 0.67, 0.69, and 1.04, respectively. Therefore, the study catchments are within the range of applicability of the Tomer and Schilling (Citation2009) framework.
The relative contributions of climate change (CC) and land use change (LUC) can be determined through geometric calculations (see ). A shift in the afforestation (deforestation) direction in will be indicated with a negative (positive) value for the contribution of land use change. A shift in the P/ET0 increase (P/ET0 decrease) direction in will be indicated with a negative (positive) value for the contribution of climate change.
Figure 2. Tomer and Schilling’s (Citation2009) framework, adapted after Marhaento (Citation2018), illustrating how the fractions of excess water (Pex) and excess energy (Eex) respond to climate change and land use change. The points M1 and M2 are the fractions of excess water and energy forir the baseline period (Eex1, Pex1) and the altered period (Eex2,Pex2), respectively. The resultant length (R) is the magnitude of the combined influence of land use change and climate change
The slope (θ) of change indicates the magnitude of the contribution of land use change and climate change, with a higher slope reflecting a higher contribution of climate change. The resultant length (R) is the shift distance from the baseline to the altered conditions that indicates the magnitude of the changes of excess water and energy, with a higher result indicating a higher magnitude. Furthermore, the relative contributions of land use change and climate change to streamflow alteration can be determined by the length of the changes along the aridity index line and the line perpendicular to the aridity index line, which are denoted LUC and CC, respectively. The slope (θ), the resultant length (R), and the relative contributions of land use change (LUC) and climate change (CC) to streamflow alteration were calculated geometrically. For more detailed information about the concept and calculations, we suggest reading Marhaento et al. (Citation2017b).
3.2 Trend analysis of climate variability
Trend analysis was performed to check whether the continuous time series of rainfall (P) and potential evapotranspiration (ET0) have significantly changed over time (in the long term). We performed these trend analyses to validate the results of the attribution of changes in streamflow to climate change. The Mann-Kendall test was selected since it is widely used to detect trends in long time series of hydrological and climatological data (Zhang et al. Citation2012, Citation2014). Furthermore, the magnitude of monotonic trends was calculated using Sen’s slope estimator (Sen Citation1968). The idea of Sen’s slope estimator is to compare the change in values against time in the Mann-Kendall’s trend and take the median slope to determine the magnitude of the trend.
3.3 Land use change analysis
Land use change analysis was performed to validate the contribution of land use change to streamflow changes. Image processing of Landsat images from 1994 and 2013 was carried out to assess the land use change within the study area. Before image processing, the following pre-processing analysis was applied to the selected images: (1) a nonsystematic geometric correction, performed to correct errors in object positioning on the Earth’s surface. Note that we used level 1B Landsat products where systematic but insufficient geometric corrections had already been applied. The 2013 image was georeferenced using image-to-map registration based on a topographic map of scale 1:25 000 from the Geospatial Information Agency of Indonesia. The 1994 image was georeferenced using image-to-image registration based on previously registered images; (2) a masking analysis was performed to obscure the area outside our study area and to exclude incorrect pixel values caused by clouds and shadows. The catchment boundary map resulting from the elevation map of Bengawan Solo catchment was used to delineate our study area, and we visually digitized clouds and shadows to confine missed pixel values; (3) radiometric corrections were performed to minimize atmospheric effects, using radiometric correction tools embedded in ENVI (www.exelisvis.com) software.
After the pre-processing analysis was completed, we applied a maximum likelihood algorithm to retrieve the land cover map for 2013. The maximum likelihood algorithm was selected since it considers the spectral variation within each category and the overlap covering different classes (Rientjes et al. Citation2011). In this study, we classified land cover following the classification system of the Geospatial Information Agency of Indonesia. Finally, an error matrix (Congalton Citation1991) was created to calculate the land cover classification accuracy using two measures: the overall accuracy and the kappa coefficient. The overall accuracy is obtained by dividing the total number of correct samples by the total number of samples, and the kappa coefficient is the coefficient of agreement between the classification map and the reference data from the ground check.
In this study, 729 (unit) samples from the ground check were used to carry out the accuracy assessment. The results of the error matrix showed that the overall accuracy was 89.6% and the Kappa coefficient was 86.9%. According to Anderson et al. (Citation1976), our classification represents a strong agreement and good accuracy since the kappa coefficient was above 85%. However, it should be noted that the accuracy assessment was performed for the image classification from 2013. We used the 2013 land use map as the benchmark to perform image classification for 1994 based on the assumption that there were no additional land use classes during 1994–2013. Finally, following the land use classification system of the Geospatial Information Agency of Indonesia, it was observed that there were eight dominant land use classes within our study area: forest, mixed plantation, settlement, irrigated farming, non-irrigated farming, shrub, bare land and water body.
4 Results
4.1 Relative contributions of land use change and climate change to streamflow alteration
Using the attribution measures, we estimated the relative contributions of land use change and climate change to streamflow changes within the study area. The change in excess water and energy for the three catchments is shown in , and the results for the quantitative measures of land use change and climate change contributions to streamflow changes are shown in .
Table 3. Calculation of the contribution of land use change and climate change to streamflow alteration in the study catchments
Figure 3. Change of excess water (Pex) and excess energy (Eex) from the baseline period (B) to the altered period (A) relative to the aridity index (AI) for (a) the Pidekso catchment, (b) the Madiun catchment, and (c) the Kening catchment
The results show a simultaneous increase of Pex and Eex for the Pidekso and Madiun catchments, but not for the Kening catchment where Pex decreases but Eex increases. The Pidekso catchment gives the highest resultant length (R), with a value of 0.39, while the slope (θ) value was the smallest, at 4.55°, indicating a significant contribution of land use change to the streamflow alteration. For the Madiun catchment, the resultant length (R) and slope (θ) values were 0.10 and 23.87°, respectively. For the Kening catchment, the resultant length (R) was the smallest, with a value of 0.09, while the slope (θ) value was the largest, at 65.55°, indicating a significant contribution of climate change to the streamflow alteration. Finally, it was estimated that the influence of land use change on streamflow in the Pidekso catchment was largest, with a value of 92.63%, followed by the Madiun catchment (69.33%) and the Kening catchment (31.25%). The Kening catchment behaves differently compared to the other two catchments, where climate change has a more significant influence than land use change.
4.2 Trend analysis of climate variability
A trend analysis was carried out for climate variables (i.e. annual rainfall and potential evapotranspiration). The results of the Mann-Kendall statistical test and Sen’s slope estimator are summarized in . They show that the trend in annual rainfall is not significant for the Pidekso and Madiun catchments at a significance level of up to 0.1, but there is a negative trend for the Kening catchment of −23.5 mm/year at a significance level of 0.05.
Table 4. The results of the Mann-Kendall trend test and Sen’s slope estimator for annual rainfall and potential evapotranspiration in three catchments
The annual potential evapotranspiration for all catchments showed a negative trend varying between −3.8 mm/year and −4.1 mm/year but not significant at a significance level of 0.1. These results show that there was no significant change in potential evapotranspiration within the catchments during the period 1982−2013.
In general, the results for the Mann-Kendall trend test and Sen’s slope estimator show that the mean annual rainfall and potential evapotranspiration have not significantly changed for the Pidekso and Madiun catchments; however, they have changed for the Kening catchment at a significance level of 0.05. The results are in line with the attribution results, which generally showed a (very) small contribution of climate change to changes in streamflow for the Pidekso and Madiun rivers. However, climate change makes a substantial contribution to changes in streamflow of the Kening River.
4.3 Land use change detection
Forest areas are associated with soil-water protected areas and are mostly located at elevations higher than 2000 m and slopes ≥ 45°. Mixed plantations are agricultural areas that are dominated by multipurpose trees (e.g. fruits, fuel woods, etc.), often combined with seasonal crops on the same unit of land, commonly privately owned. Teak (Tectona grandis) plantations, which are often found in the middle stream of Bengawan Solo catchment, were also classified as mixed plantations. Settlement is land for buildings and their surroundings. Irrigated farming is an agricultural area which mostly consists of paddy rice fields. Non-irrigated farming, also called dryland farming, occurs on agricultural area which is mostly located in the uplands, mainly used for the production of seasonal crops (palawija). Bare land and shrubs are abandoned area where the land is not available for agricultural purposes (i.e. critical land). Water body refers to surface water within the study area, such as rivers, lakes and ponds. These eight land use classes were then reclassified into four land use classes to produce more general land use classes, namely forest area (i.e. a combination of evergreen forest and mixed plantation), agricultural area (i.e. a combination of paddy field and dryland farming), settlements and others (i.e. a combination of shrub land, bare land and water body). shows the land use maps of the study catchments for 1994 and 2013. shows the land use change that occurred in the period 1994−2013.
Table 5. Land use distribution (in km2) in the three catchments for the years 1994 and 2013, and changes (in %)
Figure 4. Land use maps for the study catchments for the years 1994 and 2013
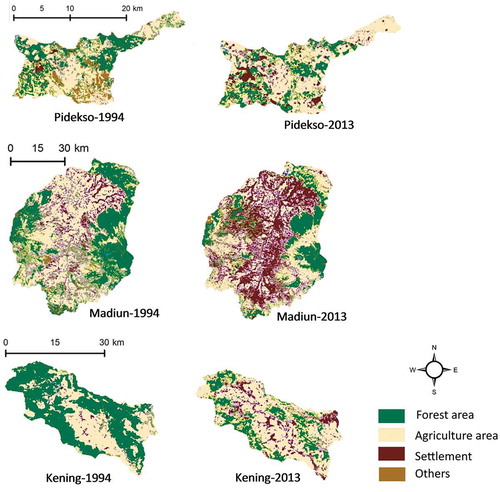
The results in show that the forest area significantly decreased between 1994 and 2013. A prominent change occurred in the Madiun catchment, where a total of 43.6% of the forested area was lost in this period. On the other hand, settlement catchments displayed generally decreasing forest area, which resulted in a massive decrease in tree areas within the study location. While climate statistically minor, significant changes in land use within the Pidekso and Madiun catchments may validate the immense contribution of land use change to streamflow alteration compared to climate change. However, it can be observed that large changes in land use (i.e. more agriculture and settlement at the expense of forest area in particular) also occurred in the Kening catchment. Apparently, climate change has had a more pronounced impact on streamflow changes in this catchment.
5 Discussion
Using three attribution measures (i.e. the fractions of excess water and excess energy (Pex and Eex), the slope (θ) of change, and the resultant length, R), quantitative contributions of land use change and climate change to streamflow alteration in three tributaries of the Bengawan Solo River were obtained. Comparing the baseline period with the altered period, the ratios Pex and Eex increased simultaneously for the Pidekso and Madiun catchments, but not for the Kening catchment, where Pex decreases but Eex increases. The simultaneous increase of Pex and Eex creates a small slope (θ) value, indicating that land use change had a dominant effect on streamflow alteration with a percentage of more than 60% for the Pidekso and Madiun catchments. In the Kening catchment, a large slope (θ) was found, indicating that climate change had a greater influence on streamflow here than land use change did. These results are supported by the findings of both statistical analyses and land use change analysis.
Land use changes within all catchments, which are related to deforestation and expansion of settlements, were likely the cause of significant changes in streamflow generation. This is similar to the findings of Marhaento et al. (Citation2017a) that a continuous decline of tree areas in catchments may lower the infiltration rate, reduce the groundwater recharge and inhibit water from being stored in the soil. As a result, a larger volume of rainfall was transformed into surface runoff and increased streamflow. For the Kening catchment, where the rainfall significantly decreased, the hydrological response was likely influenced by the rainfall changes even though the rate of land use change (i.e. deforestation) was high as well. The different outcome for the Kening catchment, where rainfall is expected to influence streamflow, was in the same direction as the attribution results. The role of climate change in changes in water availability of catchments is apparently more pronounced in downstream areas (i.e. close to the seashore) than in upstream and midstream areas. This finding is similar to the results of Aldrian and Djamil (Citation2008), who found a decrease in annual rainfall, an increase in rainfall intensity during the wet season and an increase in the dry spell period, where significant changes occurred in the low-altitude area close to the seashore. Their study was conducted in the Brantas catchment (11 885 km2), a catchment adjacent to the Bengawan Solo, so the climatic conditions of the two catchments are comparable.
The resultant length (R) varied amongst catchments, indicating different impacts of land use change and climate change on streamflow. It was high for the Pidekso catchment (0.39), while the values for the Madiun catchment and the Kening catchmentwere relatively similar at 0.10 and 0.09, respectively. The low values for the resultant lengths in the Kening and Madiun catchments, together with a high rate of land use change and a significant rainfall trend, may indicate that the resultant lengths are affected by other factors besides land use change and climate change. We expect that the size of the catchment is one factor that influences the resultant lengths. We found that the contributions of land use change and climate change to streamflow alteration and the rate of land use change were quite similar in the Pidekso catchment (234 km2) and Madiun catchment (3759 km2), but their resultant lengths were different. The resultant length seems to decrease when the catchment size increases. Our results agree with those of D’Almeida et al. (Citation2007), who found that the magnitude of land use change impacts on hydrology decreased with increasing scale in the tropical Amazon basin.
Other authors have argued that land use change impacts on hydrology were small and less significant for meso- and macro-scale catchments (Fohrer et al. Citation2001, Beck et al. Citation2013). In addition to the catchment size, the slope may be a factor that influences the resultant lengths. We found that the resultant lengths were smaller for the Madiun and Kening catchments, which have a smaller average slope compared to the Pidekso catchment. The resultant length seems to increase when the average slope increases. According to Van Dijk et al. (Citation2007), a larger slope results in shallower soils, less infiltration and therefore more runoff. The impacts of topographic variation on hydrology were also investigated by, for instance, Booij (Citation2003), Hudson and Colditz (Citation2003) and Romshoo et al. (Citation2012), with results similar to ours.
The present study used a quantitative assessment to explore the contribution of land use change and climate change to changes in streamflow generation. However, we found that the method is sensitive to the data quality, particularly for rainfall, potential evapotranspiration and streamflow data. The data quality checks and data corrections using reliable methodologies carried out in this study may provide more reliable datasets. Although our analysis was carried out over a long period and on an annual basis, which may reduce random errors (Marhaento et al. Citation2017b), we note that more convincing results are expected if hydrological datasets are available for a long time period and data gauges are well distributed over the area of interest.
6 Conclusion
A quantitative assessment of land use change and climate change contribution to streamflow alteration was carried out for three catchments of the Bengawan Solo River in Java, Indonesia. The results showed that the contribution of land use change to changes in annual streamflow was significant for the Pidekso and Madiun catchments, while climate change made a more significant contribution than land use change in the Kening catchment. Our assessment was supported by a Mann-Kendall trend analysis, Sen’s slope estimator and land use change analysis. Moreover, the catchment size and the slope may affect the sensitivity of the streamflow to changes in land use and climate. However, to what extent these two factors contribute to changes in streamflow remains uncertain, and therefore further research is needed.
Acknowledgements
The authors thank the Bengawan Solo River Basin Organization, Adi Sumarmo meteorological office and Adi Sucipto meteorological office for providing the hydrological and climatological data. The first author thanks Saddamas Husein who assisted with the image processing analysis.
Disclosure statement
No potential conflict of interest was reported by the authors.
Additional information
Funding
References
- Ahmed, N., et al., 2020a. Climatic variability and periodicity for upstream sub-basins of the Yangtze River, China. Water, 12 (3), 842. doi:10.3390/w12030842
- Ahmed, N., et al., 2020b. Temperature trends and elevation dependent warming during 1965–2014 in headwaters of Yangtze River, Qinghai Tibetan Plateau. Journal of Mountain Science, 17 (3), 556–571. doi:10.1007/s11629-019-5438-3
- Aldrian, E. and Djamil, Y.S., 2008. Spatio-temporal climatic change of rainfall in East Java Indonesia. International Journal of Climatology, 28, 435–448. doi:10.1002/joc.1543
- Anderson, J.R., et al., 1976. A land use and land cover classification system for use with remote sensor data. Washington, DC, USA: Government Printing Office.
- Azevedo, J.C., et al., 2005. Impacts of the sustainable forestry initiative landscape level measures on hydrological processes. Water Resources Management, 19 (2), 95–110. doi:10.1007/s11269-005-1503-5
- Basist, A., Bell, G.D., and Meentemeyer, V., 1994. Statistical relationships between topography and precipitation patterns. Journal of Climate, 7 (9), 1305–1315. doi:10.1175/1520-0442(1994)007<1305:SRBTAP>2.0.CO;2
- Beck, H.E., et al., 2013. The impact of forest regeneration on streamflow in 12 mesoscale humid tropical catchments. Hydrology and Earth System Sciences, 17 (7), 2613–2635. doi:10.5194/hess-17-2613-2013
- Booij, M.J., 2003. Determination and integration of appropriate spatial scales for river basin modelling. Hydrological Processes, 17 (13), 2581–2598. doi:10.1002/hyp.1268
- Booij, M.J., Schipper, T.C., and Marhaento, H., 2019. Attributing changes in streamflow to land use and climate change for 472 catchments in Australia and the United States. Water, 11 (5), 1059. doi:10.3390/w11051059
- Bruijnzeel, L.A., 1989. (De)forestation and dry season flow in the tropics: a closer look. Journal of Tropical Forest Science, 246 (4931), 229–243. doi:10.1126/science.246.4931.828
- Budyko, M.I., 1974. Climate and life, 508 pp. San Diego, Calif: Academic, 72–191.
- Congalton, R.G., 1991. A review of assessing the accuracy of classifications of remotely sensed data. Remote Sensing of Environment, 37 (1), 35–46. doi:10.1016/0034-4257(91)90048-B
- D’Almeida, C., et al., 2007. The effects of deforestation on the hydrological cycle in Amazonia: a review on scale and resolution. International Journal of Climatology, 27 (5), 633–647.
- DeFries, R. and Eshleman, N.K., 2004. Land-use change and hydrologic processes: a major focus for the future. Hydrological Processes, 18 (11), 2183–2186. doi:10.1002/hyp.5584
- FAO, 2004. Payment scheme for environmental services in watershed. Land and water discussion paper 3. Rome
- Fohrer, N., et al., 2001. Hydrologic response to land use changes on the catchment scale. Physics and Chemistry of the Earth, Part B: Hydrology, Oceans and Atmosphere, 26 (7), 577–582.
- Hidayat, H., 2008. Politik lingkungan: pengelolaan hutan masa Orde Baru dan reformasi. Jakarta, Indonesia: Yayasan Obor Indonesia.
- Hudson, P.F. and Colditz, R.R., 2003. Flood delineation in a large and complex alluvial valley, lower Panuco basin, Mexico. Journal of Hydrology, 280 (1), 229–245. doi:10.1016/S0022-1694(03)00227-0
- Hulme, M. and Sheard, N., 1999. Climate change scenarios for Indonesia. Norwich, UK: Climatic Research Unit, 6.
- Islam, R., et al., 2016. A review on mechanism of flood disaster management in Asia. International Review of Management and Marketing, 6 (1), 29–52.
- Khoi, D.N. and Suetsugi, T., 2014. The responses of hydrological processes and sediment yield to land-use and climate change in the Be river catchment, Vietnam. Hydrological Processes, 28 (3), 640–652. doi:10.1002/hyp.9620
- Lapeyre, R., Pirard, R., and Leimona, B., 2015. Payments for environmental services in Indonesia: what if economic signals were lost in translation? Land Use Policy, 46, 283–291. doi:10.1016/j.landusepol.2015.03.004
- Legesse, D., Vallet-Coulomb, C., and Gasse, F., 2003. Hydrological response of a catchment to climate and land use changes in tropical africa: case study south central Ethiopia. Journal of Hydrology, 275 (1−2), 67–85. doi:10.1016/S0022-1694(03)00019-2
- Marfai, M.A., et al., 2008. Natural hazards in Central Java Province, Indonesia: an overview. Environmental Geology, 56, 335–351. doi:10.1007/s00254-007-1169-9
- Margono, B.A., et al., 2014. Primary forest cover loss in Indonesia over 2000−2012. Nature Climate Change, 4 (8), 730–735. doi:10.1038/nclimate2277
- Marhaento, H., et al., 2017a. Attribution of changes in the water balance of a tropical catchment to land use change using the SWAT model. Hydrological Processes, 31 (11), 2029–2040. doi:10.1002/hyp.11167
- Marhaento, H., (2018). Effects of changes in land use and climate on water availability of a tropical catchment. (1 ed.). Ipskamp Printing. doi:10.3990/1.9789036544917
- Marhaento, H., et al., 2019. Sensitivity of streamflow characteristics to different spatial land-use configurations in tropical catchment. Journal of Water Resources Planning and Management, 145 (12), 04019054. doi:10.1061/(ASCE)WR.1943-5452.0001122
- Marhaento, H., Booij, M.J., and Hoekstra, A.Y., 2017b. Attribution of changes in stream flow to land use change and climate change in a mesoscale tropical catchment in Java, Indonesia. Hydrology Research, 48 (4), 1143–1155. doi:10.2166/nh.2016.110
- Marhaento, H., Booij, M.J., and Hoekstra, A.Y., 2018. Hydrological response to future land-use change and climate change in a tropical catchment. Hydrological Sciences Journal, 63 (9), 1368–1385. doi:10.1080/02626667.2018.1511054
- McCuen, R.H., 1989. Hydrologic analysis and design. Englewood Cliffs, NJ: Prentice-Hall, 143–147.
- Naylor, R.L., et al., 2007. Assessing risks of climate variability and climate change for Indonesian rice agriculture. Proceedings of the National Academy of Sciences, 104, 7752–7757. doi:10.1073/pnas.0701825104
- Nobre, C.A., et al., 2016. Land-use and climate change risks in the Amazon and the need of a novel sustainable development paradigm. Proceedings of the National Academy of Sciences, 113 (39), 10759–10768. doi:10.1073/pnas.1605516113
- Ota, T., et al., 2020. Sustainable financing for Payment for Ecosystem Services (PES) to conserve peat swamp forest through enterprises based on swiftlets’ nests: an awareness survey in Central Kalimantan, Indonesia. Small-scale Forestry, 19, 521–539. doi:10.1007/s11842-020-09452-7
- Paulhus, J.L.H. and Kohler, M.A., 1952. Interpolation of missing precipitation records. Monthly Weather Review, 80, 129–133. doi:10.1175/1520-0493(1952)080<0129:IOMPR>2.0.CO;2
- Renner, M., Seppelt, R., and Bernhofer, C., 2012. Evaluation of water-energy balance frameworks to predict the sensitivity of streamflow to climate change. Hydrology and Earth System Sciences, 16 (5), 1419–1433.
- Resosudarmo, B., et al., 2012. Forest land use dynamics in Indonesia. Working Paper No. 2012/01. Arndt Corden Department of Economics Crawford School of Economics and Government, ANU College of Asia and the Pacific.
- Rientjes, T.H.M., et al., 2011. Changes in land cover, rainfall and stream flow in upper gilgel abbay catchment, blue nile basin - ethiopia. Hydrology and Earth System Sciences, 15 (6), 1979–1989. doi:10.5194/hess-15-1979-2011
- Romanowicz, R.J. and Booij, M.J., 2011. Editorial – impact of land use and water management on hydrological processes under varying climatic conditions. Physics and Chemistry of the Earth, 36, 613–614. doi:10.1016/j.pce.2010.03.027
- Romshoo, S.A., Bhat, S.A., and Rashid, I., 2012. Geoinformatics for assessing the morphometric control on hydrological response at watershed scale in the Upper Indus Basin. Journal of Earth System Science, 121 (3), 659–686. doi:10.1007/s12040-012-0192-8
- Rukmana, M.A., Fariza, A., and Hasim, J.A.N., 2016. Flood disaster risk system at bengawan solo river in east java region using fuzzy method. In 2016 International Electronics Symposium (IES). IEEE, 510–515. Denpasar, Indonesia.
- Sen, P.K., 1968. Estimates of the regression coefficient based on Kendall’s tau. Journal of the American Statistical Association, 63 (324), 1379–1389. doi:10.1080/01621459.1968.10480934
- Shi, P., et al., 2013. Effects of land-use and climate change on hydrological processes in the upstream of huai river, china. Water Resources Management, 27 (5), 1263–1278. doi:10.1007/s11269-012-0237-4
- Southgate, D. and Wunder, S., 2009. Paying for watershed services in latin america: a review of current initiatives. Journal of Sustainable Forestry, 28 (3−5), 497–524. doi:10.1080/10549810902794493
- Subarna, D., et al., 2014. The relationship between monthly rainfall and elevation in the cisangkuy watershed bandung regency. International Journal of Latest Research in Science and Technology, 3 (2), 55–60.
- Syaukat, Y., 2011. The impact of climate change on food production and security and its adaptation programs in Indonesia. Journal of the International Society for Southeast Asian Agricultural Sciences, 17, 40–51.
- Thiessen, A.H., 1911. Precipitation averages for large areas. Monthly Weather Review, 39, 1082–1089. doi:10.1175/15200493(1911)39<1082b:PAFLA>2.0.CO;2
- Tomer, M.D. and Schilling, K.E., 2009. A simple approach to distinguish land-use and climate-change effects on watershed hydrology. Journal of Hydrology, 376 (1−2), 24–33. doi:10.1016/j.jhydrol.2009.07.029
- Tung, Y., 1983. Point rainfall estimation for a mountainous region. Journal of Hydraulic Engineering - ASCE, 109 (10), 1386–1396. doi:10.1061/(ASCE)0733-9429(1983)109:10(1386)
- Van Dijk, A.I.J.M., et al., 2007. Reforestation, water availability and stream salinity: a multi-scale analysis in the murray-darling basin, australia. Forest Ecology and Management, 251 (1−2), 94–109. doi:10.1016/j.foreco.2007.06.012
- Verburg, P.H. and Bouma, J., 1999. Land use change under conditions of high population pressure: the case of Java. Global Environmental Change, 9, 303–312. doi:10.1016/S0959-3780(99)00175-2
- Wittenberg, H., 1994. Nonlinear analysis of flow recession curves. IAHS Publications-Series of Proceedings and Reports-Intern Assoc Hydrological Sciences, 221, 61–68.
- Wohl, E., et al., 2012. The hydrology of the humid tropics. Nature Climate Change, 2 (9), 655–662. doi:10.1038/nclimate1556
- Wulder, M.A., et al., 2008. Landsat continuity: issues and opportunities for land cover monitoring. Remote Sensing of Environment, 112 (3), 955–969. doi:10.1016/j.rse.2007.07.004
- Zhang, L., et al., 2016. Hydrological impacts of land use change and climate variability in the headwater region of the Heihe River Basin, Northwest China. PLoS One, 11, e0158394. doi:10.1371/journal.pone.0158394
- Zhang, M., et al., 2012. The effect of forest harvesting and climatic variability on runoff in a large watershed: the case study in the upper minjiang river of yangtze river basin. Journal of Hydrology, 464−465, 1–11.
- Zhang, X., et al., 2008. Responses of streamflow to changes in climate and land use/cover in the loess plateau, china. Water Resources Research, 45 (7), 1–12.
- Zhang, Y., et al., 2014. Impacts of climate change and land use change on runoff of forest catchment in northeast china. Hydrological Processes, 28 (2), 186–196. doi:10.1002/hyp.9564