
 ?Mathematical formulae have been encoded as MathML and are displayed in this HTML version using MathJax in order to improve their display. Uncheck the box to turn MathJax off. This feature requires Javascript. Click on a formula to zoom.
ABSTRACT
This paper investigates climate change impacts on the hydrology and water quality of Brazilian semi-arid reservoirs. An integrated approach coupling climate, hydrological and water quality models was proposed. Five general circulation models (GCMs) and two future scenarios (SSP2-4.5 and SSP5-8.5) were used for the projections. The simulations showed that uncertainty in climate forecast significantly impacted hydrological and water quality outputs. Some scenarios revealed a strong decrease in streamflow and storage volume. On the other hand, 40% of multi-GCM projections indicated reservoir eutrophication. The impacts on hydrology and water quality under SSP5-8.5 were more significant than those under SSP2-4.5. The results also indicated that drought events may be prolonged under climate change, principally at the end of the 21st century for SSP5-8.5, and may significantly increase the total phosphorus concentration. This suggests that tropical semi-arid reservoirs could be more vulnerable to eutrophication in scenarios of climate change than those in other regions.
1 Introduction
Water shortage and water pollution have impacted negatively on the water resources of Northeast Brazil (NEB), causing major harm to the population and regional development. For instance, in the Brazilian state of Ceará, the current storage percentage of the 155 reservoirs monitored by the Water Resources Management Company of Ceará (COGERH) is only about 30%, and 92 of the 127 qualitatively monitored reservoirs are already eutrophic (COGERH Citation2020). On the other hand, the Middle Jaguaribe sub-basin, the focus of the present study, only treats 33% of its sewage (COGERH Citation2011), a value close to that of NEB (36%) (National Sanitation Information System (SNIS) Citation2019).
The nutrient inputs from untreated sewage, agricultural practices and livestock farming are mostly responsible for the eutrophication of the water bodies (du Plessis et al. Citation2015, Klippel et al. Citation2020). Eutrophication may favour cyanobacteria blooms, which could have a negative effect on the aquatic ecosystem, water treatment and the population’s health (Carvalho et al. Citation2013, Pacheco and Lima Neto Citation2017, Lima et al. Citation2018).
Droughts that periodically affect NEB and high evaporation rates (Campos Citation2015) are responsible for gradual declines in the storage volume of the Brazilian semi-arid reservoirs (Braga et al. Citation2015). Moreover, due to the intermittent river regime in NEB, in the dry seasons, essentially untreated sewage is transported to the reservoirs (Araújo et al. Citation2019, Fraga et al. Citation2020, Mesquita et al. Citation2020). In this respect, the water quality in lakes and reservoirs in semi-arid areas can be particularly sensitive to the effects of the hydroclimatic variability, since the water quality is closely linked to the streamflow and storage volume of such water bodies (Chaves et al. Citation2013, Santos et al. Citation2014, Paula Filho et al. Citation2019, Wiegand et al. Citation2021).
In this context, climate change can affect the water quality of NEB reservoirs more drastically (Rocha Junior et al. Citation2018, Lisboa et al. Citation2020). However, all studies of the impacts on climate change in the NEB and, more specifically, in the Jaguaribe River basin, have concentrated only on quantitative aspects of the water resources (e.g. Gondim et al. Citation2012, Citation2018, Fernandes et al. Citation2017, Silveira et al. Citation2017, Tiezzi et al. Citation2019). This scarcity of studies on the qualitative nature of water resources in the region is a concern since several studies around the world have shown that climate change can have adverse effects on the water quality in water bodies and can intensify many forms of water pollution (e.g. Couture et al. Citation2014, Citation2018, Bucak Citation2018, Me et al. Citation2018, Zhang et al. Citation2019). Therefore, to ensure the supply of good-quality water for future generations, it is important to assess the impacts of climate change on water quality. This context is one reason why this study is necessary and able to offer valuable contributions to the NEB.
Phosphorus is considered the limiting nutrient of eutrophication of inland water bodies (Chapra Citation2008), and the control of cyanobacterial blooms and other symptoms of eutrophication depends primarily on the reduction of phosphorus inputs (Schindler et al. Citation2016). Hence, several studies have considered the total phosphorus (TP) concentration as a variable representing the water quality to investigate the phenomenon of eutrophication in lakes and reservoirs around the world (Lima et al. Citation2018, Nazari-Sharabian et al. Citation2019, Rocha et al. Citation2019, Zhang et al. Citation2019, Moura et al. Citation2020). In addition, for reservoirs in the tropical semi-arid region, eutrophication is strongly related to gradual reductions in the stored volume (Rocha Junior et al. Citation2018), high temperatures (Toné and Lima Neto Citation2020), daily stratification (Lima Neto Citation2019) and seasonality of the streamflow (Araújo et al. Citation2019), characteristics that can be used to describe the water quality of reservoirs in the region using the TP concentration. In this sense, the complete mixing model proposed by Vollenweider (Organisation for Economic Co-operation and Development (OECD) Citation1968) and its derivations have been successfully applied to estimate the TP concentration of lakes and reservoirs (Nielsen et al. Citation2013, Molina-Navarro et al. Citation2014, Trolle et al. Citation2015, Lira et al. Citation2020, Mesquita et al. Citation2020).
The prime purpose of this study was to assess the impact of climate change on water quality in the Castanhão reservoir, which is located in the semi-arid region of the Brazilian state of Ceará, and is considered the largest multi-use reservoir of Latin America. The impacts on the streamflow and water level in the reservoir were also investigated. The study included the integration of five different general circulation models (GCMs), a hydrological model and a water quality model to forecast the future trophic status of the reservoir. The effects of two emission scenarios were assessed on the trophic status in three future periods.
2 Materials and methods
2.1 Study area
The Brazilian state of Ceará is located in NEB (), and more than 90% of its territory is located in the country’s semi-arid region (Pontes Filho et al. Citation2020). Ceará, including the entire Northeastern region, is marked by extreme climate events, including periodic droughts and sporadic flooding. The inter-annual variability is high due to the El Niño-Southern Oscillation (ENSO; Luiz Silva et al. Citation2021). The main active meteorological system is the Intertropical Convergence Zone (ITCZ), responsible for the state’s rainy season, between February and May (Gondim et al. Citation2018). There are two other operating systems, albeit these are less relevant: cold fronts and cyclonic eddies, responsible for the pre-rainy season (December–January); and the easterly waves, responsible for the post-rainy season (June–July) (Cavalcanti et al. Citation2011, Gomes et al. Citation2015). Generally speaking, however, the year has two very different seasons; one wet, from February to May, with around 75% of the annual rain falling in this season; and the other dry, during the remaining months (Campos et al. 2014). As a result, a strategy has been adopted to build reservoirs distributed over the state territory to store water in the wet season and rainy years in order to meet water requirements in the dry season and drought years (Campos Citation2015).
Figure 1. Map of Castanhão reservoir in the sub-basin of the Middle Jaguaribe River, State of Ceará, Brazil
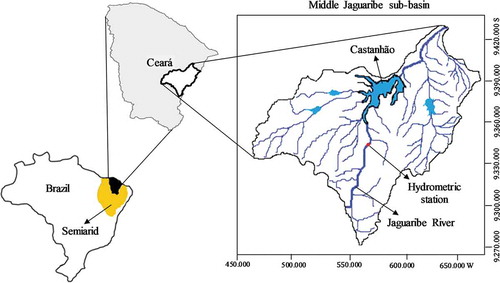
Castanhão reservoir (6700 hm3), located in the Ceará municipality of Alto Santo and the largest multi-use reservoir of Latin America, lies within the Jaguaribe River basin, well known for its vast expanse covering practically half of the Ceará territory (72 645 km2, 48% of the total area of the state). The Jaguaribe River, which is the main water supply of the basin, stretches for 610 km from its source to where it drains into the Atlantic Ocean. The Jaguaribe River basin is divided into five sub-basins: Upper, Middle and Lower Jaguaribe, Salgado and Banabuiú. Castanhão reservoir is part of the Middle Jaguaribe sub-basin. This sub-basin, together with its tributaries, is located in the eastern part of Ceará State and covers an area of around 10 355 km2 (13% of Ceará territory), with the River Jaguaribe being the largest river in this sub-basin (). The climate of this sub-basin has semi-arid characteristics, with an annual average temperature of 28°C and annual average rainfall of approximately 700 mm. The association of the high concentration of the rainfall system in 4 months of the year (75% of total rainfall) with the crystalline soil covering more than 80% of the basin results in the intermittence of the Jaguaribe River (Campos et al. 2014).
Located upstream of Castanhão, in the Upper Jaguaribe River Basin, the Orós is the second largest multi-use reservoir (1940 hm3) in the state of Ceará (see Lima Neto et al. Citation2011). This reservoir was also included in the analysis of the present study for purposes of comparison with the Castanhão reservoir.
2.2 Modelling
In this study, a combined approach of climate, hydrological and water quality models was adopted to characterize the Castanhão reservoir water quality under climate change scenarios. After calibrating and validating the SMAP hydrological model, future streamflow of the reservoir was projected under SSP2-4.5 and SSP5-8.5, using climate projections of CMIP 5 models, viz. BCC-CM6A-LR, CanESM5, IPSL-CM6A-302 LR, MIROC6 and MRI-ESM2-0. The nutrient load was simulated, using a correlation between the reservoir’s inflow and the TP concentration at the reservoir’s inlet. The land use of the sub-basin was considered unaltered in the modelling process. The future volume of the reservoir was calculated from its water balance. These two variables (streamflow and storage volume) were the main input data for the empirical Vollenweider model OECD Citation1968), applied in this study to determine the reservoir’s water quality. The average TP concentration within the reservoir was used as a water quality status for the three future periods (2015–2044, 2045–2074 and 2075–2100). The water quality data-logging period, 2008–2014, was used as the baseline. The transient version of the model was used, also considering the high water-level variability of the reservoir. According to the future TP concentrations, the reservoir’s trophic status was classified for each of the three future periods investigated to assess the possible eutrophication of the reservoir in response to climate change.
2.3 SMAP hydrological model
2.3.1 Model structure
The hydrological model to be used in this research is the monthly version of SMAP, initially developed by Lopes et al. (Citation1982) and recently described by Fernadez Bou et al. (2015). The SMAP has been successfully applied to a number of Brazilian basins (Block et al. Citation2009, Kwon et al. Citation2012, Fernández Bou et al. Citation2015, Silveira et al. Citation2017, Da Silva et al. Citation2018, Gondim et al. Citation2018, Tiezzi et al. Citation2019, De Paiva et al. Citation2020, Silva et al. Citation2021). This is a rainflow hydrological simulation model, classified also as deterministic, conceptual and with lumped structure. The monthly version of SMAP contains two linear reservoirs (soil reservoir, ; and groundwater,
) and four parameters: soil storage capacity (SAT) in mm; surface flow parameter (
), dimensionless; recharge coefficient (
), dimensionless, and base flow recession coefficient (K) in a month. The separation between rainfall and surface runoff is based on the Soil Conservation Service (SCS) equation. represents the model’s structure with its two linear reservoirs.
Figure 2. Conceptual illustration of the SMAP hydrological model used in this study (Kwon et al. Citation2012)
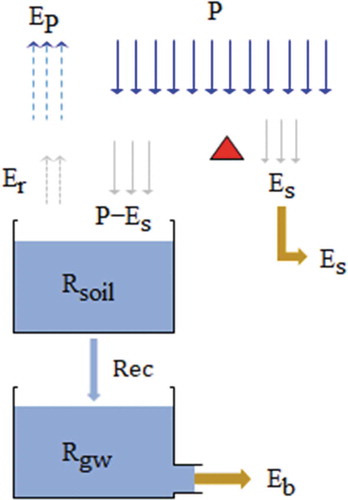
Further details on the operation of the SMAP hydrological model can be found in Lopes et al. (Citation1982), Kwon et al. (Citation2012) and Silva et al. (Citation2021).
2.3.2 Calibration and validation
The SMAP calibration process consisted of optimizing the SAT, Kes, Crec and K parameters with the Nash-Sutcliffe (NS) efficiency coefficient as an objective function. In addition, another two metrics were calculated to supplement the statistical evaluation of the SMAP, namely Pearson’s correlation coefficient (Correl) and the determination coefficient (R2) (Moriasi et al. Citation2007).
The periods 1981–1995 and 1996–2010 were used for calibration and validation, respectively. Streamflow data were collected from the Brazilian National Water Agency (ANA) website (http://www.snirh.gov.br/). The precipitation data from the stations with influence on the Middle Jaguaribe sub-basin were obtained from the Ceará State Foundation for Meteorology and Water Resources (FUNCEME) (http://www.funceme.br/). The average monthly rainfall in the sub-basin was calculated based on the Thiessen method, while the Climate Normal of the potential evapotranspiration was provided by the National Institute of Meteorology (INMET) (http://www.inmet.gov.br/).
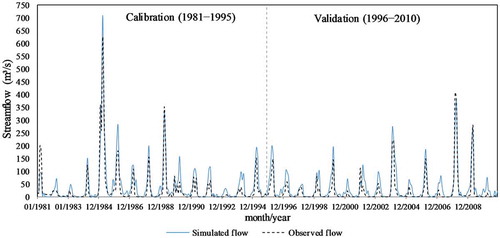
shows the results of the calibration and validation of the SMAP for Castanhão reservoir. The SMAP satisfactorily reproduced the streamflow pattern, presenting a superior performance in the model’s validation period. The calibration provided the following statistics: Correl = 0.92; R2 = 0.85 and NS = 0.80. In turn, for validation, the statistics were: Correl = 0.93; R2 = 0.86 and NS = 0.77. According to the criteria set by Moriasi et al. (Citation2007) for assessing the performance of models in the calibration and validation processes, an NS value between 0.50 and 0.65 is considered “satisfactory,” a value between 0.65 and 0.75 is characterized as “good,” and a value between 0.75 and 1.0 is considered “very good.” Therefore, the calibration and validation fell into the very good category. Furthermore, Zhang et al. (Citation2019) consider R2 > 0.5 to be a suitable value for hydrological modelling.
Figure 3. Calibration and validation of the SMAP model for Castanhão reservoir
2.4 Scenarios of climate change
In this study, five GCMs (BCC-CM6A-LR, CanESM5, IPSL-CM6A-LR, MIROC6 and MRI-ESM2-0) of the Coupled Model Intercomparison Project 6 (CMIP6) (website: https://esgf-node.llnl.gov/search/cmip6/) were used. These climate models were forced by the SSP2-4.5 and SSP5-8.5 scenarios in order to obtain future rainfall and temperature values. The SSP5-8.5 was chosen because it represents the most pessimistic scenario of greenhouse gas emissions, while SSP2-4.5 was chosen because it assumes that the levels of greenhouse gas emissions will be maintained (O’Neill et al. Citation2014). The projections of the climatic variables (precipitation and temperature) were interpolated from GCMs grids to the basin area. A bias was corrected using the cumulative density function (CDF) with gamma distribution. The observed data came from the Climatic Research Unit (CRU) for the period 1971–2000 and the GCM outputs from the hindcasts for this same period. The methodologies adopted were similar to those used by Block et al. (Citation2009) and Gondim et al. (Citation2018) for the statistical corrections of precipitation and temperature, respectively, and more details on the procedures can be found in those sources. Future projections of precipitation and temperature were made for three periods: 2015–2044, 2045–2074 and 2075–2100. The same bias-correction used in historical projections was used for future climatic projections. Potential evapotranspiration in future conditions was calculated from corrected temperature using the Hargreaves-Samani (HS) method (Hargreaves and Samani Citation1985). After this step, the climate variable projections (precipitation and potential evapotranspiration) were used to run the SMAP model for the periods 2015–2044, 2045–2074 and 2075–2100, to simulate the Castanhão future streamflow.
2.5 Water balance and water level
The future water level of the Castanhão reservoir under climate change scenarios was determined from its water balance. The reservoir’s outflow was considered with its regularized streamflow. The regulated flow is defined as the streamflow to the reservoir with 90% reliability (Campos et al. Citation2016). The water loss from the reservoir’s surface was considered the product of the difference between evaporation and direct precipitation and the reservoir area, relating to the net surface. The expression governing the water balance of reservoir is as follows (Campos et al. 2014).
where i + 1 (T) and i (T) refer to present and past time, respectively; V (L3) is the water volume; (L3T−) denotes the total reservoir withdrawals; EL (LT−) is the average water loss from the reservoir; A (L2) represents the reservoir’s net surface area, and S (L3T−) is the reservoir’s outflow through the spillway.
The value of the regularized streamflow (30.21 m3/s) and the depth-area-volume (DAV) curve were obtained from COGERH (http://www.hidro.ce.gov.br/). The monthly net evaporation vector of Castanhão reservoir was procured from a study by ANA (Citation2017) on the Brazilian semi-arid reservoir region.
A useful ratio to assess the water level in lakes and reservoirs is the percent volume, defined as the ratio between the reservoir’s storage volume and its maximum volume. This ratio is described mathematically below:
where is the percentage of maximum storage volume of the reservoir (here termed percent volume of the reservoir) (%) and
(L3) is the maximum volume of the reservoir.
2.6 The reservoir water quality model
The impacts of climate change on the water quality of Castanhão reservoir were estimated using the empirical Vollenweider model (OECD Citation1968), but with adjustments suggested by Chapra (Citation2008). The expression below (EquationEquation 3(3)
(3) ) was used satisfactorily by Lira et al. (Citation2020) to consider the variation in volume, since the Brazilian semi-arid reservoirs vary widely in water level, in response to the spatial and temporal variability of rainfall and the effects of periodic droughts:
where TP is the annual average total phosphorus concentration in the reservoir (ML−3); is the influent TP concentration in the reservoir (ML−3); k is the settling loss coefficient of TP (T−); and
(L3T−) is the outflow from the reservoir. It is worth mentioning that the outflow represents all forms of water removal from the reservoir that can together carry the phosphorus, namely withdrawals, spill and groundwater flow (Chapra Citation2008). However, water loss from the reservoir through groundwater was ignored (Campos et al. Citation2016, Mesquita et al. Citation2020).
An intrinsic problem for the reservoirs in tropical semi-arid regions is the higher temperatures (~30°C) affecting the rate of consumption of phosphorus by biological activity and the water’s viscosity, facilitating the sedimentation process of this nutrient (Castagnino Citation1982). As a result, this study used EquationEquation (4)(4)
(4) , proposed by Toné and Lima Neto (Citation2020), to consider the characteristics of the tropical semi-arid climate on the TP settling loss coefficient. This empirical formula is a correction of the expressions proposed by Vollenweider (OECD Citation1968) and Salas and Martino (Citation1991), which were developed for reservoirs in a temperate (~10°C) and tropical (~20°C) climate, respectively:
where is the hydraulic residence time (T), representing the time necessary for the reservoir water to be renewed, defined here as the ratio between the reservoir’s volume (L3) and the inflow (L3T−). This simple approach to estimate
demonstrates a good accuracy for relatively well-mixed lakes (Pilotti et al. Citation2014). Consistently, Brazilian semi-arid reservoirs present very weak stratification contrasts from top to bottom (up to about 1–4°C), that are destroyed on a daily cycle (see Lima Neto Citation2019, Mesquita et al. Citation2020). It is also important to observe that EquationEquation (4)
(4)
(4) was adjusted and validated by Toné and Lima Neto (Citation2020) for a wide range of Brazilian semi-arid reservoirs. Additionally, it was also validated by Lima (Citation2016) and Araújo et al. (Citation2019) for reservoirs located specifically in the state of Ceará.
Because there was little data on the influent TP concentration of Castanhão, the correlation proposed by Rocha and Lima Neto (Citation2020) was used, described by EquationEquation (5)(5)
(5) , which relates the TP concentration and the streamflow of Castanhão. The data used to adjust the formula were related to the period 2012–2017.
EquationEquation (5)(5)
(5) requires the streamflow to be in m3/s, thus presenting the influent TP concentration in mg/L. It was also necessary to restrict the domain of the expression in order to properly represent the physics of the phenomenon. So, a minimum value of 0.1 m3/s was considered, which corresponds to a maximum influent TP concentration of about 100 mg/L.
In this study, the trophic status classification used was based on the average TP concentration (); that is, it is the same system as that adopted by COGERH for their monitored reservoirs (Toledo et al. Citation1983, Klippel et al. Citation2020).
Table 1. Classification of trophic level based on the average total phosphorus (TP) concentration
3 Results
3.1 Alterations to the reservoir’s streamflow
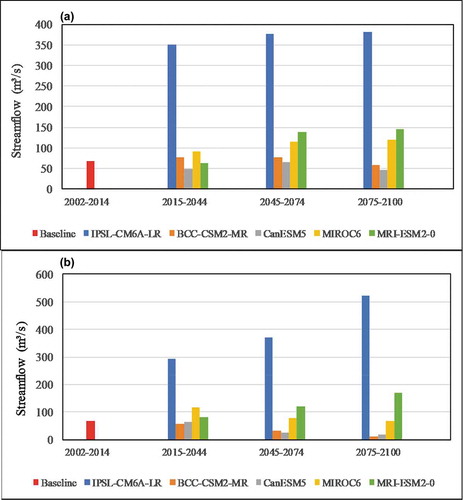
Future average streamflow was projected using the SMAP model and datasets of five GCMs. shows the average streamflow for the baseline (2002–2014) and climate change conditions. The streamflow of Castanhão reservoir for the baseline was 67.80 m3/s. SSP5-8.5 displayed a stronger effect in terms of the relative changes of the streamflow compared to SSP2-4.5. SSP2-4.5 projected relative changes varying from −29% to 416% in the period 2015–2044, with the CanESM5 and MRI-ESM2-0 models showing the largest reductions. In the second period, for this same emission scenario, all climate models except CanESM5 projected an increase in the average streamflow, with relative changes varying from 12% to 456%. In the last period, CanESM5 predicted a drop of −16% in relation to the baseline streamflow, while all other models projected positive relative changes, varying from 4% to 462%. For SSP5-8.5, BCC-CSM2-MR and CanESM5 predicted relative changes of −15% and −9%, respectively, during the 2015–2044 period, while the other three climate models forecast relative changes varying from 20% to 332%. For the period 2045–2074, IPSL-CM6A-LR, MIROC6 and MRI-ESM2-0 predicted an increase in the average streamflow, with relative changes varying from 15% and 449%, while BCC-CSM2-MR and CanESM5 projected decreases of −56% and −64%, respectively. In the period 2075–2100, the majority of the climate models predicted an increase in the average streamflow in relation to the baseline, with relative changes varying from 24% to 847%. However, BCC-CSM2-MR and CanESM5 projected significant drops in the average streamflow. The former predicted a drop of −84% and the latter a drop of −67%.
Figure 4. Average streamflow for conditions of baseline and climate change for (a) SSP2-4.5 and (b) SSP5-8.5 simulated by five different GCMs for the periods 2015–2044, 2045–2074 and 2075–2100
3.2 Effects on water balance and water level
The baseline percent volume was 55.10% (mean value of the reservoir for 2002–2014). No consistent trend was seen in the future projections of water level under SSP2-4.5 or SSP5-8.5 (). The maximum relative changes were similar in the two SSPs-RCPs, but SSP5-8.5 displayed more sharply negative relative changes. In SSP2-4.5, all GCMs except CanESM5 predicted a rise in the average percent volume of the reservoir in relation to the baseline in the three future periods. The positive relative changes varied from 3% to 76%, while CanESM5 projected decreases of −34%, −24% and −5% in the first, second and third period, respectively. For SSP5-8.5, in the period 2015–2044 the projections indicated an increase in the average percent volume of the reservoir varying from 2% to 42% in relation to the baseline. In the last two periods, most of the GCMs indicated an increase in the percent volume of the reservoir, but BCC-CSM2-MR and CanESM5 predicted significant reductions. The former model predicted a −48% decline in 2045–2074 and a −97% decline in 2075–2100, while the latter model predicted drops of −69% and −76% in the first and second period, respectively.
Figure 5. Relative change in percent volume of the reservoir for five different GCMs for 2015–2044, 2045–2074 and 2075–2100 for (a) SSP2-4.5 and (b) SSP5-8.5
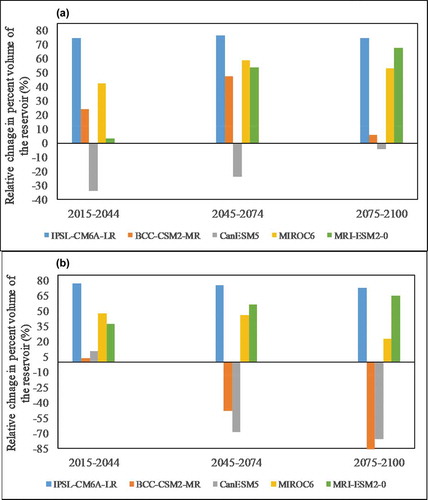
shows the average volume of the reservoir together with the representative average streamflow for the future periods assessed under the SSP2-4.5 and SSP5-8.5 scenarios. It was possible to infer that the drop in the percent volume of Castanhão was related to the decrease in the reservoir’s streamflow (). The most pessimistic scenarios associated percent volumes of the reservoir lower than 20% and annual average streamflow with decreases of more than 50% in relation to the baseline. Consistent with this, the CanESM5 model showed significant reductions in percent volume, and the BCC-CSM2-MR model predicted a higher possibility of prolonged drought in response to the reductions in the average streamflow. Furthermore, higher projections of the average streamflow than the baseline flow indicated an average percent volume above the baseline, with emphasis on IPSL-CM6A-LR, which predicted storage volumes close to the maximum volume of the reservoir, regardless of the period and emission scenario.
Figure 6. Relation between the percent volume and the streamflow forecast for Castanhão reservoir in climate change conditions for five different GCMs, considering scenarios SSP2-4.5 and SSP5-8.5 and periods 2015–2044, 2045–2074 and 2074–2100
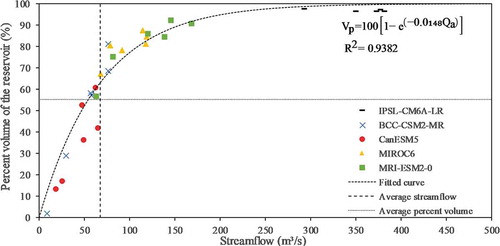
From a visual inspection of the results illustrated in , a characteristic mathematical behaviour was identified, with a percent volume increasing exponentially in one region, and another showing asymptotic behaviour. Thus, it adapted well to the monomolecular model, considering a parameterization using a half-life concept of time, since it had a more convenient interpretation when approaching the maximum percent volume (100%). Thus, in order to provide information regarding the impact of climate change on the percent volume of Castanhão reservoir based on predicted streamflow, an expression was proposed that relates such variables [EquationEquation (6)(6)
(6) , p < 0.05], encompassing the five different climate models, the two emission scenarios and the three assessed future periods:
The monomolecular model parameters were determined using the method of ordinary least squares (OLS), considering the streamflow projections by the five different GCMs and the streamflow of the proposed model. The curve adjusted well to the data, as indicated by the high value of R2 (0.94).
3.3 Response of TP concentration to climate change scenarios
3.3.1 Relative change in TP concentration in the reservoir
The future projection values of the average TP concentration in the Castanhão reservoir were compared with the concentration (0.034 mg/L) during the 2008–2014 period, since the water quality records in the reservoir were only available for this period. Most GCMs indicated that the average TP concentration tends to increase (). Also, divergences were found in the projections of the average TP concentrations, both in magnitude (absolute values of relative change) and in sign (upward or downward trend). SSP5-8.5 projected a larger quantity of relative maximum variations of the average TP concentration than did the SSP2-4.5.
Figure 7. Relative change in average total phosphorus (TP) concentration in the reservoir for five different GCMs for (a) SSP2-4.5 and (b) SSP5-8.5 for periods 2015–2044, 2045–2074 and 2075–2100
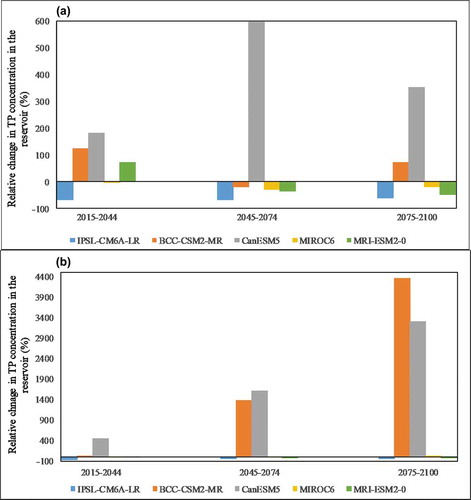
Under the SSP2-4.5, two GCMs indicated negative relative changes in the average TP concentration during the 2015–2044 period, while the other climate models predicted positive relative changes. In the period 2045–2074, all GCMs except CanESM5 indicated negative relative changes, varying from −67% to −19%. In the period 2075–2100, the MIROC6, MRI-ESM2-0 and IPSL-CM6A-LR models predicted negative relative changes, while the BCC-CSM2-MR and CanESM5 models predicted positive relative changes. In SSP5-8.5, BCC-CSM2-MR and CanESM5 predicted relative changes of 29% and 453%, respectively, in the period 2015–2044. In turn, MRI-ESM2-0, MIROC6 and IPSL-CM6A-LR predicted relative changes of −14%, −23% and −69%, respectively. In 2045–2074, significant increases were detected in the average TP concentration predicted from BCC-CSM2-MR and CanESM5. The other three GCMs predicted negative relative changes for this same period. In the last period, MRI-ESM2-0 and IPSL-CM6A-LR predicted relative changes of −45% and −57%, respectively. The other three GCMs predicted an upward trend of the TP concentration, where the BCC-CSM2-MR and CanESM5 models indicated a strong degradation of the water quality.
3.3.2 Trophic status of the reservoir in climate change scenarios
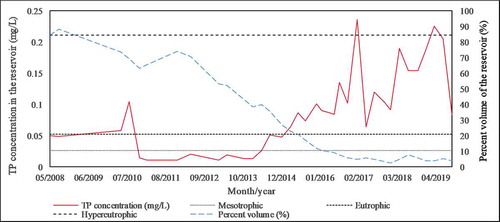
The combined behaviour of the percent volume and the TP concentration of Castanhão reservoir in the period from 2008 to 2019 is illustrated in . The TP concentration showed considerable variability, but it was possible to identify an upward trend in the reservoir’s TP concentration over the years. The increase in TP concentration seemed to be in response to the drop in the reservoir volume, clearly based on a percent volume of around 20%. The linear regression analysis pointed in this direction, with a relatively high correlation value (r = −0.67). Consistent with this, in general the smaller volumes generated the largest TP concentrations, intensifying the trophic status of the reservoir and the eutrophication process as time went by. The annual average rate of increase in the TP concentration was 0.022 mg/L.
Figure 8. Relation between the average total phosphorus (TP) concentration and percent volume of Castanhão reservoir for the sampled period (2008–2019)
Based on TP concentrations, Castanhão reservoir was classified as hypereutrophic in the baseline period (2008–2014). In the climate change scenarios, the trophic status varied between oligotrophic and hypereutrophic (). SSP5-8.5 predicted further degradation of the water quality compared to SSP2-4.5, the latest period being the most pessimistic for the reservoir’s water quality. Analyses revealed that around 40% of the average TP concentrations in the three periods studied were contained either in the eutrophic status or the hypereutrophic status, indicating the reservoir’s eutrophication. The CanESM5 model predicted eutrophic status for the two SSPs-RCPs and three future periods. The BCC-CSM2-MR model projected eutrophication for all periods under SSP5-8.5, but in the first period only under SSP2-4.5. In contrast, the MRI-ESM2-0 model only projected eutrophication in the first period under SSP2-4.5. In other cases, the projections indicated oligotrophic or mesotrophic status.
Figure 9. Projection of the representative average total phosphorus (TP) concentration (represents the three assessed periods from five different GCMs for Castanhão reservoir). The periods 2015–2044, 2045–2074 and 2075–2100 are represented by the Arabic numerals 1, 2 and 3, respectively, while SSP2-4.5 and SSP5-8.5 are represented by the Roman numerals I and II, respectively
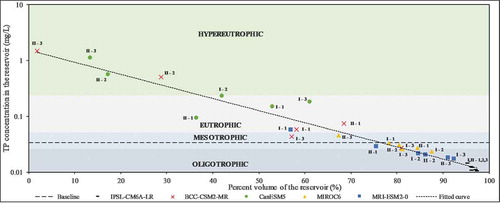
For climate forecasts, the linear regression analysis showed that the average TP concentration in Castanhão reservoir was related negatively to the percent volume (R2 = 0.94). This result indicated that the drop in percent volume, due to the effect of prolonged droughts, exacerbated by climate change, intensified the reservoir’s trophic status, thereby increasing the possibility of eutrophication. Specifically, the highest average TP concentrations (>0.572 mg/L) were associated with percent volumes below 20% (compatible with the pattern observed in ), while the maximum concentration (1.5 mg/L) was related to a percent volume of almost 0%. The inverse effect was also noted: the smaller average TP concentrations were related to high percent volumes (70%), such as the IPSL-CM6A-LR model projecting the smaller average TP concentrations.
Another expression [EquationEquation (7)(7)
(7) , p < 0.05] was proposed relating the TP concentration and percent volume for Castanhão reservoir, based on the best adjustment to the data, which could help decision makers in managing the impacts of climate change on the water quality of reservoir from its percent volume.
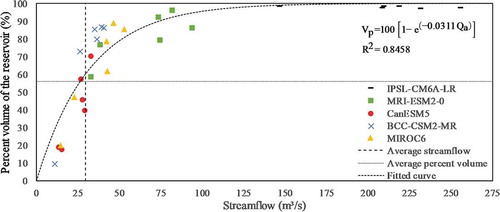
As a comparison, shows the relation between the streamflow and percent volume for another reservoir in Ceará (Orós). The purpose was to show the response of the percent volume to the projected streamflow, and the applicability of the procedure to generate the expression that relates these two variables, as an aid to decision makers. The same procedures that were applied to the Castanhão reservoir were used here, both for building the graphic result and for the concept of the expression. It is possible to also identify a clear relationship between the streamflow and percent volume of Orós reservoir, with similar graphic behaviour to that shown in . The proposed expression for Orós reservoir satisfactorily represented the data, but with a lower determination coefficient than that for the Castanhão reservoir (R2 = 0.85).
Figure 10. Relation between the percent volume and the streamflow forecast for Orós reservoir in climate change conditions for five different GCMs, considering scenarios SSP2-4.5 and SSP5-8.5 and periods 2015–2044, 2045–2074 and 2074–2100
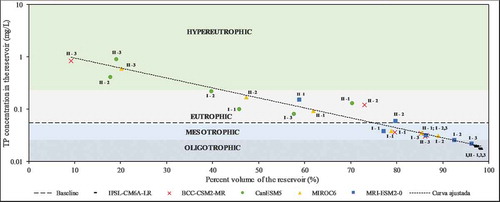
From , it was possible to also identify an increase in the TP concentration in Orós reservoir in response to the decrease in storage volume, reflected by a high value of the determination coefficient (R2 = 0.96). The expression created based on the best adjustment of the future data of percent volume and TP concentration also had exponential behaviour. The findings for Orós reservoir reinforce that the reservoirs in the Brazil semi-arid region can be more prone to the impacts of climate change. Moreover, the results relating to Castanhão and Orós reservoirs suggest that the impacts of climate change on the reservoirs in the Jaguaribe River basin are similar, so it would be possible to jointly manage the impacts of climate change on the reservoirs in this region, extending the mitigating measures to all water bodies in the catchment area.
Figure 11. Projection of the representative average total phosphorus (TP) concentration (represents the three assessed periods from five different GCMs for Orós reservoir). The periods 2015–2044, 2045–2074 and 2075–2100 are represented by the Arabic numerals 1, 2 and 3, respectively, while the SSP2-4.5 and SSP5-8.5 are represented by the Roman numerals I and II, respectively
4 Discussion
This present study investigated the impacts of climate change on the hydrology and water quality of a large strategic reservoir (Castanhão) in Brazil’s semi-arid region. Also, we discussed the increased eutrophication of tropical semi-arid reservoirs as a result of gradual decreases in the storage volume – namely, prolonged drought events. To project the future trophic status of Castanhão reservoir, five climate models were connected to the SMAP hydrological model, the outputs of which supplied the water balance equation and a complete mixing model to estimate the internal TP concentration under climate change scenarios.
4.1 Effects on the reservoir’s streamflow
Strong divergences were noted in the streamflow projections for the five climate models under climate change scenarios. The observed divergences in sign and magnitude varied from −87% to 670% (). The uncertainties for the streamflow agreed with the results of projections made for the Jaguaribe River basin (Krol and Bronstert Citation2007, Gondim et al. Citation2012, Citation2018). Fernandes et al. (Citation2017) predicted streamflow variations from −70% to 110% over the periods 2040–2069 and 2070–2099. More recently, Estácio (Citation2020) predicted relative changes varying from −75% to 400%, for the same reservoir as this study, during the 2025–2055 period.
Studies in other NEB regions have also presented divergences in future streamflow projections (Tiezzi et al. 2018, Silva et al. Citation2021). Silveira et al. (2016), for example, identified variations from −70% to 40% in the streamflow of the Brazilian hydropower sector by the end of the 21st century. Uncertainties observed in the simulations are inherent to the projections of climate change impacts, which come from the highly sensitive climate systems and the actual imprecise nature of future climate projections, in addition to the uncertainties present in the downscaling methods, choice of GCM, and climate data and GHG emission scenarios (Clarko et al. Citation2016, Kundzewicz et al. Citation2018). Accordingly, the uncertainties in the projections of the impacts of climate change on water availability have also been ascertained in several other studies for different regions around the world, and all of them stress the importance of using a multi-GCM approach to obtain more robust future projections (Yimaz and Imteaz 2011, Deb et al. Citation2018, Marhaento et al. Citation2018).
It is important to note that the present study focuses on the analysis of the impacts of climate change on hydrology. It should be noted that no major land-use change has been observed in the region over the last few decades, as reported by Lima Neto et al. (Citation2011). On the other hand, Molina-Navarro et al. (Citation2014) found that land-use management scenarios exhibit lesser effects (−7.6% to 7.3%) on the streamflow relative to climate change scenarios (3.4% to −48.7%). Couture et al. (Citation2014) and Zhang et al. (Citation2019) also identified less significant effects of land-use scenarios on hydrology compared to climate change scenarios. Marhaento et al. (Citation2018) emphasized that it is still a challenge to accurately predict the future hydrological changes due to land-use and climate change, since there are various uncertainties, in particular associated with future climate change scenarios.
4.2 Effects on the reservoir’s water level
In the baseline period (2002–2014), the volume of the reservoir was about 60%, but when inspecting the total period of water level records of Castanhão reservoir (see ), the storage volume showed a gradual decrease, a consequence of the prolonged drought period (2012–2018) (Pontes Filho et al. Citation2020). In addition to the constant withdrawals for the supply, the volume of the reservoirs in the NEB gradually diminishes due to high evaporation rates and irregular rainfall. Braga et al. (Citation2015) and Wada et al. (Citation2013) illustrate these points clearly.
The water level projections indicated divergences (−96.7% to 76.56%) under the impacts of climate change. The same has been observed in other studies (Singh et al. Citation2011, Thorne and Fenner Citation2011, Molina-Navarro et al. Citation2014). Bucak (Citation2018), for example, observed relative changes in projections ranging from −13% to 14%. However, prolonged droughts were identified as a result of climate change for part of the climate models, resulting in a sharp drop in the reservoir volume, and even achieving an almost zero volume in the most pessimistic scenario (see ), which is comparable to the study carried out by Rocha Junior et al. (Citation2018). The drop in volume was mainly a response to the diminished streamflow, which is in agreement with the findings by Molina-Navarro et al. (Citation2014).
With the knowledge that the streamflow influences the percent volume of the lakes and reservoirs, an expression was proposed that relates those two variables to Castanhão reservoir [Equation (16), R2 = 0.94]. The expression managed to suitably capture the projections of the five different climate models for the aggregate scenarios.
4.3 Stream and reservoir simulations
The complete mixing model in this study was adapted to reservoirs of the semi-arid tropical climate (Toné and Lima Neto Citation2020), and considering the transient state and high variability of the storage volume in order to perform future projections of the TP concentrations that are more consistent with reality. This last consideration is an important characteristic of the water bodies in semi-arid basins (Lira et al. Citation2020). The use of the transient model compared to the permanent model has a strong impact on the TP concentration projection, since the permanent version ignores the residual TP concentration from one year to the next, by considering them separate (unpublished results). This fact may explain the low TP concentrations found by Molina-Navarro et al. (Citation2014) and the consequently more optimistic trophic status (no projection in that study indicated eutrophication of the studied reservoir).
On the other hand, the water quality modelling procedures employed in this study should be used with caution, for three reasons. Firstly, the procedure for developing EquationEquation (4)(4)
(4) involves many hydrometeorological uncertainties and nutrient dynamics in the reservoir. Secondly, this correlation ignores the effects of extreme events of precipitation, heavy rainfall that admittedly could increase the nutrient transport to water bodies (Panagopoulos et al. Citation2011). However, over the past few decades, several studies have identified a close relationship between the direct runoff (surface + lateral) and nutrient load in lakes and reservoirs (Sharpley et al. Citation1994, Zheng et al. Citation2004, Molina-Navarro et al. Citation2014). These results, and the fact that the streamflow of Castanhão reservoir coincides with the direct runoff on account of the crystalline soil, indicate that the use of the concentration-streamflow model (Rocha and Lima Neto Citation2020) may be a reasonable alternative for evaluating the impact of climate change on the water quality of reservoirs in the absence of nutrient load data (Bieroza et al. Citation2018), and the consistent results of projections have shown their applicability. Finally, the structure of the complete mixing model adopted here does not reflect all the processes affecting TP concentration within the reservoir, such as the interaction with sediments deposited at the bottom, which can be an important source of internal TP load and cause water quality degradation (Moura et al. Citation2020).
4.4 Trophic status of the reservoir in climate change scenarios
The results of the projections of future TP concentrations showed a trend towards degradation of the water quality in Castanhão reservoir, although they varied in the response of the five different climate models. Divergences in terms of sign and magnitude in the projection of the average TP concentration and other nutrients representative of the water quality were also found in other studies (Couture et al. Citation2014, Citation2018, Nazari-Sharabian et al. Citation2019, Messina et al. Citation2020). Uncertainties in the projections of nutrient concentrations seem to have been spread throughout the climate, hydrological and water quality models (visual inspection of ) (Trolle et al. Citation2011). Apparently, there was a cascade effect of the reduction in the streamflow and percent volume and an increase in the TP concentrations of the reservoir (Bucak Citation2018). This situation indicates the need to include in the adopted methodology the uncertainties propagated throughout the modelling (Chang et al. Citation2015).
Based on the average TP concentrations, almost half of the aggregate scenarios indicated eutrophication of Castanhão reservoir (see ). The SSP5-8.5 scenario projected the highest increases in the annual average TP concentration, especially in the last two periods. Such results deserve particular attention, because the poor water quality has a direct influence on the quantitative aspect of the water resource, since polluted water is unfit to meet the domestic, industrial, recreational and farming requirements (Zhang et al. Citation2019).
In the studies of climate change impact on the water quality in lakes and reservoirs, the majority of studies available in the literature concentrate on water bodies in temperate and tropical climates (Arheimer et al. Citation2005, Komatsu et al. Citation2007, Thorne and Fenner Citation2011, Trolle et al. Citation2011, Molina-Navarro et al. Citation2014, Chang et al. Citation2015, Bucak Citation2018, Couture et al. Citation2018, Me et al. Citation2018, Nazari-Sharabian et al. Citation2019, Zhang et al. Citation2019, Messina et al. Citation2020). Only three of these studies predicted eutrophication of the water bodies, although all studies have pointed to the possibility of the intensification of trophic status. Messina et al. (Citation2020), evaluating Auburn Lake, USA, projected the most pessimistic value in the hypolimnion layer (0.055 mg/L), but in the epilimnion the maximum value was 0.026 mg/L. Nazari-Sharabian et al. (Citation2019), studying a reservoir in Iran, projected values of 0.106 and 0.109 mg/L in the two most pessimistic scenarios, classifying the reservoir in question as eutrophic. Zhang et al. (Citation2019) projected the most drastic increases of all studies available in the literature, where values reached 0.223 mg/L in the most pessimistic scenario, classifying the evaluated reservoir as hypereutrophic. Comparing the TP concentrations in these studies with the most pessimistic values of the study herein (see ), there is further evidence that tropical semi-arid reservoirs may be more prone to eutrophication as a result of the negative impacts of climate change (Coppens et al. Citation2016).
Results reported by other authors regarding the internal TP concentration of reservoirs around the world validate the significance of the maximum concentrations found in this research for the most pessimistic aggregate scenarios. Jensen et al. (Citation2006), investigating the dynamics of phosphorus of 16 eutrophic lakes in Denmark, found average TP concentrations varying from 0.094 to 0.963 mg/L. Rocha Junior et al. (Citation2018) reported average TP concentrations higher than 1.0 mg/L for most tropical reservoirs assessed (5 out of 8) during the driest period of the year in one of the analysed sub-basins, which was in a region with a semi-arid climate in the Brazilian state of Rio Grande do Norte. This panorama is consistent with Me et al. (Citation2018), who stated that climate change may intensify the various forms of pollution in river basins.
This study found relations that suggest the high TP concentrations in Castanhão reservoir were related to the interference of climate change with two variables: decreases in the reservoir’s streamflow and storage volume (see ). This result confirms the hypothesis that the drop in storage volume intensifies the trophic condition of the reservoirs due to the impacts of climate change (Rocha Junior et al. Citation2018). This occurs because a decrease in the storage volume of these water bodies increases the internal nutrient concentration (Jeppesen et al. Citation2015, Wiegand et al. Citation2021). On the other hand, the scenarios that projected a decrease in the streamflow can also contribute by increasing the nutrient concentration in the reservoir, since the drop in runoff diminishes the dilution capacity of the transported pollutants (Zwolsman and van Bokhoven Citation2007, Araújo et al. Citation2019).
In this context, the negative effect of prolonged droughts on water quality seems to be more significant for reservoirs in the tropical semi-arid regions, since they have decreased storage volume and strong streamflow seasonality (Mesquita et al. Citation2020, Wiegand et al. Citation2021). These results are particularly important, since the complete mixing model used in the study herein was expressed directly or indirectly as a function of these characteristics (EquationEquation 3(3)
(3) ), as the TP decay coefficient and the hydraulic residence time are described as functions of streamflow and storage volume.
A formula was also proposed to relate the TP concentration in the reservoir to its percent volume and, consequently, its trophic status [Equation (18), R2 = 0.94]. These mathematical expressions can act as a tool for the sustainable management of the water quality of Castanhão reservoir under climate change scenarios, since they help anticipate the impacts of climate change on the hydrology and water quality of the reservoir. Also, the procedures adopted to develop the aforementioned mathematical expressions have been consistent when applied to another reservoir in the region (Orós reservoir), suggesting the applicability of the procedures to help manage the reservoirs in the Brazilian semi-arid region under climate change.
4.5 Risk of cyanobacterial blooms
Another point worthy of attention is that eutrophication and climate change favour the proliferation and growth of cyanobacterial blooms (Paerl and Huisman Citation2009, O’Neil et al. Citation2012). We can therefore say that the aggregate scenarios that projected eutrophication of Castanhão reservoir suggest the favouring of cyanobacterial blooms (Carvalho et al. Citation2013, Bucak Citation2018). This is why it is necessary to stress the urgent need to control the phosphorus input in the reservoir, largely considered able to neutralize the eutrophication of water bodies (Schindler et al. Citation2016). Such a suggestion becomes even more necessary due to the low coverage and sewage treatment of the sub-basin in question. Thus, several studies have indicated the need to reduce the external nutrient loads, to prevent high concentrations of pollutants in the lakes and reservoirs and a consequent bloom of cyanobacteria, as one of the measures against intensifying global warming (Kosten et al. Citation2012, Nielsen et al. Citation2013, Bucak Citation2018, Nazari-Sharabian et al. Citation2019). However, in addition to measures for controlling land use, stricter restrictions are required for water withdrawal, and the operation of the reservoir must consider qualitative aspects as one of the goals to be achieved (Shokri et al. Citation2014, Ehsani et al. Citation2017, Azadi et al. Citation2019, Nazari-Sharabian et al. Citation2019, Feldbauer et al. Citation2020).
5 Conclusions
The effects of climate change on the trophic status of Castanhão reservoir were investigated using a combination of climate, hydrological and water-quality models. The results show strong uncertainties in the future projections of the variables assessed, suggesting the spread of uncertainties over the stages of the integrated approach. However, some of the projections raised warnings related to Castanhão reservoir’s water quality. Climate change has also evidenced the capacity to affect two of the reservoir’s major variables: streamflow and reservoir volume. The drop in storage volume was related to the reduced streamflow. This drop impacted the self-purification of the river that feeds the reservoir, causing further nutrient concentration flow in the water body. On the other hand, the decrease in volume implied an increase in the reservoir’s internal TP concentration. As a direct impact, intensification of the trophic status was projected for half the aggregate scenarios, compared to the baseline. Also, eutrophication of the reservoir was detected in 40% of the aggregate scenarios. Deterioration of the water quality proved to be more serious in the last evaluated period (2075–2100) for SSP5-8.5. It was found that the drought events could be exacerbated under climate change scenarios, especially at the end of the century for SSP-8.5, increasing the internal TP concentration. Similar results were also obtained for the other large reservoir (Orós) considered in the present study. The above suggests that water bodies in this region could be more vulnerable to the eutrophication phenomenon under climate change scenarios compared to other regions around the world, since they already suffer from gradual reductions in storage volume and recurrent droughts. The results of this study can help decision makers in developing mitigating measures to combat the impacts of climate change on the water quality of the reservoirs of the Brazilian semi-arid region.
Acknowledgements
The authors would like to thank the Water Resources Management Company of Ceará (COGERH), Ceará State Foundation for Meteorology and Water Resources (FUNCEME), National Institute of Meteorology (INMET), and Brazilian National Water Agency (ANA) for providing the data for the present study.
Disclosure statement
No potential conflict of interest was reported by the authors.
Additional information
Funding
References
- Araújo, G.M. and Lima Neto, I.E. 2018. Removal of organic matter in stormwater ponds: a plug-flow model generalisation from waste stabilisation ponds to shallow rivers. Urban Water Journal, 15 (9), 918–924. doi:10.1080/1573062X.2019.1581231.
- Araújo, G.M., Lima Neto, I.E. and Becker, H., 2019. Phosphorus dynamics in a highly polluted urban drainage channel-shallow reservoir system in the Brazilian semiarid. Anais da Academia Brasileira de Ciências, 91 (3), 1–8. doi:10.1590/0001-3765201920180441.
- Arheimer, B., et al., 2005. Climate change impact on water quality: model results from Southern Sweden. AMBIO: A Journal of the Human Environment, 34 (7), 559–566. doi:10.1579/0044-7447-34.7.559.
- Azadi, F., Ashofteh, P.S., and Loáiciga, H.A., 2019. Reservoir water-quality projections und climate-change conditions. Water Resources Management, 33 (1), 401–421. doi:10.1007/s11269-018-2109-z.
- Beaver, J.R., et al., 2013. Extreme weather events influence the phytoplankton community structure in a large lowland subtropical lake (Lake Okeechobee, Florida, USA). Hydrobiologia, 709 (1), 213–226. doi:10.1007/s10750-013-1451-7.
- Bieroza, M.Z., et al., 2018. The concentration-discharge slope as a tool for water quality management. Science of the Total Environment, 630, 738–749. doi:10.1016/j.scitotenv.2018.02.256.
- Block, P.J., et al., 2009. A streamflow forecasting framework using multiple climate and hydrological models. Journal of the American Water Resources Association (JAWRA), 45 (4), 828–843. doi:10.1111/j.1752-1688.2009.00327.x.
- Braga, G.G., et al., 2015. Influence of extended drought on water quality in tropical reservoir in a semiarid region. Acta Limnologica Brasiliensia, 27 (1), 15–23. doi:10.1590/S2179-975X2214.
- Brasil, J., et al., 2015. Drought-induced water-level reduction favours cyanobacteria blooms in tropical shallow lakes. Hydrobiologia, 770 (1), 145–164. doi:10.1007/s10750-015-2578-5.
- Bucak, T., 2018. Modelling the effects of climatic and land use changes on phytoplankton and water quality of the largest Turkish freshwater lake: lake Beysehir. Science of the Total Environment, 621, 802–816. doi:10.1016/j.scitotenv.2020.136549
- Campos, J.N.B., 2015. Paradigms and public policies on drought in Northeast Brazil: a historical perspective. Environmental Management, 55 (5), 1052–1063. doi:10.1007/s00267-015-0444-x.
- Campos, J.N.B., et al., 2016. Trade-off between reservoir yield and evaporation losses as a function of lake morphology in semi-arid Brazil. Anais da Academia Brasileira de Ciências, 88 (2), 1113–1125. doi:10.1590/0001-3765201620150124.
- Carvalho, L., et al., 2013. Sustaining recreational quality of European lakes: minimizing the health risks from algal blooms through phosphorus control. Journal of Applied Ecology, 50 (2), 315–323. doi:10.1111/1365-2664.12059.
- Castagnino, W.A., 1982. Investigación de modelos simplificados de eutroficación en lagos tropicales. Lima: CEPIS.
- Cavalcanti, I.F.A., et al., 2011. Tempo e clima no Brasil. 1rd ed. São Paulo: Oficina de Textos.
- Chang, C.-H., et al., 2015. Assessment of the impacts of climate change on the water quality of a small deep reservoir in a humid-subtropical climatic region. Water, 7 (12), 1687–1711. doi:10.3390/w7041687.
- Chapra, S.C., 2008. Surface water-quality modelling. 2rd ed. Illinois: Waveland Press, Inc..
- Chaves, F.I.B., et al., 2013. Influence of rainfall on the trophic status of a Brazilian semiarid reservoir. Acta Scientiarum, 35 (4), 505–511. doi:10.4025/actascibiolsci.v35i4.18261.
- Clarko, M.P., et al., 2016. Characterizing uncertainty of the hydrologic impacts of climate change. Current Climate Change Reports, 2 (2), 55–64. doi:10.1007/s40641-016-0034-x.
- Coppens, J., et al., 2016. Impact of alternating wet and dry periods on long-term seasonal phosphorus and nitrogen budgets of two shallow Mediterranean lakes. Science of the Total Environment, 563–564, 456–467. doi:10.1016/j.scitotenv.2016.04.028.
- Couture, R.M., et al., 2014. Modelling phosphorus loading and algal blooms in a Nordic agricultural catchment-lake system under changing land-use and climate. Environmental Science Processes & Impacts, 16, 1588–1599. doi:10.1039/C3EM00630A.
- Couture, R.-M., et al., 2018. Simulating water quality and ecological status of Lake Vansjø, Norway, under land-use and climate change by linking process-oriented models with a Bayesian network. Science of the Total Environment, 621 (81), 713–724. doi:10.1016/j.scitotenv.2017.11.303.
- Da Silva, F.N., Alves, J.L.D., and Cataldi, M., 2018. Climate downscaling over South American for 1971–2000: application in SMAP rainfall-runoff model for Grande River Basin. Climate Dynamics, 52, 681–696. doi:10.1007/s00382-018-4166-7
- De Paiva, L.F.G., Montenegro, S.M., and Cataldi, M., 2020. Projection of monthly flows for Três Marias reservoir (São Francisco river basin) using the CFS climate forecast model. Brazilian Journal of Water Resources, 25 (16), 1–18. doi:10.1590/2318-0331.252020190067.
- Deb, P., Babel, M.S., and Denis, A.F., 2018. Multi-GCMs approach for assessing climate change impact on water resources in Thailand. Modeling Earth Systems and Environment, 4 (2), 825–839. doi:10.1007/s40808-018-0428-y.
- du Plessis, A., Harmse, T., and Ahmed, F., 2015. Predicting water quality associated with land cover change in the Grootdraai Dam catchment, South Africa. Water International, 40 (4), 647–663. doi:10.1080/02508060.2015.1067752.
- Ehsani, N., et al., 2017. Reservoir operations under climate change: storage capacity options to mitigate risk. Journal of Hydrology, 555, 435–446. doi:10.1016/j.jhydrol.2017.09.008
- Estácio, A.B.S., 2020. Climate change and model parameter uncertainties propagated to ungauged reservoir catchments in Ceará: a study for water availability assessment. Dissertation. Federal University of Ceara.
- Feldbauer, J., et al., 2020. Managing climate change in drinking water reservoirs: potentials and limitations of dynamic withdrawal strategies. Environmental Sciences Europe, 32 (1), 32–48. doi:10.1186/s12302-020-00324-7.
- Fernandes, R.O., et al., 2017. Reservoir yield intercomparison of large dams in Jaguaribe Basin-CE in climate change scenarios. Brazilian Journal of Water Resources, 22 (11), 1–12. doi:10.1590/2318-0331.011716033.
- Fernández Bou, A.S., Venture de Sá, R., and Cataldi, M., 2015. Flood forecasting in the upper Uruguay River basin. Natural Hazards, 79 (2), 1239–1256. doi:10.1007/s11069-015-1903-7.
- Fraga, R.F., Rocha, S.M.G., and Lima Neto, I.E. 2020. Impact of flow conditions on coliform dynamics in an urban lake in the Brazilian semiarid. Urban Water Journal, 17 (1), 43–53. doi:10.1080/1573062X.2020.1734948.
- Gomes, H.B., et al., 2015. Eastely wave disturbances over Northeast Brazil: an observational analysis. Advances in Meteorology, 2015, 1–20. doi:10.1155/2015/176238.
- Gondim, R.S., et al., 2012. Climate change impacts on irrigation water needs in the Jaguaribe River Basin. Journal of the American Water Resources Association (JAWRA), 48 (2), 355–365. doi:10.1111/j.1752-1688.2011.00620.x.
- Gondim, R.S., et al., 2018. Climate change impacts on water demand and availability using CMIP5 models in the Jaguaribe basin, semi-arid Brazil. Environmental Earth Sciences, 77 (15), 1–14. doi:10.1007/s12665-018-7723-9.
- Hargreaves, G.H. and Samani, Z.A., 1985. Reference crop evapotranspiration from temperature. Applied Engineering in Agriculture, 1 (2), 96–99. doi:10.13031/2013.26773.
- IPCC, 2014. Climate change 2014: synthesis report. Contribution of Working Groups I, II and III to the Fifth Assessment Report of the Intergovernmental Panel on Climate Change [ Core Writing Team, R.K. Pachauri and L.A. Meyer (eds.)]. Geneva, Switzerland: IPCC, 151 pp.
- Jensen, J.P., et al., 2006. An empirical model describing the seasonal dynamics of phosphorus in 16 shallow eutrophic lakes after external loading reduction. Limnology and Oceanography, 51 (1part2), 791–800. doi:10.4319/lo.2006.51.1_part_2.0791.
- Jeppesen, E., et al., 2015. Ecological impacts of global warming and water abstraction on lakes and reservoirs due to changes in water level and related changes in salinity. Hydrobiologia, 750 (1), 201–227. doi:10.1007/s10750-014-2169-x.
- Klippel, G., Macêdo, R.L., and Branco, C.W.C., 2020. Comparison of different trophic status indices applied to tropical reservoirs. Lakes & Reservoirs: Research & Management, 25 (2), 214–229. doi:10.1111/lre.12320.
- Komatsu, E., Fukushima, T., and Harasawa, H., 2007. A modelling approach to forecast the effect of long-term climate change on lake water quality. Ecological Modelling, 209 (2–4), 351–366. doi:10.1016/j.ecolmodel.2007.07.021.
- Kosten, S., et al., 2012. Warmer climate boost cyanobacterial dominance in shallow lakes. Global Change Biology, 18 (1), 118–126. doi:10.1111/j.1365-2486.2011.02488.x.
- Krol, M.S. and Bronstert, A., 2007. Regional integrated modelling of climate change impacts on natural resources and resource usage in semi-arid Northeast Brazil. Environmental Modelling and Software, 22 (2), 259–268. doi:10.1016/j.envsoft.2005.07.022.
- Kundzewicz, Z.W., et al., 2018. Uncertainty in climate change impacts on water resources. Environmental Science & Policy, 79, 1–8. doi:10.1016/j.envsci.2017.10.008.
- Kwon, -H.-H., et al., 2012. Uncertainty assessment of hydrologic and climate forecast models in Northeastern Brazil. Hydrological Processes, 26 (25), 3875–3885. doi:10.1002/hyp.8433.
- Lima, B.P., 2016. Framing of waterbodies in the Brazilian Northeast as an instrument for environmental management and sustainability: the case of the Acarape do Meio watershed in Ceará. Thesis. Federal University of Cear.
- Lima, B.P., Mamede, G.L., and Lima Neto, I.E. 2018. Monitoramento e modelagem da qualidade de água em uma bacia hidrográfica semiárida. Engenharia Sanitária E Ambiental, 23 (1), 125–135. doi:10.1590/s1413-41522018167115.
- Lima Neto, I.E. 2019. Impact of artificial destratification on water availability of reservoirs in the Brazilian semiarid. Anais da Academia Brasileira de Ciências, 91 (3), 1–12. doi:10.1590/0001-3765201920171022.
- Lima Neto, I.E. Wiegand, M.C., and Araújo, J.C., 2011. Sediment redistribution due to a dense reservoir network in a large semi-arid Brazilian basin. Hydrological Sciences Journal, 56 (2), 319–333. doi:10.1080/02626667.2011.553616.
- Lira, C.C.S., Medeiros, P.H.A., and Lima Neto, I.E. 2020. Modelling the impact of sediment management on the trophic status of a tropical reservoir with high water storage variations. Anais Da Academia Brasileira De Ciências, 92 (1), 1–18. doi:10.1590/0001-3765202020181169.
- Lisboa, M.S., et al., 2020. Drought and post-drought rain effect on stream phosphorus and other nutrient losses in the Northeastern USA. Journal of Hydrology: Regional Studies, 28, 100672. doi:10.1016/j.ejrh.2020.100672.
- Lopes, J.C., Braga, J.B.F., and Conejo, J.L., 1982. SMAP – a simplified hydrological model. In: V.P. Singh, ed. Applied Modelling in Catchment Hydrology. Colorado: Water Resources Publications, 1218–1222.
- Luiz Silva, W., et al., 2021. An overview of precipitation climatology in Brazil: space-time variability of frequency and intensity associated with atmospheric systems. Hydrological Sciences Journal, 66 (2), 289–308. doi:10.1080/02626667.2020.1863969.
- Marhaento, H., Booji, M.J., and Hoekstra, A.Y., 2018. Hydrological response to future land-use change and climate change in a tropical catchment. Hydrological Sciences Journal, 63 (9), 1368–1385. doi:10.1080/02626667.2018.1511054.
- Me, W., et al., 2018. Modelling hydrology and water quality in a mixed land use catchment and eutrophic lake: effects of nutrient load reductions and climate change. Environmental Modelling and Software, 109, 114–133. doi:10.1016/j.envsoft.2018.08.001.
- Mesquita, J.B.F., et al., 2020. The influence of hydroclimatic conditions and water quality on evaporation rates of a tropical lake. Journal of Hydrology, 590, 125456. doi:10.1016/j.jhydrol.2020.125456.
- Messina, N.J., et al., 2020. Modelling response of water quality parameters to land-use and climate change in a temperate, mesotrophic lake. Science of the Total Environment, 713, 136549. doi:10.1016/j.scitotenv.2020.136549.
- Molina-Navarro, E., et al., 2014. Hydrological and water quality impact assessment of a Mediterranean limno-reservoir under climate change and land use management scenarios. Journal of Hydrology, 509, 354–366. doi:10.1016/j.jhydrol.2013.11.053.
- Moriasi, D., et al., 2007. Model evaluation guidelines for systematic quantification of accuracy in watershed simulations. Transactions of the ASABE, 50 (3), 885–890. doi:10.13031/2013.23153.
- Moura, D.S., et al., 2020. Modelling phosphorus exchange between bottom sediment and water in tropical semiarid reservoirs. Chemosphere, 246, 125686. doi:10.1016/j.chemosphere.2019.125686.
- National Sanitation Information System (SNIS), 2019. Diagnóstico dos Serviços de Água e Esgotos. Brasília: SNS/MDR.
- National Water Agency (ANA), 2017. Reservatórios do semiárido brasileiro: hidrologia, balanço hídrico e operação. Brasília: ANA.
- Nazari-Sharabian, M., et al., 2019. Water quality modelling of Mahabad Dam watershed-reservoir system under climate change conditions, using SWAT and system dynamics. Water, 11 (2), 1–16. doi:10.3390/w11020394.
- Nazari-Sharabian, M., Ahmad, S., and Karakouzian, M., 2018. Climate change and eutrophication: a short review. Engineering, Technology & Applied Science Research, 8 (6), 3668–3672. doi:10.5281/zenodo.2532694.
- Nielsen, A., et al., 2013. Assessing ways to combat eutrophication in a Chinese drinking water reservoir using SWAT. Marine & Freshwater Research, 64 (5), 475–492. doi:10.1071/MF12106.
- O’Neil, J.M., et al., 2012. The rise of harmful cyanobacteria blooms: the potential roles of eutrophication and climate change. Harmful Algae, 14, 313–334. doi:10.1016/j.hal.2011.10.027.
- O’Neill, B.C., et al., 2014. A new scenario framework for climate change research: the concept of shared socioeconomic pathways. Climatic Change, 122 (3), 387–400. doi:10.1007/s10584-013-0905-2.
- Organisation for Economic Co-operation and Development (OECD), 1968. Scientific fundamentals of the eutrophication of lakes and flowing waters, with particular reference to nitrogen and phosphorus as factors in eutrophication. Paris: OECD. DAS/DSI/68.27.
- Pacheco, C.H.A. and Lima Neto, I.E. 2017. Effect of artificial circulation on the removal kinetics of cyanobacteria in a hypereutrophic shallow lake. Journal of Environmental Engineering, 143 (12), 06017010. doi:10.1061/(ASCE)EE.1943-7870.0001289.
- Paerl, H.W. and Huisman, J., 2009. Climate change: a catalyst for global expansion of harmful cyanobacterial blooms. Environmental Microbiology Reports, 1 (1), 27–37. doi:10.1111/j.1758-2229.2008.00004.x.
- Panagopoulos, Y., Makropoulos, C., and Mimikou, M., 2011. Diffuse surface water pollution: driving factors for different geoclimatic regions. Water Resources Management, 25 (14), 3635–3660. doi:10.1007/s11269-011-9874-2.
- Paula Filho, F.J., et al., 2019. Land uses, Nitrogen and Phosphorus estimated fluxes in a Brazilian semi-arid watershed. Journal of Arid Environments, 163, 41–49. doi:10.1016/j.jaridenv.2019.01.001.
- Pilotti, M., Simoncelli, S., and Valerio, G., 2014. A simple approach to the evaluation of the actual water renewal time of natural stratified lakes. Water Resources Research, 50 (4), 2830–2849. doi:10.1002/2013wr014471.
- Pontes Filho, J.D., et al., 2020. Copula-based multivariate frequency analysis of the 2012–2018 drought in Northeast Brazil. Water, 12 (3), 1–22. doi:10.3390/w12030834.
- Reichwaldt, E. and Ghadouani, A., 2012. Effects of rainfall patterns on toxic cyanobacterial blooms in a changing climate: between simplistic scenarios and complex dynamics. Water Research, 46 (5), 1372–1393. doi:10.1016/j.watres.2011.11.052.
- Rocha Junior, C.A.N., et al., 2018. Water volume reduction increases eutrophication risk in tropical semi-arid reservoirs. Acta Limnologica Brasiliensia, 30, e106. doi:10.1590/s2179-975x2117.
- Rocha, M.J.D. and Lima Neto, I.E. 2020. Relação entre fósforo total e vazão afluente nos principais reservatórios rurais do estado do Ceará no semiárido brasileiro. Revista AIDIS De Ingeniería Y Ciencias Ambientales, 13 (3), 715–730. http://dx.doi.org/10.22201/iingen.0718378xe.2020.13.3.68153
- Rocha, S.M.G., Mesquita, J.B.F., and Lima Neto, I.E. 2019. Análise e modelagem das relações entre nutrientes e fitoplâncton em reservatórios do Ceará. Revista Brasileira de Ciências Ambientais, 54, 134–147. doi:10.5327/Z2176-947820190536
- Salas, H.J. and Martino, P.A., 1991. A simplified trophic status model for warm water tropical lakes. Water Research, 25 (3), 341–350. doi:10.1016/0043-1354(91)90015-I.
- Santos, J.C.N., et al., 2014. Land use and trophic status dynamics in a tropical semi-arid reservoir. Revista Ciência Agronômica, 45 (1), 35–44. doi:10.1590/S1806-66902014000100005.
- Schindler, D.W., et al., 2016. Reducing phosphorus to Curb Lake eutrophication is a success. Environmental Science & Technology, 50 (17), 8923–8929. doi:10.1021/acs.est.6b02204.
- Sharpley, A.N., et al., 1994. Managing agricultural phosphorus for protection of surface waters: issues and options. Journal of Environmental Quality, 23 (3), 427–451. doi:10.2134/jeq1994.00472425002300030006x.
- Shokri, A., Haddad, O.B., and Mariño, M.A., 2014. Multi-objective quantity-quality reservoir operation in sudden pollution. Water Resources Management, 28 (2), 567–586. doi:10.1007/s11269-013-0504-z.
- Silva, M.V.M., et al., 2021. Projection of climate change and consumptive demands projections impacts on hydropower generation in the São Francisco River Basin, Brazil. Water, 13 (3), 1–25. doi:10.3390/w13030332.
- Silveira, C.S., Souza Filho, F.A., and Vasconcelos Junior, F.C., 2017. Streamflow projections for the Brazilian hydropower sector from RCP scenarios. Journal of Water and Climate Change, 8 (1), 114–126. doi:10.2166/wcc.2016.052.
- Singh, C.R., et al., 2011. Modelling water-level options for ecosystem services and assessment of climate change: loktak Lake, northeast India. Hydrological Sciences Journal, 56 (8), 1518–1542. doi:10.1080/02626667.2011.631012.
- Taylor, K.E., Stouffer, R.J., and Meehl, G.A., 2012. An overview of CMIP5 and the experiment design. Bulletin of the American Meteorological Society, 93 (4), 485–498. doi:10.1175/BAMS-D-11-00094.1..
- Thorne, O. and Fenner, R.A., 2011. The impacts of climate change on reservoir water quality and water treatment plant operations: a UK casa study. Water and Environment Journal, 25 (1), 74–87. doi:10.1111/j.1747-6593.2009.00194.x.
- Tiezzi, R., et al., 2019. Trends of streamflow under climate change for 26 Brazilian basins. Water Policy, 21 (1), 206–220. doi:10.2166/wp.2018.207.
- Toledo, J., et al., 1983. A aplicação de modelos simplificados para a avaliação de processo de eutrofização em lagos e reservatórios tropicais. In: 12º Congresso Brasileiro de Engenharia Sanitária, 20–25 de novembro 1983 Santa Catarina, Associação Brasileira de Engenharia Sanitária (ABES) 1–34.
- Toné, A.J.A. and Lima Neto, I.E. 2020. Modelagem simplificada do fósforo total em lagos e reservatórios brasileiros. Revista DAE, 67 (221), 142–156. doi:10.36659/dae.2020.012.
- Trolle, D., et al., 2011. Predicting the effects of climate change on trophic status of three morphologically varying lakes: implications for lake restoration and management. Environmental Modelling and Software, 26 (4), 354–370. doi:10.1016/j.envsoft.2010.08.009.
- Trolle, D., et al., 2015. Projecting the future ecological state of lakes in Denmark in a 6 degree warming scenario. Climate Research, 64 (1), 55–72. doi:10.3354/cr01278.
- Wada, Y., et al., 2013. Human water consumption intensifies hydrological drought worldwide. Environmental Research Letters, 8 (3), 1–14. doi:10.1088/1748-9326/8/3/034036.
- Water Resources Management Company of Ceará (COGERH), 2011. Inventário ambiental: açude Castanhão. Fortaleza: COGERH.
- Water Resources Management Company of Ceará (COGERH), 2020. Qualidade das águas dos açudes monitorados pela COGERH– campanha de fevereiro/2020 – relatório final. Fortaleza: COGERH.
- Wiegand, M.C., et al., 2021. Trophic state changes of semi-arid reservoirs as a function of the hydro-climatic variability. Journal of Arid Environments, 184, 104321. doi:10.1016/j.jaridenv.2020.104321.
- Ylmaz, A.G. and Imteaz, M.A., 2011. Impact of climate change on runoff in the upper part of the Euphrates basin. Hydrological Sciences Journal, 56 (7), 1265–1279. doi:10.1080/02626667.2011.609173.
- Zhang, C., et al., 2019. An ensemble modelling framework to study the effects of climate change on the trophic status of shallow reservoirs. Science of the Total Environment, 697, 134078. doi:10.1016/j.scitotenv.2019.134078.
- Zheng, F.L., Huang, C.H., and Norton, L.D., 2004. Effects of near-surface hydraulic gradients on nitrate and phosphorus losses in surface runoff. Journal of Environmental Quality, 33 (6), 2174–2182. doi:10.2134/jeq2004.2174.
- Zwolsman, J.J.G. and van Bokhoven, A.J., 2007. Impact of summer droughts on water quality of the Rhine River - a preview of climate change? Water Science & Technology, 56 (4), 45–55. doi:10.2166/wst.2007.535.