
 ?Mathematical formulae have been encoded as MathML and are displayed in this HTML version using MathJax in order to improve their display. Uncheck the box to turn MathJax off. This feature requires Javascript. Click on a formula to zoom.
ABSTRACT
The study aims to evaluate the long-term accuracy of global precipitation (Climate Prediction Center (CPC) and Precipitation Estimation from Remotely Sensed Information using Artificial Neural Networks – Climate Data Record (PERSIANN-CDR)) along with raingauge datasets at multiple temporal scales in the Vu Gia Thu Bon basin, Vietnam. Since there are few rainfall stations in this basin, it is important to validate multisource data for multiple purposes. This is the first time that a lumped hydrological model (i.e. Probability Distributed Moisture (PDM)) has been used for this basin. Various statistical indicators, including the correlation coefficient, mean absolute error (MAE), root mean square error (RMSE), percent bias (BIAS) and Taylor diagram, were used to evaluate the applicability of the global precipitation data and the PDM model. The precipitation datasets showed a good correlation with the raingauge rainfall data. In contrast, CPC underestimates while PERSIANN-CDR overestimates the raingauge rainfall. In general, PERSIANN-CDR performed slightly better than CPC. The daily streamflow simulation driven by PDM and all data sources underestimates the actual flow.
Editor A. Fiori Associate Editor M. C. Demirel
1 Introduction
Accurate collection of precipitation data has important implications and is critical for research, monitoring, prediction of climate, planning agricultural activities, hydrological and disaster forecasting, developing sustainable water management, and monitoring water quality (Sirisena et al. Citation2018, Solakian et al. Citation2019). Raingauges, weather radar, satellites, and climate system models are common techniques to estimate precipitation and collect relevant information (Zhang et al. Citation2018). However, raingauges are considered to measure precipitation with high accuracy (Li et al. Citation2020) and are used for reference. It has been observed that precipitation estimation from areas of high raingauge density is more reliable as compared to low-density areas (Su et al. Citation2020). The low raingauge density is because of the high installment and maintenance cost (Lakshmi et al. Citation2018), particularly in complex, hilly regions and remote areas (Ali et al. Citation2017, Mekis et al. Citation2018). This limits the spatial and temporal distribution of the raingauge network and provides inconsistent historical records.
Weather radar and satellites indirectly measure precipitation through scattering and attenuation of microwaves (Bai and Liu Citation2018). Despite having high resolution, however, the data quality of radar is not steady because of terrain occlusion, radar ray uplift, high-rise buildings, beam height variations, ground clutter, and the distorted electronic signals introduced by the surrounding environment (Ahmed et al. Citation2019). Satellites have low accuracy as compared to raingauges and radar, especially with localized rainfall variations, even though satellite precipitation products are superior to raingauge and radar in large-scale, remote, and complex areas. This is because the rapid development of satellite-based remote sensing technology for precipitation and cloud observations at a global scale means satellites provide reliable data. Furthermore, the climate system model provides an important way to simulate and predict climate change. However, there are still uncertainties in the simulation results due to global climate complexity (Stocker et al. Citation2013).
Currently, there are many gridded satellite precipitations at a very large scale that are freely available, including Precipitation Estimation from Remotely Sensed Information using Artificial Neural Networks (PERSIANN-CDR) (Ashouri et al. Citation2015); Re-Analysis Interim (ERA-Interim) precipitation (Liu et al. Citation2018); Climate Prediction Center (CPC Morphing technique (CMORPH)) (Joyce et al. Citation2004); Tropical Rainfall Measuring Mission (TRMM) Multi-Satellite Precipitation Analysis (TMPA) (Huffman et al. Citation2007); and Global Precipitation Mission (GPM) (Hou et al. Citation2014, Huffman et al. Citation2015). It is expected that their performance varies from place to place, region to region, application to application, and season to season. These variations might be due to their different retrieving algorithms, local weather conditions, and local topographic features. It is important to evaluate their performance against true data (raingauge) to enhance confidence in their usage and find more appropriate datasets for a particular study region, which will be a better alternative to raingauges. Many researchers have examined and compared the quality of various satellite-derived precipitation datasets (Mosaffa et al. Citation2020, Trang et al. Citation2020). Many satellites provide real-time precipitation data at a large scale (i.e. regional and global scales). Therefore, the data have been used in various fields of study such as meteorological, hydrological, and climatological applications, incorporating precipitation data worldwide (Mararakanye et al. Citation2020, Pang et al. Citation2020).
Accurate (high spatial and temporal resolution) precipitation is the most significant meteorological parameter for forcing and calibrating hydrologic models. It influences hydrological behaviour, the simulation and prediction of hydrological processes, and various components of the water budget such as runoff, evaporation, and infiltration at the basin level (Wu et al. Citation2018, Sirisena et al. Citation2018). It is also considered that accurate precipitation estimation is important for the quantification of extreme hydrologic events, which is vital for water resource planning and management (Su et al. Citation2017). Numerous studies are available on the impacts of precipitation on the stabilization, model parameterization, and calibration performance (Cornelissen et al. Citation2016, Molina-Navarro et al. Citation2017).
The hydrological model or rainfall-runoff model is an important tool for understanding hydrological processes and efficient and effective water resource assessment for decision-makers (Molina-Navarro et al. Citation2017, Pang et al. Citation2020). However, one of the challenges faced by hydrological modellers in developing countries is the availability of quality weather data. Commonly, raingauge and satellite data are used for the hydrological model as forcing data. It is observed that satellite precipitation has exhibited continually improved performance in hydrological modelling (Solakian et al. Citation2019). This is the best way to compare the hydrological utility of satellite datasets (Tuo et al. Citation2016).
Many researchers have evaluated and assessed the statistical and hydrological analysis of satellite and raingauge data (Kitagawa Citation2017, Li et al. Citation2018, Tarek et al. Citation2020). Previous studies have shown that satellite-based models outperformed raingauge-based models in terms of streamflow simulation (Mohammed et al. Citation2018, Xian et al. Citation2019). In reviewing the previous literature, we found that limited research has been done on Vu Gia Thu Bon, an important basin. Duong and Gourbesville (Citation2016) worked on the uncertainties of input data in the understanding of flood events using fully distributed hydrological models (i.e. Mike 11, Mike 21, and Mike Flood). This study is useful for the selection of hydrological models in this basin as they developed and constructed a deterministic distributed hydrological model. Moreover, they found high Nash–Sutcliffe efficiency (NSE) and correlation coefficients. Our literature review indicated that no one has used the semi-distributed Probability Distribution Model (PDM) hydrological model over this basin. Therefore, this study helps to fill a research gap by investigating the performance of the PDM over this basin using multisource satellite data. In particular, the objective of this study is to evaluate the long-term performance and hydrological utility of raingauges and different rainfall satellite products. Moreover, the consistency of the semi-distributed hydrological model will be evaluated over the long term for the first time in this basin.
2 Materials and methods
2.1 Study area
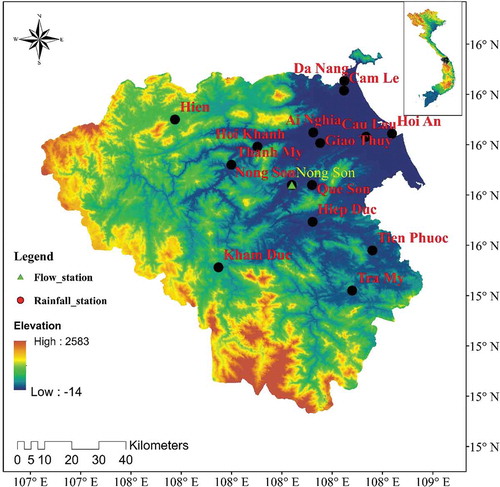
The Vu Gia Thu Bon is the biggest river basin of central Vietnam (Vo et al. Citation2018). illustrates the location of the basin in Vietnam, along with the location of the raingauges. It starts from the eastern side of the Truong Son mountain range and drains into the East Sea near the cities of Da Nang and Hoi An (Vo and Gourbesville Citation2015). This basin has two main rivers, the Vu Gia and the Thu Bon. The watershed area is about 10 350 km2 (Phuong et al. Citation2020). The basin has two major sub-basins; the first is at flow station Thanh My over Vu Gia River, with a basin area of 1850 km2 and an annual average flow of about 120 m3/s. The other is at Nong Son flow station over Thu Bon River, with a basin area of 3150 km2 and an annual average flow of 270 m3/s – more than double the Vu Gia river basin flow (Vu et al. Citation2017). The topography of the basin is complex, with a narrow mountainous area and a maximum elevation of 2600 m. There is a large number of steep tributaries and a flat coastal zone downstream, which makes it more complex (Nguyen, Gourbesville, Vo, Citation2018). The density of meteorological and hydrological stations is sparse. There are only 15 rainfall and two flow stations available in this large big basin, and because there is so little data available it is very difficult to manage natural disasters to reduce socio-economic losses in the basin (Vo and Gourbesville Citation2018). This basin is located in a tropical monsoon climate region (Phuong et al. Citation2020), which is influenced by Truong Son mountain with high rainfall, and the nature of extreme weather (extreme rainfall, storms, floods, droughts, and typhoons) i the area is also complex. The annual average rainfall in the basin varies from 2000 to 4000 mm, 65–80% of which is contributed by the rainy season (September to December) (Vu et al. Citation2017). Moreover, the basin is frequently hit by a few typhoons annually that generate huge rainfall and whirlwinds, which cause serious disasters.
Figure 1. Locations of raingauges and flow gauge, and topography of study area
2.2 Data collection
This study used three precipitation datasets which have different retrieval algorithms and differing spatiotemporal resolution. These datasets include raingauges, remotely sensed satellite-based PERSIANN-CDR data and National Oceanic and Atmospheric Administration (NOAA’s) CPC data (Chen et al. Citation2008, Ashouri et al. Citation2015). Flow data are also used in this study. To ensure time series consistency of each dataset in the Vu Gia Thu Bon basin, a long rainfall period (1979–2016) was selected for the study.
The daily 38-year (1979–2016) raingauge precipitation and flow gauge data for the Vu Gia Thu Bon basin were collected from the Vietnam Meteorological and Hydrological Administration (VMHA; http://kttvqg.gov.vn/) and National Central for Water Resources Planning and Investigation (NAWAPI; http://nawapi.gov.vn/). The 5-year data were used for hydrological model calibration (3 years) and validation (2 years); the rest of the data (33 years) were used for the analysis. Fifteen raingauges and one flow gauge station were used in this study. The raingauge stations in the Vu Gia Thu Bon basin are sparse; there is only one raingauge in an area of around 700 km2. Basic information on the selected precipitation products (i.e. CPC and PERSIANN-CDR) is given in .
Table 1. Basic information on the remotely sensed data
3 Analytical framework
The digital elevation model (DEM) data with a resolution of 230 m was used to delineate the basin boundaries. The Thiessen polygon method was used to determine the average rainfall from raingauges, and Grid Analysis and Display System (GrADS) code was run for calculation of average rainfall rom CPC and PERSIANN-CDR data. The PERSIANN-CDR and CPC data are compared against raingauge data at daily, monthly and annual time scales from 1984 to 2016. The satellite and reanalysis datasets were validated against raingauge data using cumulative basin rainfall and scatter plots. There are two main sections of this evaluation. The first section (precipitation product evaluation) evaluates the applicability of satellite (CPC and PERSIANN-CDR) and gauge-based precipitation. The second section is an examination of the accuracy and reliability of the runoff simulation results, conducted with semi-distributed hydrological model PDM, which was forced with the aforementioned precipitation products from raingauge data to calibrate (from 1979 to 1981) and validate (from 1982 to 1983) the model before it was used for streamflow simulations at Nong Son streamflow station from 1984 to 2016. Moreover, the simulated daily streamflow was evaluated with some evaluating indices to indicate that the selected satellite-based precipitation datasets are capable of capturing the streamflow accurately and in a timely manner.
The different products are examined in terms of quantitative, categorical, and graphical measures. For the quantitative evaluation, various statistical metrics are used, including the coefficient of determination (R2), mean absolute error (MAE), root mean square error (RMSE), and bias (BIAS). The R2 shows the agreement between the satellite precipitation and raingauge observations. The MAE was used to determine the scales of deviation of data; the average magnitude of the differences was found using the RMSE and BIAS, which refers to the systematic bias between the satellite and raingauge data (Abro et al. Citation2020a, Abro et al. Citation2020b). Furthermore, a Taylor diagram was used, which shows the ratio of R2, RMSE and standard deviation (SD) visually to compare the “closeness” between the satellite and the raingauge data (Taylor Citation2001).
Next, three categorical statistical indices – the probability of detection (POD), false-alarm ratio (FAR), and critical success index (CSI) – were used to describe the consistency between the satellite data and observed rainfall events. The POD (hit rate) index represents the ratio of the correct detection of rainfall events by satellite to the total number of events recorded by the raingauges. The FAR index denotes the ratio of rain events detected by satellite to no rain observed by a raingauge. CSI represents the correctly identified portion of rainfall by satellite. The optimal value for POD and CSI is 1, while that for FAR is 0 (Zhang et al. Citation2020, Zhu et al. Citation2020).
Moreover, the hydrological utility of datasets was analysed statistically and visually. Various statistical indicators are commonly used to detect the hydrological ability of data sources. This study focuses on R2, RMSE, and the percentage difference (Elahi et al. Citation2017, Citation2020). The mathematical formulas for all statistical indicators used in this study are given below:
where n represents a total number of observations, S indicates satellite and reanalysis data, and station-based data is represented as G. are mean values of station and satellite data, respectively.
represents the ith observation. An event detected by raingauge and satellite is represented as x. An event detected by satellite and not detected by raingauge is represented by y. Similarly, an event detected by raingauge and not detected by satellite is represented by z.
3.1 Description of the probability distribution model (PDM)
The hydrological usefulness of rainfall datasets was assessed using the lumped conceptual rainfall-runoff PDM. The probability distribution function (pdf) is used by the model to determine the deficit of soil moisture in the basin and those soil moisture stores used for transformation of input (rainfall and evaporation) into output (flow) at the outlet of the basin (Moore Citation1985, Moore and Bell Citation2002, Abro et al., Citation2019). The PDM is frequently used for operation and flow forecasting around the globe because of its computational easiness and low input data requirement. Nelder and Mead (Citation1965) have suggested two optimization methods, manual and automatic, along with informal visually interactive parameter estimation in the calibration shell environment, which was further modified by Gill et al. (Citation1981). The assessment of the effect of parameter change and optimization (manual and automatic) on the shape of the hydrographs was done using the visualization tool. During the calibration, parameters were adjusted to achieve best-fit results between the actual and simulated flow. The hydrological investigation (calibration, validation, and simulation) was carried out at the Thanh My station.
4 Results and discussion
4.1 Validation of rainfall
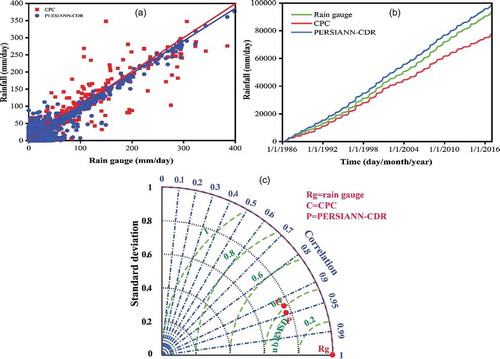
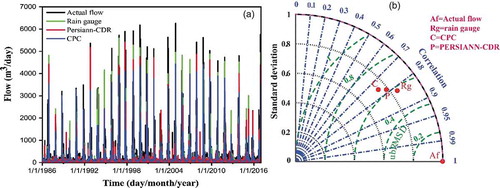
Before rainfall satellite data can be used, it is important to validate them for a particular region. Therefore, many techniques such as scattered plots and cumulative catchment rainfall have been applied for validation (Bilal et al. Citation2017, Abro et al. Citation2020a). This study used the scattered plots and cumulative basin rainfall to validate satellite data. The preliminary assessments of linear regression and the nature of relationships or associations between raingauges and satellite datasets were done with scatterplots. Results showed that both data sources have a high correlation with observed rainfall. illustrates the underestimation of CPC and overestimation of PERSIANN-CDR. It shows that for higher rain intensity, both data sources underestimated the raingauge. The cumulative basin rainfall showed more clearly that CPC underestimated and PERSIANN-CDR overestimated the raingauge rainfall, specifically for the second half of the study duration. The Taylor diagram shows that both sources have a good correlation with raingauge rainfall, and it demonstrates that unbiased root mean square differences and SD are also low. The scatterplots and cumulative basin rainfall and Taylor diagram are given in –c).
Figure 2. Scattered plots of cumulative rainfall in the basin, and Taylor diagram of different rainfall sources
4.2 Rainfall comparison
The daily, monthly, and annual rainfall performances of satellite datasets were analysed on a graphical and statistical basis over the Vu Gia Thu Bon basin against raingauges for the period of 31 years (January 1986 to December 2016). First, we compared different sources of satellite rainfall graphically. The brief comparison of daily rainfall data derived from the CPC and PERSIANN-CDR was plotted against raingauge data ()). The graphical evaluation suggested that both sources followed the same trend: whereas CPC underestimated and PERSIANN-CDR overestimate raingauge rainfall, this underestimation and overestimation are greater in high rain intensity. The underestimation of CPC rainfall was also found by Dinh et al. (Citation2020) for the largest river in Southeast Asia (Mekong River Basin). Pang et al. (Citation2020) studied the Jialing River, a tributary of the Yangtze River, from 1997 to 2018 and found that CPC underestimated raingauge rainfall.
Figure 3. Daily, monthly and annual rainfall: a comparison of data sources
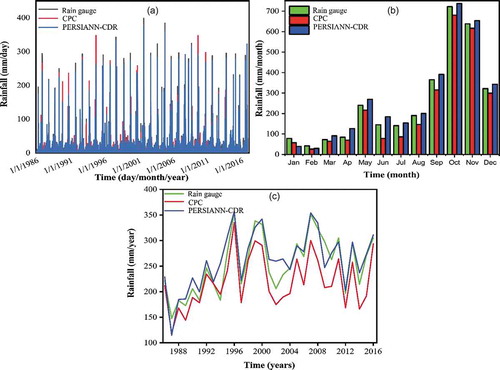
Furthermore, the mean monthly rainfall for the study period was calculated for all 15 raingauges and the two satellite rainfall products, and graphically compared. ) shows that both CPC and PERSIANN-CDR data followed very well the “climatology” of the raingauges. Although CPC underestimated, it is a little high from June to August, and PERSIANN-CDR overestimated in all months except January and February, in which it underestimated the rainfall of raingauges. The underestimation of 23 precipitation datasets, including CPC, was observed by Darand and Khandu (Citation2020) over Iran for the period of 33 years (1979 to 2013). In general, data from both sources are closer to the monthly mean of the raingauge data for the study period.
Similarly, ) illustrates the graphical pattern of the mean annual rainfall of the sources from 1986 to 2016. Based on an extensive graphical evaluation of the data, we can conclude that CPC had better performance in the initial (10) years of the study period. It underestimates the raingauges, but it improved its performance in the last 3 years. The PERSIANN-CDR underestimated the raingauges in the initial 3 years of the study period, but after that its performance was quite satisfactory. Nguyen, Gourbesville, Vo, (Citation2018) studied the whole PERSIANN family. They found that the annual average precipitation of PERSIANN-CDR better mirrors the precipitation patterns in their study from 2003 to 2015. However, an overestimation in the Midwestern states and an underestimation over the northwestern US (Washington, Oregon, and northern California) of PERSIANN-CDR were also found in that study. Both CPC and PERSIANN-CDR exhibit the same pattern following the raingauges. In general, the graphical evaluation reported that PERSIANN-CDR had outperformed CPC.
The applicability of the data sources was statistically interpreted using the bias, correlation co-efficient, RMSE, and MAE at daily, monthly, and annual temporal scales. Both data sources have a high correlation coefficient of more than 0.90; they are better on a monthly temporal scale. Chaudhari et al. (Citation2006) reported similar results for two basins of India for two years, 2003 and 2004. The bias is less than 1 at daily and monthly scales, while it is 1 for annual data. However, the RMSE is less than 10 on a daily scale, and it is 20 and 40 for monthly and annual data, respectively. The MAE for both sources is also very low. On a statistical basis, the PERSIANN-CDR dominates over CPC ().
Table 2. Statistical indicators for rainfall comparison
Moreover, the rain detection ability of satellites was evaluated using three categorical statistical metrics, POD, FAR, and CSI. Their values compared with the raingauges are presented in . The daily and monthly POD and CSI values are between 0.50 and 0.75. The daily FAR values are 0.17 for CPC and 0.12 for PERSIANN-CDR; they are zero monthly and annually for both sources. The POD, FAR and CSI values are evident in their ability to detect events. Relatively speaking, PERSIANN-CDR has slightly better values for the accurate detection of rain as compared to CPC.
Table 3. The selected PDM parameters for the period 1979–2016 over Vu Gia Thu Bon basin
4.3 Model calibration and validation
Calibration and validation of the model are very important aspects of hydrological modelling. At the calibration stage, model parameters are adjusted to make the simulation results closer to the actual flow. After the calibration, those adjusted parameters are validated for other events. The adjusted parameter values for the calibration and validation of the model are given in .
The raingauge precipitation data used as input for the PDM parameters were calibrated against the actual streamflow at the Nong Son station. The model was calibrated from 1 January 1979 to 31 December 1981. The PDM model was used a generic model calibration shell environment for calibration. Two optimization methods (i.e. manual and automatic calibration processes) were used to obtain the best fit between actual and simulated flows. After that, validation was carried out for 2 years, from 1 January 1982 to 31 December 1983. After model calibration and validation, the PDM model was used for simulations of 31 years using daily raingauge and satellite data at the Nong Son station. The hydrological performance of the sources was evaluated on a graphical and statistical basis (with R2, RMSE, and percentage difference). The hydrograph of the calibration is given in ). The figure shows that the actual flow peaks and the model-generated peaks are following the same trend; however, the calibration model generated peaks that were slightly underestimated relative to the actual flow for a few high peaks, specifically in the last few years of the study period. The validation was run for 2 years, and the resemblance in the peaks of actual flow and model-generated flow can be seen along with the slight underestimation ()).
Figure 4. Model performance during calibration and validation
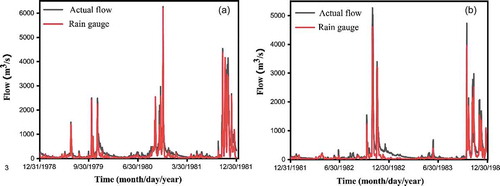
The statistical values of R2 and RMSE in the calibration and validation periods are given in . The R2 values are 0.83 and 0.80 for calibration and validation, respectively. RMSE is 73.79 and 65.20 m3/s for calibration and validation, respectively. Almost identical coefficients for calibration and validation were found by Pang et al. (Citation2020) in their study of the Jialing River watershed, China, using the Soil and Water Assessment Tool (SWAT) hydrological model. The model performance in validation is normally lower than that in calibration because of divergence of the model (Ahmed et al. Citation2020, Feng et al. Citation2020, Mararakanye et al. Citation2020).
Table 4. Statistical indicators of model performance in the calibration period (1979–1981) and validation period (1982–1983)
4.4 Long-term flow analysis
The hydrological simulations were performed from 1986 to 2016 with the PDM model using raingauges, CPC, and PERSIANNN-CDR rainfall data at Nong Son flow station which is located in the middle of Vu Gia Thu Bon basin. The daily simulation hydrographs for 31 years are shown in . The simulation capabilities of different rainfall data sources were comprehensively analysed. The PDM model, driven by a raingauge, CPC, and PERSIANN-CDR rainfall data, was shown to capture comparable trends to actual flow in both magnitude and timing. Although all data sources underestimated the actual flow in general, following an extensive evaluation, it could be concluded that PERSIANN-CDR showed a slight overestimation. All flow generated by rainfall sources (raingauge, PERSIANN-CDR and CPC) showed a slight underestimation relative to actual flow (as shown in )). Moreover, the Taylor diagram ()) graphically demonstrates the underestimation of the SD and unbiased root mean square differences, and it is clear that both data sources have a high correlation with actual flow.
Figure 5. Comparison of flows obtained from different rainfall datasets and actual flow
Furthermore, a statistical evaluation was carried out to confirm the graphical evaluation. Three statistical indicators (i.e. R2, RMSE, and percentage difference) were used, as shown in . The statistical indicators suggest that the flows generated by different rainfall sources are good. All data sources have good correlation coefficients, of 0.82 for raingauges followed by 0.78 for PERSIANN-CDR and 0.75 for CPC. Similar correlation coefficients were found by Bâ et al. (Citation2018). All sources have a slightly higher RMSE, and the percentage difference was −0.09 for the raingauge, −0.15 for PERSIANN-CDR, and −0.27 for CPC; the negative values indicate that all sources underestimated the actual flow. Based on the simulation results (graphical and statistical methods), the performance of PDM using the raingauge data as input is better than that of PERSIANN-CDR and CPC, but satellite rainfall datasets can be considered alternative sources at a certain level.
Table 5. Statistical criteria for flow comparison
5 Conclusion and policy implications
This study aims to evaluate the long-term accuracy of CPC and PERSIANN-CDR along with gauge-based precipitation at daily, monthly, and annual temporal scales at the basin level, and their hydrological utility in simulating daily streamflow was also investigated using the PDM hydrological model, from 1986 to 2016 over the Vu Gia Thu Bon basin, Vietnam. Various statistical indicators were used to evaluate the performance of the different data sources, and their detection abilities were also assessed with categorical indicators. All the evaluated precipitation datasets showed a good correlation with raingauge rainfall data (more than 0.90); however, PERSIANN-CDR has smaller values of MAE, RMSE, and BIAS at daily, monthly, and annual temporal scales, relative to CPC. The moderate (good) values obtained for POD, CSI, and FAR at daily, monthly, and annual scales represent the detection capabilities of the data sources. According to the quantitative assessment, CPC was underestimated, while PERSIANN-CDR slightly overestimated the raingauge precipitation on all evaluated temporal scales. PERSIANN-CDR performed slightly better than CPC based on the above evaluations (statistical, quantitative, and detection skills).
Achieving a reliable satellite data source is still a great challenge for hydrologists in establishing a good hydrological model due to the sparsity and unevenness of raingauge precipitation. The satellite and radar data are used as alternates in many countries. This study has used daily multisource data for the hydrological utility, with the involvement of the lumped hydrological PDM in Vu Gia Thu Bon, Vietnam. The daily streamflow simulation based on multiple sources driven by PDM showed that all data sources, including raingauges, underestimated the actual flow. This underestimation varies from source to source; it is smaller for raingauges and larger for CPC. However, the statistical indicators showed a similar performance trend; raingauges had a higher correlation coefficient of 0.79, followed by PERSIAN-CDR (0.76) and CPC (0.74). Sattellite rainfall data sources have slightly higher RMSE values relative to raingauge data when using it as input in the hydrological model. Moreover, the percentage of differences also showed a good commitment. Overall, the raingauge dataset performed the best, followed by PERSIANN-CDR and then CPC. The multiple sources have advantages and limitations regarding accuracy of precipitation estimation at different spatial and temporal scales, as well as for hydrological modelling. All data sources performed well, but still, their accuracy is not up to the desired standard. Therefore, the retrieval algorithms must be improved.
The study was based on the long-term validation of multi sources, and the important conclusions are as follows: (i) The PERSIANN-CDR performed well; (ii) both PERSIANN-CDR and CPC rainfall can be used for hydrological utility in Vu Gia Thu Bon River basin, Vietnam; (iii) based on the current study, we recommend applying various tools to determine the damage caused by weather extremities on the agricultural, industrial and service sectors. In the future, more multisource and distributed hydrological models may be used to test in this area. Furthermore, the proposed frame can be validated over more basins where data availability is limited.
Author contributions
Muhammad Ilyas Abro: conceptual framework, formal analysis, methodology, writing – original draft, writing – review and editing. Quoc Bao Pham: supervision, conceptualization, review and editing, data curation. Ehsan Elahi: formal analysis, investigation and write-up. Dehua Zhu: methodology, formal analysis, review and editing. Nguyen Thi Thuy Linh, Duong Tran Anh, Khaled Mohamed Khedher, Mohammad Ahmadlou: methodology, writing – review and editing, data curation.
Acknowledgements
The authors extend their thanks to the Deanship of Scientific Research at King Khalid University for funding this work through the large research groups under grant number RGP. 2/173/42.
Disclosure statement
No potential conflict of interest was reported by the authors.
Data availability statement
The data will be available from the author Quoc Bao Pham [[email protected]], upon reasonable request.
Additional information
Funding
References
- Abro, M., et al., 2020a. Statistical and qualitative evaluation of multi-sources for hydrological suitability in fl ood-prone areas of Pakistan. Journal of Hydrology, 588 (4), 125117. doi:10.1016/j.jhydrol.2020.125117
- Abro, M.I., et al., 2019. Hydrological appraisal of rainfall estimates from radar, satellite, raingauge and satellite–gauge combination on the Qinhuai River Basin, China. Hydrological Sciences Journal, 64 (16), 1957–1971. Taylor & Francis. doi:10.1080/02626667.2018.1557335
- Abro, M.I., et al., 2020b. Hydrological evaluation of satellite and reanalysis precipitation products in the glacier-fed river basin (Gilgit). Arabian Journal of Geosciences, 13 (14), 631. doi:10.1007/s12517-020-05621-2
- Ahmed, E., et al., 2020. Hydrologic assessment of TRMM and GPM-based precipitation products in transboundary river catchment (Chenab River, Pakistan). water, 12 (1902), 1–20. 10.3390/w12071902
- Ahmed, K., et al., 2019. Evaluation of gridded precipitation datasets over arid regions of Pakistan. Water (Switzerland), 11 (210). doi:10.3390/w11020210
- Ali, A.F., et al., 2017. Evaluation and comparison of TRMM multi-satellite precipitation products with reference to rain gauge observations in Hunza River Basin, Karakoram sustainability evaluation and comparison of TRMM multi-satellite precipitation products with reference to R. Sustainability, 9 (11), 1954. doi:10.3390/su9111954
- Ashouri, H., et al., 2015. PERSIANN-CDR: daily precipitation climate data record from multisatellite observations for hydrological and climate studies. Bulletin of the American Meteorological Society, 96 (1), 69–83. doi:10.1175/BAMS-D-13-00068.1
- Bâ, K.M., et al., 2018. Hydrological evaluation of PERSIANN-CDR rainfall over Upper Senegal River and Bani River Basins. Remote Sensing, 10 (12), 1884. doi:10.3390/rs10121884
- Bai, P. and Liu, X., 2018. Evaluation of five satellite-based precipitation products in two gauge-scarce basins on the Tibetan Plateau. Remote Sensing, 10 (8), 1316. doi:10.3390/RS10081316
- Bilal, M., Nichol, J.E., and Wang, L., 2017. New customized methods for improvement of the MODIS C6 dark target and deep blue merged aerosol product. Remote Sensing of Environment, 197, 115–124. Elsevier Inc., doi:10.1016/j.rse.2017.05.028
- Chaudhari, K.N. et al., 2006. An inter-comparison of satellite based Noaa Cpc rainfall estimates and gauge observations over selected stations in India. In: Proceedings of ISPRS symposium on geospatial databases for sustainable development, 27–30 September 2006. Goa, India.
- Chen, M., et al., 2008. Assessing objective techniques for gauge-based analyses of global daily precipitation. Journal of Geophysical Research Atmospheres, 113 (4), 1–13. doi:10.1029/2007JD009132
- Cornelissen, T., Diekkrüger, B., and Bogena, H.R., 2016. Using high-resolution data to test parameter sensitivity of the distributed hydrological model hydroGeoSphere. Water (Switzerland), 8 (202), 1–21. doi:10.3390/w8050202
- Darand, M. and Khandu, K., 2020. Statistical evaluation of gridded precipitation datasets using rain gauge observations over Iran. Journal of Arid Environments, 178 (June 2019), 104172. Elsevier. doi:10.1016/j.jaridenv.2020.104172
- Dinh, K.D., et al., 2020. Evaluation of grid-based rainfall products and water balances over the Mekong River Basin. Remote Sensing, 12 (11), 1858. doi:10.3390/rs12111858
- Duong, V.N. and Gourbesville, P., 2016. Model uncertainty in flood modelling. Case study at Vu Gia Thu Bon catchment - Vietnam. Procedia Engineering, 154, 450–458. Elsevier B. V. doi:10.1016/j.proeng.2016.07.537
- Elahi, E., et al., 2017. Direct and indirect effects of wastewater use and herd environment on the occurrence of animal diseases and animal health in Pakistan. Environmental Science and Pollution Research, 24 (7), 6819–6832. doi:10.1007/s11356-017-8423-9
- Elahi, E., et al., 2020. The public policy of agricultural land allotment to agrarians and its impact on crop productivity in Punjab province of Pakistan. Land Use Policy, 90, 104324. doi:10.1016/j.landusepol.2019.104324
- Feng, K., et al., 2020. Evaluating applicability of multi-source precipitation datasets for runoff simulation of small watersheds : a case study in the United. European Journal of Remote Sensing, 1–11. Taylor & Francis. doi:10.1080/22797254.2020.1819169
- Gill, P.E., et al., 1981. Practical optimization. Practical Optimization: Algorithms and Engineering Applications, 1–669. doi:10.1007/978-0-387-71107-2
- Hou, Y., et al., 2014. The global precipitation measurement mission. Bulletin of the American Meteorological Society, 95 (5), 701–722. doi:10.1175/BAMS-D-13-00164.1
- Huffman, G.J., et al., 2007. The TRMM multisatellite precipitation analysis (TMPA): quasi-global, multiyear, combined-sensor precipitation estimates at fine scales. Journal of Hydrometeorology, 8 (1), 38–55. doi:10.1175/JHM560.1
- Huffman, G.J. et al., 2015. NASA global precipitation measurement (GPM) integrated multi-satellite retrievals for GPM (IMERG). Algorithm theoretical basis document (ATBD) version 4.5. November, 26. Available from: https://pmm.nasa.gov/sites/default/files/imce/times_allsat.jpg%0Ahttps://pmm.nasa.gov/sites/default/files/document_files/IMERG_ATBD_V4.5.pdf%0Ahttps://pmm.nasa.gov/sites/default/files/document_files/IMERG_ATBD_V4.5.pdf [Accessed 23 Aug 2020].
- Joyce, R.J., et al., 2004. CMORPH: a method that produces global precipitation estimates from passive microwave and infrared data at high spatial and temporal resolution. Journal of Hydrometeorology, 5 (3), 487–503. doi:10.1175/1525-7541(2004)005<0487:CAMTPG>2.0.CO;2
- Kitagawa, M., 2017. Global-scale evaluation of 22 precipitation datasets using gauge observations and hydrological modeling. Hydrology and Earth System Science, 21 (12), 6201–6217. doi:10.1016/j.nimb.2010.02.072
- Lakshmi, V., Fayne, J., and Bolten, J., 2018. A comparative study of available water in the major river basins of the world. Journal of Hydrology, 567 (September), 510–532. doi:10.1016/j.jhydrol.2018.10.038
- Li, D., et al., 2018. Adequacy of TRMM satellite rainfall data in driving the SWAT modeling of Tiaoxi catchment (Taihu lake basin, China). Journal of Hydrology, 556, 1139–1152. Elsevier B. V. doi:10.1016/j.jhydrol.2017.01.006
- Li, X., et al., 2020. Assessment of GPM IMERG and radar quantitative precipitation estimation (QPE) products using dense rain gauge observations in the Guangdong-Hong Kong-Macao Greater Bay Area, China. Atmospheric Research, 236, 104834. Elsevier. doi:10.1016/j.atmosres.2019.104834
- Liu, Z., et al., 2018. Evaluation of spatial and temporal performances of ERA-interim precipitation and temperature in Mainland China. Journal of Climate, 31 (11), 4347–4365. doi:10.1175/JCLI-D-17-0212.1
- Mararakanye, N., Roux, J.J., and Franke, A.C., 2020. Using satellite-based weather data as input to SWAT in a data poor catchment. Physics and Chemistry of the Earth, 117 (4), 102871. Elsevier Ltd. doi:10.1016/j.pce.2020.102871
- Mekis, E., et al., 2018. An overview of surface-based precipitation observations at environment and climate change Canada. Atmosphere - Ocean, 56 (2), 71–95. Taylor & Francis. doi:10.1080/07055900.2018.1433627
- Mohammed, I.N., et al., 2018. Improved hydrological decision support system for the Lower Mekong River Basin using satellite-based earth observations. Remote Sensing, 10 (6), 885. doi:10.3390/rs10060885
- Molina-Navarro, E., et al., 2017. The impact of the objective function in multi-site and multi-variable calibration of the SWAT model. Environmental Modelling and Software, 93 (7), 255–267. Elsevier Ltd. doi:10.1016/j.envsoft.2017.03.018
- Moore, R.J., 1985. The probability-distributed principle and runoff production at point and basin scales. Hydrological Sciences Journal, 30 (2), 273–297. doi:10.1080/02626668509490989
- Moore, R.J. and Bell, V.A., 2002. Incorporation of groundwater losses and well level data in rainfall-runoff models illustrated using the PDM. Hydrology and Earth System Sciences, 6 (1), 25–38. doi:10.5194/hess-6-25-2002
- Mosaffa, H., et al., 2020. Spatiotemporal variations of precipitation over Iran using the high-resolution and nearly four decades. Remote Sensing, 12 (1584), 1–14. doi:10.3390/rs12101584
- Nelder, J.A. and Mead, R., 1965. A simplex method for function minimization. The Computer Journal, 7 (4), 308–313. doi:10.1093/comjnl/7.4.308
- Nguyen, T.H., Gourbesville, P., and Vo, N.D., 2018. Short-term reservoir system operation for flood mitigation with 1D hydraulic model. EPiC Series in Engineering, 3, 1523. doi:10.29007/jqtw
- Pang, J., et al., 2020. Hydrological evaluation of open-access precipitation data using SWAT at multiple temporal and spatial scales. Hydrology and Earth System Sciences, 24 (7), 3603–3626. doi:10.5194/hess-24-3603-2020710
- Phuong, D.N.D., et al., 2020. Projections of future climate change in the Vu Gia Thu Bon River basin, Vietnam by using statistical downscling model (SDSM). Water, 12 (755), 1–17. doi:10.3390/w12030755
- Sirisena, T.A.J.G., et al., 2018. Effects of different precipitation inputs on streamflow simulation in the Irrawaddy River Basin, Myanmar. Journal of Hydrology: Regional Studies, 19 (4), 265–278. doi:10.1016/j.ejrh.2018.10.005
- Solakian, J., et al., 2019. Investigating the use of satellite-based precipitation products for monitoring water quality in the Occoquan Watershed. Journal of Hydrology: Regional Studies, 26 (9), 100630. Elsevier. doi:10.1016/j.ejrh.2019.100630
- Stocker, T.F., et al., 2013. Climate change 2013 the physical science basis: working group I contribution to the fifth assessment report of the intergovernmental panel on climate change. Climate Change 2013 the Physical Science Basis: Working Group I Contribution to the Fifth Assessment Report of the Intergovernmental Panel on Climate Change, 9781107057, 1–1535. doi:10.1017/CBO9781107415324
- Su, J., et al., 2017. Evaluating the applicability of four latest satellite – gauge combined precipitation estimates for extreme precipitation and streamflow predictions over the upper yellow river basins in China. Remote Sensing, 9 (1176), 1–19. doi:10.3390/rs9111176
- Su, Y., et al., 2020. Spatiotemporal variations of precipitation in China using surface gauge observations from 1961 to 2016ʹ. Atmosphere, 11 (3), 303. doi:10.3390/atmos11030303
- Tarek, M., Brissette, F.P., and Arsenault, R., 2020. Evaluation of the ERA5 reanalysis as a potential reference dataset for hydrological modelling over North America. Hydrology and Earth System Sciences, 24 (5), 2527–2544. doi:10.5194/hess-24-2527-2020
- Taylor, K.E., 2001. Summarizing multiple aspects of model performance in a single diagram. Journal of Geophysical Research, 106 (D7), 7183–7192. doi:10.1029/2000JD900719
- Trang, H.T., et al., 2020. Evaluation of multiple sub-daily satellite precipitation products for Thailand evaluation of multiple sub-daily satellite precipitation products for Thailand. Journal of Sustainable Energy & Environment, 11, 81–91.
- Tuo, Y., et al., 2016. Evaluation of precipitation input for SWAT modeling in Alpine catchment: a case study in the Adige river basin (Italy). Science of the Total Environment, 573, 66–82. The Authors. doi:10.1016/j.scitotenv.2016.08.034
- Vo, N.D., et al., 2018. Comparing model effectiveness on simulating catchment hydrological regime. Advances in Hydroinformatics, (1), 401–414. doi:10.1007/978-981-10-7218-5_28
- Vo, N.D. and Gourbesville, P., 2015. Establishing the flood map for the downstream of Vu Gia-Thu Bon catchment – a coastal region of Viet Nam central. Scale variability of inundation area under the impact of climate change. 36th IAHR world congress - The Hague, Netherlands, 28 June – 3 July, 2015, (June).
- Vo, N.D. and Gourbesville, P., 2018. Flood risk assessment: a view of climate change impact at Vu Gia Thu Bon catchment, Vietnam. Advances in Hydroinformatics. January, 727–737. doi:10.1007/978-981-10-7218-5_52
- Vu, M.T., et al., 2017. Hydro-meteorological drought assessment under climate change impact over the Vu Gia–Thu Bon river basin, Vietnam. Hydrological Sciences Journal, 62 (10), 1654–1668. doi:10.1080/02626667.2017.1346374
- Wu, Z., et al., 2018. Hydrologic evaluation of multi-source satellite precipitation products for the Upper Huaihe River Basin, China. Remote Sensing, 10 (840), 1–21. doi:10.3390/rs10060840
- Xian, L., et al., 2019. Hydrological simulation using TRMM and CHIRPS precipitation Estimates in the Lower Lancang-Mekong River Basin. Chinese Geographical Science, 29 (1), 13–25. doi:10.1007/s11769-019-1014-6
- Zhang, Y., et al., 2018. Evaluation and hydrologic validation of three satellite-based precipitation products in the upper catchment of the Red River Basin, China. Remote Sensing, 10 (12), 1881. doi:10.3390/rs10121881
- Zhang, Y., et al., 2020. Evaluation and comparison of daily GPM/TRMM precipitation products over the Tianshan mountains. Water, 12 (3088), 1–15. doi:10.3390/w12113088
- Zhu, D., et al., 2020. Hydrological evaluation of hourly merged satellite–station precipitation product in the mountainous basin of China using a distributed hydrological model. Meteorological Applications, 27 (2). Wiley. doi:10.1002/met.1909