
 ?Mathematical formulae have been encoded as MathML and are displayed in this HTML version using MathJax in order to improve their display. Uncheck the box to turn MathJax off. This feature requires Javascript. Click on a formula to zoom.
ABSTRACT
The present study aims to explore the potential of multiscalar meteorological drought indices in detecting soil moisture drought events. The standardized soil moisture index (SSMI), standardized precipitation index (SPI), standardized evapotranspiration index (SEI), standardized precipitation evapotranspiration index (SPEI) and multivariate moisture anomaly index (MMAI) were computed using long-term (1980–2015) MERRA-2 soil moisture, precipitation and/or evapotranspiration data products. The performances of the meteorological indices were evaluated based on a zone-wise and spatial correlation approach along with failure rate (FR) and false alarm rate (FAR) values. The spatial correlation was highest in SEI, followed by MMAI, in comparison to SPI and SPEI. FR and FAR values indicated that SEI is the best index for detecting soil moisture drought events, whereas MMAI outperformed the other indices in representing combined drought events, i.e. meteorological or/and soil moisture droughts. The outcome of the study may be useful in retrieving information about soil moisture drought over a region using only meteorological parameters.
Editor A. Fiori ; Associate editor D. Bressiani
1 Introduction
Drought, a widespread hydroclimatic extreme leading to agricultural as well as societal catastrophe, is considered the costliest of all natural disasters (Wilhite Citation2000, Dai Citation2013, NCEI Citation2016). Although there is some controversy over changes in drought during the last few decades (Sheffield et al. Citation2012, Dai Citation2013, Damberg and AghaKouchak Citation2014), increasing drought intensity and magnitude are evident in most parts of the world (Masih et al. Citation2014). The rising temperature from global warming may not lead directly to drought, but drought incidences may produce concomitant alterations in the rate of global warming (Trenberth et al. Citation2014).
At the global scale, the economic losses due to drought may amount to several billions of US dollars (Wilhite Citation2000). According to Murthy and SeshaSai (Citation2010), agriculture over 58.6 million hectares in India was damaged due to drought incidence in 1987, and more than 250 million people were directly or indirectly affected. Similarly, one of the worst drought incidences in the Indian region during 2002 led to a reduction in the crop sown area by ~12 million hectares and an associated food grain production loss of ~48 million tons (Murthy and SeshaSai Citation2010). Hence, clear understanding, proper monitoring and objective damage assessments of drought incidences are essential for developing sustainable management plans towards minimizing the impacts of drought.
For ease of understanding and management, droughts are broadly categorized into (i) meteorological, (ii) agricultural, (iii) hydrological and (iv) socio-economic droughts. However, recent studies have highlighted the importance of soil moisture in regulating drought conditions (Seneviratne Citation2012, Teuling et al. Citation2013, AghaKouchak Citation2014). Being a key component of both the water and energy cycles, alterations in soil moisture directly impact the agricultural system as well as water availability (Wang et al. Citation2011). Hence, “soil moisture drought” is a new addition to the list of drought categories. It generally arises as a consequence of meteorological drought and may lead to agricultural drought (Wang et al. Citation2011, Mishra et al. Citation2015, Halwatura et al. Citation2017, Zhang et al. Citation2017, Manning et al. Citation2018, Blyverket et al. Citation2019). Soil moisture drought is generally defined as a deficit in moisture within the upper soil layer relative to its normal value (Manning et al. Citation2018). It generally arises due to deviations in the supply and demand components of the water cycle, i.e. the antecedent precipitation and evapotranspiration (Teuling et al. Citation2013). However, the individual influence of these two components is regulated by the complex interactions of several land-atmospheric processes. Hence, the quantification and monitoring of soil moisture drought may enhance our understanding of the transformation of meteorological to agricultural drought and may improve simulations of agricultural drought scenarios based on meteorological records and information.
Soil moisture drought information is generally derived from physical land-surface models and empirical indices (Mitchell et al. Citation2004, Sheffield et al. Citation2014, Manning et al. Citation2018). Several soil moisture drought indices incorporating soil moisture information have been proposed by researchers, such as the soil moisture drought index (Hollinger et al. Citation1993), soil moisture deficit index (Narasimhan and Srinivasan Citation2005), standardized soil moisture index (Hao and AghaKouchak Citation2013), soil water deficit index (Martínez-Fernández et al. Citation2015), drought severity index (Cammalleri et al. Citation2016), soil moisture anomaly percentage index (Mao et al. Citation2017), etc. However, the applications of these drought indices are limited due to the sparse density or unavailability of long-term soil moisture data (Zawadzki and Kędzior Citation2016). On the other hand, the physical models used to simulate soil moisture are very data intensive, requiring e.g. location-specific soil properties, information regarding irrigation availability and infrastructure, long-term meteorological parameters, etc. Moreover, the approximations of several processes and the unavailability of reliable datasets add more uncertainty to the estimation of accurate soil moisture data (Chowdhary and Singh Citation2010, Wang et al. Citation2016). Hence, it is necessary to develop simpler drought indices that are less data intensive, that involve simple computation and, more importantly, can be computed using meteorological parameters only.
The multiscalar drought indices, such as the standardized precipitation index (SPI), standardized precipitation evapotranspiration index (SPEI), etc., were found to perform better than other drought indices considering a two-layer bucket model (Wang et al. Citation2015). Recent studies have also highlighted the importance of integrating temperature in drought indices to address the multivariate nature of soil moisture drought (Teuling et al. Citation2013, AghaKouchak Citation2014, Manning et al. Citation2018). Drought indices such as the Palmer drought severity index (Palmer Citation1965), SPEI (Vicente-Serrano et al. Citation2010), reconnaissance drought index (RDI; Tsakiris and Vangelis Citation2005) and multivariate moisture anomaly index (MMAI; Das et al. Citation2017) consider the temperature component in terms of evapotranspiration while capturing the impact of both precipitation and temperature on drought conditions in changing climate scenarios.
Therefore, the present study aims to explore the potential of several multiscalar meteorological drought indices in detecting soil moisture droughts over the Indian region using long-term soil moisture and meteorological parameters.
2 Study area
The study was been conducted over the Indian mainland (), i.e. between 08°04ʹ and 37°06ʹN latitude and between 68°07ʹ and 97°25ʹE longitude. Agriculture, being the direct source of livelihood for more than 50% of the population and a major contributor to the national economy (i.e. 17–18% of gross value added), plays a key role in India’s sustainability and development. Around 68% of the country’s agricultural area – covering ~278 districts of 11 states – is prone to drought-like situations (Nandakumar Citation2009, Nagaraja Citation2012).
Figure 1. The study area with its meteorological regions, viz. northwest, central, northeast and peninsular India
Winter (January–February), pre-monsoon (March–May), monsoon (June–September) and post-monsoon (October–December) are the major seasons of the Indian mainland (www.imdpune.gov.in). Around 80% of the total rainfall is generally received during monsoon season (Sahai et al. Citation2003). Based on the mean long-term rainfall and its variability, the Indian mainland is generally classified into four homogeneous regions, i.e. northeast, northwest, central and peninsular India (Guhathakurta et al. Citation2014). The annual average rainfall values (% standard deviation) are 1324.6 (11%), 618.7 (19%), 976.4 (14%) and 730.5 (15%) mm for northeast, northwest, central and peninsular India, respectively.
3 Data and methodology
3.1 Data processing
The long-term (1980–2015) total surface precipitation (PRECTOT), evapotranspiration (EVLAND) and total profile soil moisture content (PRMC) from the Modern-Era Retrospective analysis for Research and Applications-2 (MERRA-2) were downloaded from the Goddard Earth Sciences Data and Information Services Centre (http://disc.sci.gsfc.nasa.gov/mdisc/). The soil moisture data from MERRA-Land reanalysis were used, as it provides improved modelled soil moisture data compared with the regular MERRA model for hydrological studies (Reichle et al. Citation2011). The use of more accurate precipitation forcing along with improved catchment surface models is the key to the improved output over the regular MERRA model. The datasets are available in a ½° (latitude) by ⅔° (longitude) grid at a monthly interval for the period 1979–2015. The datasets are downloaded in netcdf (.nc) format, and further spatial subsetting was carried out to restrict our study to the Indian mainland.
Many previous studies have been carried out on the validation of the MERRA-2 soil moisture products using in situ soil moisture data (Reichle et al. Citation2011, Citation2017, Yi et al. Citation2011, Liu et al. Citation2014, Bosilovich et al. Citation2015). The studies revealed that the MERRA-derived soil moisture corresponds favourably with in situ observations; moreover, its advantages over Advanced Microwave Scanning Radiometer on the Earth Observing System (AMSR-E) soil moisture products were also established because it is less limited by dense vegetation (Yi et al. Citation2011). Another study, carried out by Liu et al. (Citation2014), showed that the MERRA data were closest to the climatological observations of all five models derived from re-analysed soil moisture products, viz. MERRA, ERA-Interim (ERA), Japanese 25-year Reanalysis (JRA), Climate Forecast System Reanalysis (CFSR) and National Centers for Environmental Prediction (NCEP).
Similarly, validation of MERRA-2 soil moisture products using 220–320 in situ measurements across North America, Europe and Australia demonstrated its efficiency in representing surface as well as root zone soil moisture (Reichle et al. Citation2017). Based on the average anomaly correlation and unbiased Root Mean Square Error (RMSE) calculated using the in situ soil moisture data from 140 network sites, the MERRA-2 soil moisture was found to be best, with improved soil moisture dynamics, among various reanalysed data products (Reichle et al. Citation2011, Bosilovich et al. Citation2015). A recent study by Modanessi et al. (Citation2020) over parts of India concluded that MERRA-2-derived soil moisture is capable of explaining drought incidence and its impact on crops. Similarly, high agreement between the agricultural drought information derived from satellite images and soil moisture drought derived from MERRA-2 data for several drought and normal years during the last 34 years was reported for all of India (Das et al. Citation2020).
3.2 Preparation of standardized indices
The long-term precipitation and evapotranspiration data were transformed into a 6-month standardized precipitation index (SPI) and standardized evapotranspiration index (SEI), respectively. A very small time period may not able to capture the drought occurrence, whereas a much longer period may provide redundant information (Tornros and Menzel Citation2014). Hence, many researchers have recommended a time period of 3 to 6 months for soil moisture drought studies (Tornros and Menzel Citation2014, Manning et al. Citation2018). According to the World Meteorological Organization (WMO Citation2012), soil moisture or agricultural conditions respond to precipitation anomalies on a relatively short time scale, which generally varies from 3 to 6 months. Hence, in the present study the 6-month time period was selected, considering the probable resilience of the soil systems. The gamma probability distribution was adopted for calculating SPI, whereas log-logistic distribution was selected for SEI (McKee et al. Citation1993, Das et al. Citation2017). As suggested by Das et al. (Citation2017), the SEI values were multiplied by −1 to bring them into the same scale (sign) as SPI.
Subsequently, two recently developed drought indices, i.e. SPEI and MMAI, integrating both precipitation and evapotranspiration to represent anomalous drought or moisture conditions, were computed using the methodology described by Vicente-Serrano et al. (Citation2010) and Das et al. (Citation2017), respectively. The SPEI, representing a simple climatic water balance, was calculated by fitting 6-monthly aggregated differences between precipitation and evapotranspiration into a log-logistic probability distribution function. According to Das et al. (Citation2017), the MMAI is more efficient than SPEI in capturing the impact of both precipitation and evapotranspiration in representing anomalous moisture conditions. The MMAI was computed by coupling two univariate variables, i.e. SPI and SEI, using a joint probability distribution function. For details of MMAI one may refer to Das et al. (Citation2017).
Unlike SPI and SEI, the standardized soil moisture index (SSMI) was calculated by fitting the 6-month aggregated soil moisture data into a non-parametric empirical probability distribution function, rather than any specific distribution function, i.e. parametric (Farahmand and AghaKouchak Citation2015). In the present study, the marginal distribution of soil moisture was derived using the empirical Gringorten plotting position (Gringorten Citation1963):
where n and i represent the sample size and rank of non-zero soil moisture data in ascending order. p(xi) is the corresponding empirical probability. The SSMI was computed by fitting the output of EquationEquation (1)(1)
(1) into the following equation:
Where ϕ−1 represents the normal distribution function, and p denotes the probability values derived from Equation (1).
The scale of all the standardized indices, i.e. SPI, SEI, SPEI, MMAI and SSMI, ranges between −4 and +4. Negative values denote drought or anomalous moisture conditions, whereas positive values indicate normal or wetter conditions.
3.3 Evaluation of drought indices with respect to soil moisture droughts
The agreement between the soil moisture drought information, i.e. SSMI, and other meteorological drought indices, i.e. SPI, SEI, SPEI, MMAI, were analysed using both zone-wise and spatial correlation techniques. Subsequently, the efficiencies of all meteorological indices to detect soil moisture drought were calculated using the failure rate (FR) and the false alarm rate (FAR), as suggested by Halwatura et al. (Citation2017).
FR denotes the proportion of drought events that were not detected by meteorological indices, i.e. SPI or SPEI or SEI or MMAI, but that were soil moisture drought conditions based on SSMI values of less than minus one, i.e. SSMI < −1. Minimum FR values indicate a better capability of detecting soil moisture drought conditions.
where SSMIn is the number of droughts based on SSMI and SIn is the number of drought occurrences based on meteorological indices.
On the other hand, FAR represents the proportion of drought events that were detected by meteorological indices, i.e. SPI or SPEI or SEI or MMAI, but that were not actually soil moisture drought conditions. Again, lower FAR values denote the ability to reduce error in detecting soil moisture drought incidents.
Hence, FR and FAR are tools for estimating under- and overperformances of the target index.
3.4 Lag-correction in time-series drought indices with respect to SSMI
Based on the resilience of systems, meteorological drought may or may not transform into soil moisture drought. Moreover, the transformation may not be immediate; it may be delayed. Hence, in the present study, the existing response lags for all meteorological indices to SSMI time-series data were estimated over each grid. The lag existing in the time-series meteorological indices for an individual grid was tested based on maximum correlation values within the range of −5 to +5 months with respect to the time-series SSMI. Based on the lag information, the time-series meteorological indices were adjusted for all grids, to eliminate the response lag towards overcoming the probable reason for underperformance of some of the indices. Further, the lag-adjusted meteorological indices were tested for their agreement and their efficiency in representing soil moisture drought, using correlation statistics and estimated FR and FAR values. Details of the entire methodology are provided in .
Figure 2. Schematic diagram of the overall methodology
4 Results and discussion
4.1 Spatial correlation of meteorological indices with SSMI
Coefficients of correlation between SSMI and the other meteorological drought indices, i.e. SPI, SPEI, MMAI and SEI, were estimated to find the agreement among the different indices over an individual grid. Higher (lower) correlation values generally denote a better (worse) representation of soil moisture drought conditions. The correlation coefficient values generally ranged between 0.5 and 0.9 over the Indian mainland for SPI and SPEI (). It was interesting to find that the correlation values as well as their spatial distribution were similar for SPI and SPEI. The lower values of 0.5–0.6 were distributed over the western coast and parts of eastern as well as central India, whereas the higher values of >0.7 were mainly confined to northwestern Indian and parts of peninsular India. However, in major parts of the Indian mainland, the correlation values between SSMI and SPI or SPEI were within 0.6 to 0.7.
Figure 3. Maps of the spatial correlation between SSMI and (a) SPI, (b) SPEI, (c) MMAI and (d) SEI
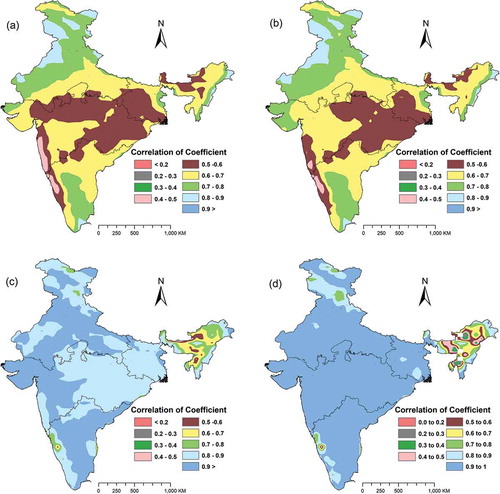
In the case of MMAI, the values were >0.8 over major parts of India, except for northeastern India where correlation values varied between 0.5 and 0.8 (). The northeastern region is dominated by high orographic rainfall associated with steep slopes due to the mountainous landscape, which may be the reason for the relatively poor association between precipitation and soil moisture over that region. The correlation between SSMI and SEI was found to be the highest, i.e. >0.9, among all meteorological drought indices over the Indian region except for parts of northeastern India.
According to Halwatura et al. (Citation2017), the estimated correlation values between soil moisture drought and SPI were within a range of 0.36 to 0.69 for different sites over Eastern Australia, whereas for RDI (an index incorporating precipitation and evapotranspiration), the correlation coefficient was found to be lower. Similar results, with correlation values of less than 0.70 between SPI and soil moisture, were obtained by Gwak et al. (Citation2017) and Budi et al. (Citation2008). The SPEI works similarly to or better than SPI to represent soil moisture drought, with correlation values ranging from 0.6 to 0.9 for different sites at optimum time scales (Wang et al. Citation2015). Das et al. (Citation2017) found that SPEI largely represented the SPI only and was unable to capture the impact of evapotranspiration in characterizing moisture anomaly conditions over the Indian region.
4.2 Evaluation of meteorological drought indices
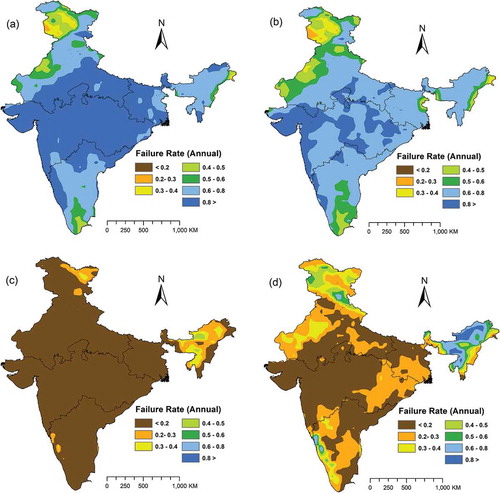
The FR values of different indices represent their ability to detect soil moisture drought using meteorological parameters alone. Lower (higher) FR values indicate greater (worse) capability to represent soil moisture drought. In the case of SPI, the FR values were mainly above 0.8 in parts of eastern as well as central India, whereas some portions of northwestern India and parts of peninsular India had values of 0.6–0.8 (). In the case of SPEI, the FR values were found to be relatively lower, i.e. 0.6–0.8, in the majority of the area, with some isolated patches of higher FR values, i.e. >0.8, over the western coast and lower FR values, i.e. <0.5, over the northeastern region. When using MMAI to detect the soil moisture drought, the FR values were found to be less than 0.2 over the entire Indian mainland except for some parts of northeastern India. In the case of SEI, the FR values were much lower than those for SPI and SPEI, i.e. <0.2 to 0.3, representing soil moisture droughts with better accuracy than SPI or SPEI (). However, FR values of >0.6 were also observed in some parts of northeastern India. Hence, based on FR values, MMAI was found to be best suited for detecting soil moisture drought incidents, followed by SEI.
Figure 4. Maps of the failure rate of (a) SPI, (b) SPEI, (c) MMAI and (d) SEI in detecting soil moisture drought
Similar to FR, lower FAR values indicate a better ability of the indices to represent soil moisture drought conditions. shows that according to FAR also, the performances of SPI and SPEI were poorer among the four selected meteorological drought indices. The values mainly ranged from 0.6 to >0.8, with some lower FAR values mainly confined to northern and peninsular India. In the case of MMAI, the FAR values were found to be lower than those for SPI and SPEI; however, the distribution of patches of higher and lower FAR values was almost identical to that of SPI and SPEI (). In contrast to the FR results, the FAR values for SEI indicated it outperformed MMAI in representing soil moisture drought. The values mainly varied between <0.2 to 0.3, indicating fewer overestimations of soil moisture drought incidences in comparison to the other indices.
Figure 5. Maps of the false alarm rate of (a) SPI, (b) SPEI, (c) MMAI and (d) SEI in detecting soil moisture drought
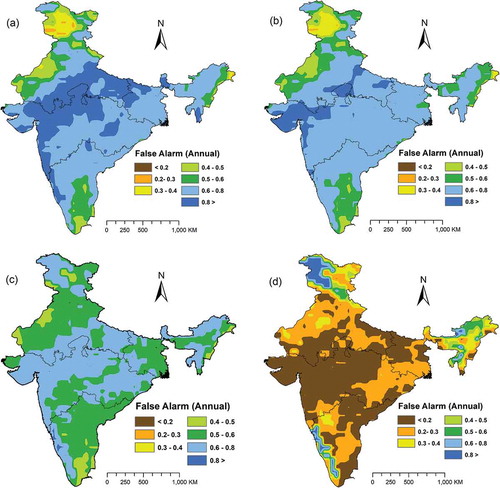
According to Halwatura et al. (Citation2017), the aim is to achieve lower FR and FAR rates for meteorological indices to detect the soil moisture drought incidences. In the present study, based on the analysis of both FR and FAR values, it was inferred that SPI and SPEI were unable to detect all of the soil moisture drought occurrences – which were as high as 80% of the total incidences. Moreover, the SPI and SPEI detected some drought events that were not actually drought incidences based on SSMI values. The overestimations were on the order of 60–80% of the total estimations. The FR and FAR values for SPI corroborate the findings of Halwatura et al. (Citation2017). It is interesting that MMAI was found to be the most efficient in detecting soil moisture drought incidences with more than 80% accuracy; however, it overestimates drought conditions on the order of 50–80%. On the other hand, the SEI could identify soil moisture drought occurrences very efficiently, with both FR and FAR values of less than 30% over major parts of the Indian mainland. Hence, for detecting soil moisture drought incidences using meteorological parameters alone, SEI was found to be the most efficient, followed by MMAI.
The false prediction of soil moisture drought events, i.e. overestimating the drought frequency, remains the major concern for using meteorological indices (Touchan et al. Citation2005, Törnros and Menzel Citation2014). An extreme rainfall deficit and high potential evapotranspiration (PET) are generally prevalent over transition climate regions between wet and dry climates, such as the Indian region, where the land-atmospheric interactions have a major impact on soil moisture droughts (Seneviratne et al. Citation2006, Seneviratne Citation2012). However, oversimplification of the land-atmosphere interactions may be one reason for the underperformance of SPI and SPEI (Shiau Citation2006, Seneviratne Citation2012). The soil type specific to a site has immense importance in governing the soil moisture drought phenomenon (Wang et al. Citation2015). Unlike SPEI, MMAI is developed by optimizing the interactions between precipitation and PET in an individual grid over the entire study region (Das et al. Citation2017). The better performance of SEI, on the other hand, can perhaps be attributed to the stronger and linear influence of PET on the soil moisture minima over the region (Khalili et al. Citation2011, Asadi Zarch et al. Citation2015, Halwatura et al. Citation2017).
4.3 Performances of meteorological drought indices for representing combined drought conditions
Generally, different kinds of droughts – meteorological, soil moisture, agricultural and hydrological droughts – occur in a sequence. However, one kind of drought does not necessarily transform into another, based on the resilience or buffering capacity of the systems. Hence, although these kinds of droughts are interdependent, the occurrences of one kind of drought are independent. Likewise, in the present study meteorological and soil moisture droughts may occur simultaneously, or only one may occur in a given season or year. The concept of combined or cumulative drought was proposed to address the overall drought occurrences, i.e. either meteorological (SPI < −1) or soil moisture drought (SSMI < −1). Hao and AghaKouchak (Citation2013) proposed a multivariate standardized drought index (MSDI) for characterizing combined drought conditions, by coupling SPI and SSMI.
In the present study, the combined drought occurrences were estimated by considering a union of meteorological and soil moisture droughts – that is, a drought was considered a combined drought if it was either a meteorological or a soil moisture drought. The combined drought conditions were analysed to address the overestimations of soil moisture drought incidences by different meteorological indices. Subsequently, the FR and FAR values were estimated for all the meteorological drought indices to evaluate their capability in retrieving combined drought information.
Similar to soil moisture drought, both the SPI and SPEI were unable to detect the combined drought conditions; they produced FR values of more than 60% in most parts of India (). In contrast to our earlier finding that SEI was capable of representing soil moisture drought, SEI failed to detect combined drought in more than 50% cases over almost the entire Indian region. In the case of combined drought conditions, meteorological drought is contributing along with soil moisture drought. In meteorological drought, although evapotranspiration has a role to play, precipitation makes a greater contribution. In SEI computation, the direct precipitation component is missing. Hence SEI was unable to represent meteorological drought or the combined drought very efficiently, as it could perform only in the case of soil moisture drought events.
Figure 6. Maps of the failure rate of (a) SPI, (b) SPEI, (c) MMAI and (d) SEI in detecting combined drought events, i.e. meteorological or/and soil moisture drought
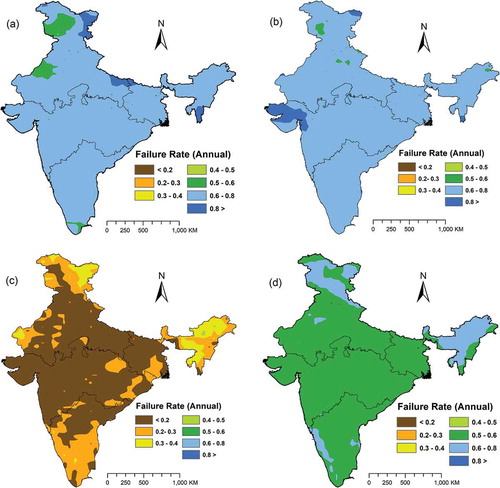
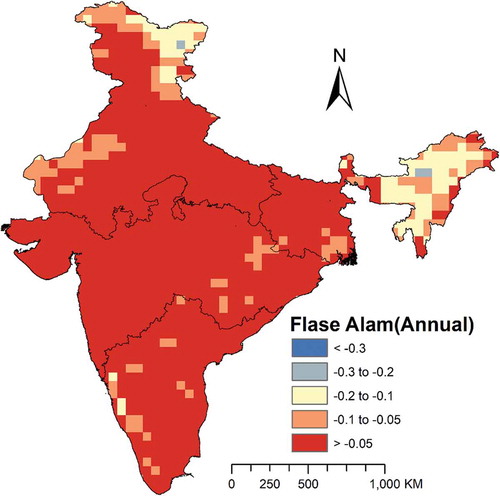
However, it was observed that MMAI could successfully capture the combined drought conditions with an accuracy of generally more than 80% (). Unlike soil moisture drought, the FAR values for MMAI were found to be very low, signifying that there was hardly any overestimation of combined drought conditions (). In the case of MMAI computation, both the evapotranspiration and the precipitation were used. Hence, MMAI was able to represent the combined drought more efficiently compared to other indices.
Figure 7. Maps of the false alarm rate of MMAI in detecting combined drought events, i.e. meteorological or/and soil moisture drought
Drought is considered a multivariate compound event, which generally develops due to the joint dependent concurrence of different extreme events, such as precipitation, PET, etc. (Leonard et al. Citation2014, Bevacqua Citation2017, Manning et al. Citation2018). According to Hao and AghaKouchak (Citation2013), information on different variables, such as precipitation and PET, is important for proper characterization of drought. The present study demonstrates that compound drought events, combining extremes of precipitation, evapotranspiration and soil moisture, can be successfully detected by MMAI. The findings are in line with a previous study carried out by Das et al. (Citation2017), in which the improved efficiency of MMAI over other drought indices in capturing the impact of both rainfall and PET for characterizing drought events was established.
4.4 Lag-adjustments of different meteorological indices with respect to time-series SSMI
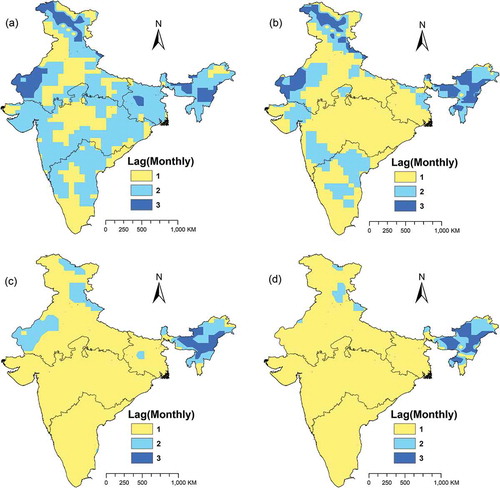
The temporal adjustments of four meteorological indices were carried out based on their maximum correlation coefficient values for a window of −5 to +5 months with respect to SSMI. It was observed that the maximum agreement with SSMI, in terms of correlation coefficients, was achieved by adjusting the lag by 1–2 months for different indices (). In the case of SPI, a 2-month lag was observed over major parts of the Indian region, whereas for the other three indices only a 1-month lag was seen, except in the northeastern region where 2–3 months’ lag was observed.
Figure 8. Lag (month) of time-series (a) SPI, (b) SPEI, (c) MMAI and (d) SEI with respect to SSMI
The spatial correlation, FR and FAR were estimated using lag-adjusted meteorological drought indices to evaluate their potential in representing both soil moisture and combined drought conditions. It was observed that the spatial correlation increased in both SPI and SPEI by around 10%, but this was mainly confined to the grids with correlation coefficients of 0.5 to 0.7. In grids with higher correlation coefficients, along with SEI and MMAI, hardly any differences were observed (figure not shown). Interestingly, there was also no significant improvement in the FR and FAR values after adopting the lag-adjusted indices.
Hence, it can be inferred that the temporal adjustments could increase the spatial correlation of some indices with SSMI over some selected parts of the Indian region; however, the performances of the meteorological drought indices in representing the soil and combined drought conditions remain virtually unaltered. The lag analysis confirmed that the response lag between SPI/SPEI and SSMI may not be the reason for its underperformance when representing the soil moisture drought events.
4.5 Zone-wise performances of meteorological drought indices
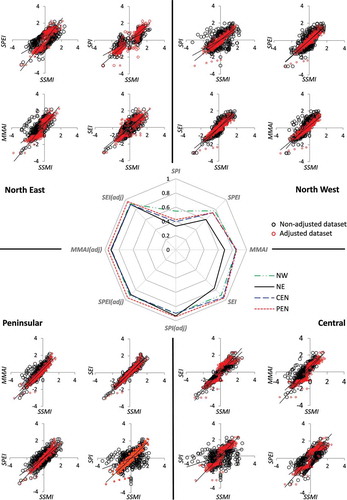
The web plot in shows the performances of the meteorological drought indices over different homogeneous meteorological zones for both non-adjusted and lag-adjusted datasets. Among the different zones, northeastern India showed relatively lower correlation values with SSMI for all the meteorological indices, whereas after adjusting the lag the differences were negligible. The performances of all indices were comparable in the other three zones, i.e. northwestern, central and peninsular India, in both non-adjusted and lag-adjusted indices. Interestingly, the correlation values increased for SPI and SPEI after lag adjustments in all zones, but this change was not significant for MMAI or SEI. These observations corroborate our findings discussed in Section 4.4.
Figure 9. Zone-wise correlation curves between SSMI and (a) SPI, (b) SPEI, (c) MMAI and (d) SEI for both non-adjusted and lag-adjusted datasets
The zone-wise mean FR and FAR statistics for both soil moisture drought and combined drought are presented in . The results agree with our earlier findings that the FR values were lowest in MMAI when representing both kinds of droughts, i.e. soil moisture drought and combined drought; however, it overestimated the soil moisture drought. Hence, SEI was selected as the best meteorological index for representing soil moisture drought, based on its lower FR and FAR values. But in the case of combined drought conditions, the MMAI outperformed all other indices, with the lowest FR and negligible FAR values in all four meteorological zones. The trends were similar in the non-adjusted and lag-adjusted datasets.
Table 1. Zone-wise failure rate and false alarm rate of different meteorological drought indices for representing soil moisture drought and combined drought events
5 Conclusions
In the present study, the performances of multiscalar meteorological drought indices in detecting soil moisture drought conditions were evaluated. The spatial correlations of SPI and SPEI with SSMI were found to be lower, i.e. 0.5 to 0.7, over major parts of the Indian mainland, whereas correlation coefficients were highest for SEI, i.e. >0.9, in most areas (except some isolated parts of northeastern India). For MMAI, the correlation coefficient values were slightly lower (>0.8) than for SEI; however, they were significantly higher than those for both SPI and SPEI. It was interesting to find that SPI and SPEI displayed almost identical behaviour, along with similar lower and higher correlation patches.
In terms of the multivariate meteorological drought indices’ performance in representing soil moisture drought based on FR and FAR, both SPI and SPEI failed, with FR and FAR values >80% in major parts of the Indian region. In the case of MMAI, although the FR values were the lowest among the indices, the FAR values were much higher, indicating overestimation of soil moisture drought events. Hence, SEI was selected as the best index to detect soil moisture drought, based on its lower FR and FAR values. However, the MMAI was found to outperform the other indices in simulating the combined drought events, i.e. either meteorological or soil moisture drought events. Thus, we conclude that SEI may be used to detect soil moisture drought, whereas MMAI would be a better choice for representing combined drought events. The time-series lags in the indices with respect to SSMI were adjusted, and we found that although the spatial correlations of SPI and SPEI were improved, no significant improvements in the performances of all indices were observed based on FR and FAR values. The zone-wise correlation results corroborated the earlier findings.
Acknowledgements
The authors are thankful to Dr Santanu Chowdhury, Dr Uday Raj and Dr D. Dutta for their continuous support and encouragement during the investigation. We also acknowledge the support received from BITS, Mesra and RRSC-East staffs during manuscript preparation. We duly acknowledge NASA GMAO for providing long-term MERRA-2 data. The authors are grateful to the anonymous reviewers for their constructive suggestions.
Disclosure statement
No potential conflict of interest was reported by the authors.
References
- AghaKouchak, A., 2014. A baseline probabilistic drought forecasting framework using standardized soil moisture index: application to the 2012 United States drought. Hydrology and Earth System Sciences, 18 (7), 2485–2492. doi:10.5194/hess-18-2485-2014
- Asadi Zarch, M.A., Sivakumar, B., and Sharma, A., 2015. Droughts in a warming climate: a global assessment of Standardized Precipitation Index (SPI) and Reconnaissance Drought Index (RDI). Journal of Hydrology, 526, 183–195. doi:10.1016/j.jhydrol.2014.09.071
- Bevacqua, E., 2017. CD VineCopulaConditional: sampling from conditional C- and D-vine copulas. R package, version 0.1.0. Availabe from: https://CRAN.R-project.org/package5CDVineCopulaConditional
- Blyverket, J., et al., 2019. Monitoring soil moisture drought over northern high latitudes from space. Accessed 26 June 2019. Availabe from: https://www.preprints.org/manuscript/201904.0009/v1
- Bosilovich, M.G., et al., 2015. MERRA-2: initial evaluation of the climate. In: R.D. Koster eds. Technical report series on global modeling and data assimilation. Vol. 43. NASA/TM–2015-104606/Vol. 43. Maryland: Goddard Space Flight Centre Greenbelt, 139.
- Budi, H.N., Sudibyakto, H.A., and Jetten, V.G. 2008. Drought monitoring using rainfall data and spatial moisture modeling. Thesis submitted Gadjah Mada University, International Institute for Geo-information, Science and Earth Observation.
- Cammalleri, C., Micale, F., and Vogt, J., 2016. A novel soil moisture-based Drought Severity Index (DSI) combining water deficit magnitude and frequency. Hydrological Processes, 30 (2), 289–301. doi:10.1002/hyp.10578
- Chowdhary, H. and Singh, V.P., 2010. Reducing uncertainty in estimates of frequency distribution parameters using composite likelihood approach and copula-based bivariate distributions. Water Resources Research, 46 (11), 1–23, W11516. doi:10.1029/2009WR008490
- Dai, A.G., 2013. Increasing drought under global warming in observations and models. Nature Climate Change, 3 (1), 52–58. doi:10.1038/nclimate1633
- Damberg, L. and AghaKouchak, A., 2014. Global trends and patterns of drought from space. Theoretical and Applied Climatology, 117 (3–4), 441–448. doi:10.1007/s00704-013-1019-5
- Das, P.K., et al., 2017. Characterizing Indian meteorological moisture anomaly condition using long-term (1901–2013) gridded data: a multivariate moisture anomaly index approach. International Journal of Climatology, 38 (S1), 144–159. doi:10.1002/joc.5359
- Das, P.K., et al., 2020. Quantification of agricultural drought over Indian region: a multivariate phenology-based approach. Natural Hazards, 101, 255–274. doi:10.1007/s11069-020-03872-6
- Farahmand, A. and AghaKouchak, A., 2015. A generalized framework for deriving nonparametric standardized drought indicators. Advances in Water Resources, 76, 140–145. doi:10.1016/j.advwatres.2014.11.012
- Gringorten, I.I., 1963. A plotting rule for extreme probability paper. Journal of Geophysical Research, 68 (3), 813–814. doi:10.1029/JZ068i003p00813
- Guhathakurta, P., et al., 2014. Observed changes in southwest monsoon rainfall over India during 1901–2011. International Journal of Climatology. doi:10.1002/joc.4095
- Gwak, Y.S., et al., 2017. The relationships between drought indices (SPI, AQPI) and in-situ soil moisture in forested hill slopes. WIT Transactions on Ecology and the Environment. 220. doi:10.2495/WRMI170211
- Halwatura, D., et al., 2017. Capability of meteorological drought indices for detecting soil moisture droughts. Journal of Hydrology: Regional Studies, 12, 396–412.
- Hao, Z. and AghaKouchak, A., 2013. Multivariate standardized drought index: a parametric multi-index model. Advances in Water Resources, 57, 12–18. doi:10.1016/j.advwatres.2013.03.009
- Hollinger, S.E., Isard, S.A., and Welford, M.R., 1993. A new soil moisture drought index for predicting crop yields. In: Eighth conference on applied climatology. Anaheim, CA: American Meteorological Society, 187–190. Preprints.
- Khalili, D., et al., 2011. Comparability analyses of the SPI and RDI meteorological drought indices in different climatic zones. Water Resource Management, 25 (6), 1737–1757. doi:10.1007/s11269-010-9772-z
- Leonard, M., et al., 2014. A compound event framework for understanding extreme impacts. Wiley Interdiscip. Rev.: Climate Change, 5, 113–128. doi:10.1002/wcc.252
- Liu, L., Zhang, R., and Zuo, Z., 2014. Intercomparison of spring soil moisture among multiple reanalysis data sets over eastern China. Journal of Geophysical Research: Atmospheres, (119), 54–64. doi:10.1002/2013JD020940
- Manning, C., et al., 2018. Soil moisture drought in Europe: a compound event of precipitation and potential evapotranspiration on multiple time scales. Journal of Hydrometorology, 19, 1255–1271. doi:10.1175/JHM-D-18-0017.1
- Mao, Y., et al., 2017. Spatio-temporal analysis of drought in a typical plain region based on the soil moisture anomaly percentage index. Science of Total Environment, 576, 752–765. doi:10.1016/j.scitotenv.2016.10.116
- Martínez-Fernández, J., et al., 2015. A soil water based index as a suit-able agricultural drought indicator. Journal of Hydrology, 522, 265–273. doi:10.1016/j.jhydrol.2014.12.051
- Masih, I., et al., 2014. A review of droughts on the African continent: a geospatial and long term perspective. Hydrology and Earth System Sciences, 18 (9), 3635–3649. doi:10.5194/hess-18-3635-2014
- McKee, T.B., Doesken, N.J., and Kliest, J., 1993. The relationship of drought frequency and duration to timescales. In: Proceedings of the 8th conference on applied climatology, January 17–22. Anaheim, CA: American Meteorological Society, 179–184. Boston, MA.
- Mishra, A.K., et al., 2015. Anatomy of a local-scale drought: application of assimilated remote sensing products, crop model, and statistical methods to an agricultural drought study. Journal of Hydrology, 526, 15–29. doi:10.1016/j.jhydrol.2014.10.038
- Mitchell, K.E., et al., 2004. The multi-institution North American Land Data Assimilation System (NLDAS): utilizing multiple GCIP products and partners in a continental distributed hydrological modeling system. Journal of Geophysical Research, 109, D07S90. doi:10.1029/2003JD003823
- Modanessi, S., et al., 2020. Do satellite surface moisture observations better retain information about crop-yield variability in drought conditions? Water Resources Research, 56, e2019WR025855. doi:10.1029/2019WR025855
- Murthy, C.S. and SeshaSai, M.V.R., 2010. Agricultural drought monitoring and assesment. In: P.S. Roy, R.S. Dwivedi, and D. Vijayan, eds. Remote sensing applications. National Remote Sensing Centre, Indian Space Research Organization, Department of Space, Government of India, 303–330.
- Nagaraja, B.C., 2012. Impact of drought on agriculture: challenges facing poor farmers of Karnataka, south India. Karnataka: Department of Environmental Science, Bangalore University.
- Nandakumar, T., 2009. Manual for drought management. New Delhi: Department of Agriculture and Cooperation, Ministry of Agriculture, Government of India.
- Narasimhan, B. and Srinivasan, R., 2005. Development and evaluation of soil moisture deficit index (SMDI) and evapotranspiration deficit index (ETDI) for agricultural drought monitoring. Agriculture and Forest Meteorology, 133, 69–88. doi:10.1016/j.agrformet.2005.07.012
- NCEI, 2016. Billion-dollar weather and climate disasters. Accessed 26 June 2019. Available from: www.ncdc.noaa.gov/billions
- Palmer, W.C., 1965. Meteorological drought. Research Paper No. 45. US Department of Commerce. Washington, DC: Weather Bureau.
- Reichle, R.H., et al., 2011. Assessment and enhancement of MERRA land surface hydrology estimates. Journal of Climate, 24, 6322–6338. doi:10.1175/JCLI-D-10-05033.1
- Reichle, R.H., et al., 2017. Assessment of MERRA-2 land surface hydrology estimates. Journal of Climate, 30 (8), 2937–2960. doi:10.1175/JCLI-D-16-0720.1
- Sahai, A.K., et al., 2003. Long-lead prediction of Indian summer monsoon rainfall from global SST evolution. Climate Dynamics, 20, 855–863. doi:10.1007/s00382-003-0306-8
- Seneviratne, S.I., et al., 2006. Land–atmosphere coupling and climate change in Europe. Nature, 443, 205–209. doi:10.1038/nature05095
- Seneviratne, S.I., 2012. Climate science: historical drought trends revisited. Nature, 491, 338–339. doi:10.1038/491338a
- Sheffield, J., et al., 2014. A drought monitoring and forecasting system for sub-Sahara African water resources and food security. Bulletin of American Meteorological Society, 95, 861–882. doi:10.1175/BAMS-D-12-00124.1
- Sheffield, J., Wood, E.F., and Roderick, M.L., 2012. Little change in global drought over the past 60 years. Nature, 491 (7424), 435–438. doi:10.1038/nature11575
- Shiau, J.T., 2006. Fitting drought duration and severity with two-dimensional copulas. Water Resource Management, 20, 795–815. doi:10.1007/s11269-005-9008-9
- Teuling, A.J., et al., 2013. Evapotranspiration amplifies European summer drought. Geophysical Research Letters, 40 (10), 2071–2075. doi:10.1002/grl.50495
- Törnros, T. and Menzel, L., 2014. Addressing drought conditions under current and future climates in the Jordan River region. Hydrology and Earth System Science, 18 (1), 305–318. doi:10.5194/hess-18-305-2014
- Touchan, R., et al., 2005. Standardized precipitation index reconstructed from Turkish tree-ring widths. Climate Change, 72 (3), 339–353. doi:10.1007/s10584-005-5358-9
- Trenberth, K.E., et al.. 2014. Global warming and changes in drought. Nature Climate Change, 4 (1), 17–22. doi:10.1038/nclimate2067
- Tsakiris, G. and Vangelis, H., 2005. Establishing a drought index incorporating evapotranspiration. European Water, 9 (10), 3–11.
- Vicente-Serrano, S.M., Beguera, S., and López-Moreno, J.I., 2010. A multiscalar drought index sensitive to global warming: the standardized precipitation evapotranspiration index. Journal of Climate, 23, 1696–1718. doi:10.1175/2009JCLI2909.1
- Wang, A., Lettenmaier, D.P., and Sheffield, J., 2011. Soil moisture drought in China, 1950–2006. Journal of Climate, 24 (13), 3257–3271. doi:10.1175/2011JCLI3733.1
- Wang, H., et al., 2016. Monitoring winter wheat drought threat in Northern China using multiple climate- based drought indices and soil moisture during 2000–2013. Agricultural and Forest Meteorology, 228–229 (15), 1–12. doi:10.1016/j.agrformet.2016.06.004
- Wang, H., Rogers, J.C., and Munroe, D.K., 2015. Commonly used drought indices as indicators of soil moisture in China. Journal of Hydrometeorology, 16 (3), 1397–1408. doi:10.1175/JHM-D-14-0076.1
- Wilhite, D.A., ed., 2000. Drought: a global assessment. London, UK: Routledge.
- WMO, 2012. Standardized precipitation index user guide. Available from: http://www.wamis.org/agm/pubs/SPI/WMO_1090_EN.pdf
- Yi, Y., Kimball, J.S., and Jones, L.A., 2011. Evaluation of MERRA land surface estimates in preparation for the soil moisture active passive mission. Journal of Climate, 24, 3797–3816. doi:10.1175/2011JCLI4034.1
- Zawadzki, J. and Kędzior, M., 2016. Soil moisture variability over Odra watershed: comparison between SMOS and GLDAS data. International Journal of Applied Earth Observations and Geoinformation, 45 (Part B), 110–124. doi:10.1016/j.jag.2015.03.005
- Zhang, X., et al., 2017. Soil moisture drought monitoring and forecasting using satellite and climate model data over Southwestern China. Journal of Hydrometeorology, 18 (1), 5–23. doi:10.1175/JHM-D-16-0045.1