?Mathematical formulae have been encoded as MathML and are displayed in this HTML version using MathJax in order to improve their display. Uncheck the box to turn MathJax off. This feature requires Javascript. Click on a formula to zoom.
ABSTRACT
This study predicts future variations in simulated water balance components of Nam Co Lake under projected climate change scenarios using the soil and water assessment tool (SWAT) model in conjunction with the degree-day melt (DDM) model coupled with the glacier volume-area scaling law. We deduced that the water balance of Nam Co Lake will increase under all selected representative concentration pathway (RCP) scenarios, but it will become negative from 2073 onward (under RCP8.5). Compared to 1981–2010, from 2011 to 2100, the projected Nam Co Lake levels show an increase at a rate of 0.63, 0.70, and 0.41 m/a under RCP2.6, 4.5, and 8.5, respectively, with an area expansion of 778, 855, and 537 km2 and a corresponding water volume increase of 155, 17, and 94 km3, respectively; from 2011 to 2100, the lake area will expand by 38.6%, 42.4%, and 26.6% under RCP2.6, 4.5, and 8.5, respectively.
Editor A. Castellarin ; Associate editor Z. Duan
1 Introduction
The Tibetan Plateau (TP) and its surroundings comprise ~7.0 ± 1.8 × 10³ km3 of ice reserves (Farinotti et al. Citation2019); this amount is the largest outside the polar regions, and is why the TP is known as the “Third Pole.” The TP is home to nearly 1400 lakes with areas larger than 1 km2, most of which are concentrated in the inner region of the plateau (Zhang et al. Citation2019b). These lakes provide an indication of global climate change (Li et al. Citation2019a, Zhan et al. Citation2020) and serve as sentinels for regional climate change (Yao et al. Citation2018). Owing to elevation-dependent warming (Pepin et al. Citation2015, Wang et al. Citation2020), significant reductions in glacier lengths, areas, and masses; increase in precipitation; inconsistency in snow cover and snowmelt; and permafrost degradation have been witnessed in the TP (Bibi et al. Citation2018, Yang et al. Citation2018), which have enhanced the inflow towards the lakes and ultimately influenced the lakes’ levels, areas, and storage (Zhang et al. Citation2014, Qiao et al. Citation2019a). The number of lakes and their associated surface area have increased significantly over the past 30 years (Li et al. Citation2019a). During 1976–2018, the lake area in the TP increased from 40 000 ± 766.5 km2 to 50 000 ± 791.4 km2 (Zhang et al. Citation2019). These expanding lakes deteriorate alpine meadows and prairies, influencing the local ecology, environment, and economy (Qiao et al. Citation2019a).
The TP lakes are located in endorheic basins and are very sensitive to climate change (Brun et al. Citation2020); therefore, they are eminently suitable for detecting the impacts of climate change on regional water balance (Mao et al. Citation2018). In particular, large lakes, such as Nam Co and Selin Co, are important components of the hydrological cycle, and variations in the water balance of these lakes may result in changes in the regional environment and climate (Qiao et al. Citation2019a). Since the mid-1990s, several lakes in the TP have increased rapidly with respect to their area and volume (Zhang et al. Citation2017a, Citation2017b, Yao et al. Citation2018, Qiao et al. Citation2019b), including Nam Co and Selin Co, whereas a number of lakes have contracted near the peripheral area of the southeastern TP (Song et al. Citation2013, Yang et al. Citation2014). Previous studies observed that the lakes had gained mass at a rate of 6–9 Gt/year from the mid-1990s to the mid-2010s (Brun et al. Citation2020), which was confirmed by an increase in the total land water storage (Zhang et al. Citation2017b, Yao et al. Citation2018, Loomis et al. Citation2019); however, loss of glacier mass in the TP was observed during the same period (Shean et al. Citation2020). A study conducted by Zhang et al. (Citation2017b) observed a complex pattern in the volume change of the TP lakes from 1976 to 2015. They found a slight decrease of −2.78 Gt/year during 1970–1995, followed by a rapid increase of 12.53 Gt/year during 1996–2010, and now a recent deceleration of 1.46 Gt/year in the volume change of TP lakes during 2011 −2015. Similarly, Zhan et al. (Citation2020) observed deceleration in the lakes in the TP from 2010 to 2016, while several lakes in the central TP displayed a sharp rise in the lake levels from 2016 to 2018. Moreover, northwestern TP lakes displayed an increase in volume, with a total water storage gain of ~28.6 Gt from 2000 to 2018 (Zhang et al. Citation2020a).
Variations in the in situ inter-annual level of Nam Lake revealed an increasing trend of 0.66 m from 2006 to 2014, a rapid decrease of 0.59 m from 2014 to 2017, and a sharp increase of 0.20 m from 2017 to 2018 (Zhou et al. Citation2021), which illustrates that the TP lakes are influenced by climate change. Nam Co Lake experienced a significant increase in lake area (91.83 km2) and decrease in glacier area (62.69 km2) from 1961 to 2015 (Li et al. Citation2017), mainly due to accelerated glacier melting followed by increased precipitation and decreased lake evaporation (Wu and Zhu Citation2008, Krause et al. Citation2010, Zhu et al. Citation2010, Wang et al. Citation2016). Conversely, it has been observed that, in Nam Co Lake, increased precipitation was a major contributor to the lake’s rapid growth (Lei et al. Citation2013, Zhou et al. Citation2013, Biskop et al. Citation2016, Li et al. Citation2017, Zhang et al. Citation2017b, Mao et al. Citation2018, Qiao et al. Citation2019a, Brun et al. Citation2020). Moreover, it was observed that the variations in Nam Co Lake’s water storage are mainly controlled by precipitation; however, recently, the contribution of precipitation has decreased, whereas contributions from snow and glacier melt have significantly increased (Tong et al. Citation2020, Zhong et al. Citation2020). The negative glacier mass balance of the eastern and western Nyainqentanglha Mountains is an indication of substantial glacier melting; this region displayed a surge in glacier melting during 2013–2017 (Ren et al. Citation2020). Thus, the reasons for changes in the lakes of the TP are still unclear and require further detailed investigation, especially with respect to future changes under ongoing warming.
In the context of climate warming, the Qinghai-Tibet Plateau is facing problems of accelerated retreating glaciers, lake expansion, and climate change in the basin. Therefore, conducting investigations on typical lake changes in the Qinghai-Tibet Plateau, understanding the potential driving factors, and evaluating the impact of climate change on the TP lakes is of great scientific significance. Because of the long-term data scarcity issue, previous studies have widely used Ice, Cloud, and land Elevation Satellite (ICESat) to study the lake levels of and water storage changes in large lakes (Zhang et al. Citation2011b, Song et al. Citation2013, Wang et al. Citation2013, Li et al. Citation2014b) of the TP from 2003 to 2009. Later, owing to advancements in remote sensing science, CryoSat-2 altimetry data were used to analyse the levels and water storage changes in large lakes with high accuracy (Song et al. Citation2015a, Citation2015b, Lee et al. Citation2016, Jiang et al. Citation2017, Zhang et al. Citation2017a, Citation2019, Hwang et al. Citation2019, Qiao et al. Citation2019b, Zhan et al. Citation2020). However, Zou et al. (Citation2019) determined the water storage variations in the lakes in Tibet using Gravity Recovery and Climate Experiment (GRACE), ICESat, and hydrological data from 2002 to 2016.
Notably, only a few studies have estimated lake water balance and storage through hydrological modelling, and most studies have explained hydrological characteristics at a sub-catchment scale. However, these studies failed to explain the trends of water balance components, which are necessary to understand the runoff to Nam Co Lake. Moreover, there is inadequate knowledge about the hydrological processes and water balance components in the Nam Co Lake basin, especially with respect to their spatial and temporal scales. Previous studies have not focused on the future projection of the water balance of the TP lakes. Our study is the first to explain the water balance, water storage, and lake levels of Nam Co Lake under projected climate change scenarios. The current study aims to predict the change in the water balance of Nam Co Lake under projected climate change scenarios using the soil and water assessment tool (SWAT) model (in conjunction with the degree-day melt (DDM) model) and glacier volume-area scaling relation forced by downscaled temperature and precipitation data from three general circulation model (GCM) ensembles under three representative concentration pathways (RCPs). Our study is unique because it considers estimating the dynamic glacier area module in which glaciers advance and retreat, with reference to changes in climatic parameters, whereas previous hydrological modelling studies considered the glacier area to be constant for long-term water balance analysis, which may cause uncertainty in the results. This work is important for understanding the rapid variations in the water cycle of the Nam Co basin under the influence of global warming because the lake runoff on the TP and its societal and environmental influences are of concern to both the research community and the general public.
1.1 Study area
Nam Co Lake is located on the northeast slope of the Nyainqentanglha Mountains in the inland TP, with an elevation of 4730 m a.s.l. (Zhou et al. Citation2013), at latitude 29°56ˊ–31°7ˊN and longitude 89°21ˊ–91°23ˊE (Krause et al. Citation2010), as shown in .
Figure 1. The geographical location of the study area and meteorological stations
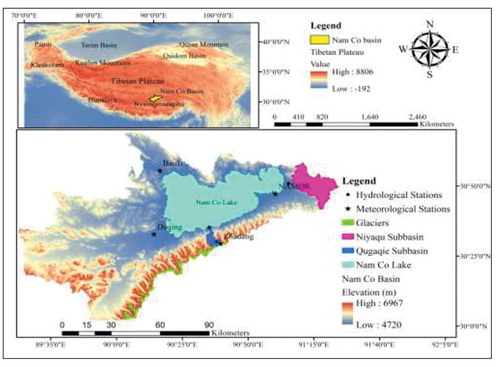
The surface area of the lake is approximately 2026 km2 (Du et al. Citation2018) and it has a maximum depth of 100 m (Wang and Zhu Citation2006, Zhang et al. Citation2011), while the total area of the Nam Co basin is 10 658 km2. A large number of glaciers are spread over the Nyainqentanglha mountain range on the south shore of Nam Co Lake. Most of the tributaries originate from the eastern and western sides of the basin, while southern tributaries originate from the Nyainqentanglha Mountains (with a maximum elevation of 7162 m a.s.l.); it is regarded as a highly glaciated range (Kropáček et al. Citation2012). The Nam Co basin comprises 137.2 km2 of glacier area (Guo et al. Citation2014).
Nam Co basin’s topography corresponds to a semi-arid sub-arctic plateau climate (Liu et al. Citation1999), and the basin is situated at the junction of the East Asian monsoon, West Asian monsoon, winter monsoon, and westerlies (Kang et al. Citation2007). The basin receives strong solar radiation, which reaches 2900–3200 h/year. The basin receives 90% of its precipitation during the monsoon season (June–September). The mean annual precipitation is approximately 417 mm. The average annual evaporation from the land surface and the lake surface was approximately 320 mm and 790 mm, respectively (Dagang et al. Citation2004). The highest and the lowest daily air temperatures during 2007–2013 recorded at the Nam Co Station for Multisphere Observation and Research (NAMOR) were approximately 10°C and −12°C, respectively, while the annual mean air temperature (which showed large diurnal and seasonal variability) ranged from −2°C to 0°C. The monthly average wind speed in the basin ranged from 2.71 to 4.32 m/s and had the highest and lowest values in December and August, respectively. Additionally, the relative humidity in the Nam Co basin varied between 39 and 66%, while the global radiation varied between 175 and 314 w/m2 (Adnan et al. Citation2019b).
2 Materials and methods
2.1 Coupled hydrological model
The SWAT model was used to simulate the streamflow into Nam Co Lake. Detailed descriptions of the SWAT model are provided in the existing literature (Adnan et al. Citation2019a, Citation2019b). The working mechanism of the SWAT model is shown in .
Figure 2. Flowsheet diagram of the SWAT model
2.1.1 Degree-day melt model (DDM)
The SWAT model is incapable of dealing with glaciers. Therefore, the current study used the SWAT model and the volume-area scaling law coupled with DDM to simulate the glacier area dynamics and future contributions of glacier melt to Nam Co Lake under projected climate change scenarios. There are 224 glaciers in the Nam Co Lake basin, and each glacier was divided into 10 elevation bands. The current version of the DDM is also capable of considering snow accumulation, snowmelt, and ice melt in each glacier band defined by the user.
The basic equation used for calculating the total melt of snow/ice (mm) for the glacier “i” is given below:
where denotes the total melt of snow/ice (mm) for glacier “i” in the glacier band,
denotes the degree-day factor (DDF) for snow and ice (mm/°C/day),
denotes the factor that measures the aspect dependence of
,
specifies the main cosine of the surface aspect for glacier “i” in the glacier band, and
denotes the mean daily air temperature in the glacier band. The parameters listed in were obtained from observed data as well as from previous studies (Zhao et al. Citation2015, Adnan et al. Citation2019a, Citation2019b) to force the DDM for simulation of snow and ice melt in the Nam Co basin.
Table 1. List of parameters used in degree-day melt model and volume-area scaling law
The DDM used EquationEquation (2)(2)
(2) to calculate the solid precipitation (
; mm/day) in each glacier band:
where and
specify the mean daily air temperature (°C) and precipitation (mm), respectively, in the glacier band, and
(°C) and
(°C) denote the minimum and maximum temperatures at which rainfall and snowfall can occur, respectively, in the glacier band.
EquationEquation (3)(3)
(3) was used to calculate the liquid precipitation in the glacier band,
, which is given below:
EquationEquation (4)(4)
(4) was used to compute the daily accumulated snow water equivalent,
, on the glacier surface:
where is the time interval (
as presented (EquationEquation 4
(4)
(4) ).
Generally, the temperature above which snow and ice melting starts is regarded as the threshold temperature (), which is generally considered to be 0°C (Hock Citation2003, Zhao et al. Citation2015).
Moreover, the potential snowmelt, (, in each glacier band was calculated using EquationEquation (5)
(5)
(5) :
where (mm °C−1 day−1) represents the DDF of snow. Moreover, the variable
was compared with
, which represents the accumulated snow water equivalent. If
>
, then only snow melts that was accumulated in a specific time interval. In other cases, if there is inadequate snow, the residual positive degree days (PDDs) will be used for ice melting in the glacier band, as shown in EquationEquation (6)
(6)
(6) .
where denotes the degree-day factor for ice, and
represents the sum of snow and ice melt (mm) in the glacier band. The parameters of the DDM are listed in .
2.1.2 Volume-area scaling law
The volume-area scaling law was used to estimate the glacier advance and retreat with reference to changes in climatic parameters. This approach simulates the variations in glacier areas based on the simulated mass balance (Stahl et al. Citation2008, Immerzeel et al. Citation2010, Su et al. Citation2016). The parameters used in the volume area scaling law are presented in . The basic equations used for the volume-area scaling law are given below:
where V and A denote the glacier volume (km3) and area (km2) of each glacier, respectively, c is the constant (c = 0.0365), and denotes the dimensionless scaling coefficient (
= 1.375). The coefficients used in the volume-area scaling law were determined from the measured sizes of alpine glaciers around the globe (Kotlarski et al. Citation2010, Grinsted Citation2013). Zhao et al. (Citation2019) used the volume-area scaling law in combination with DDM to project the impacts of climate change on the hydrological processes of the TP.
Using this approach, based on accumulation, ablation, and current glacier area conditions, we determined the glacier mass balance of the lake, which was further updated by the glacier volume-area scaling relation under the projected climate change pattern. The new glacier area () was calculated using EquationEquation (8)
(8)
(8) . The area change of each glacier was determined using EquationEquation (9)
(9)
(9) :
2.2 Dataset
2.2.1 Meteorological data
The data from four automatic weather stations (AWSs), Zhadang, Baoji, Deqing, and NAMOR, were used to force the SWAT model ( and ). The Nam Co basin is a data-scarce basin and has short-term observed meteorological station (MS) data, with missing values from 2007 to 2013. The nearby National Meteorological Stations (NMSs) – that is, Damxung, Baingoin, Nagqu, Xainza, and Anduo – have long-term meteorological records that start from 1960 (). Daily air temperature data for the Nam Co basin were reconstructed from 1966 to 2013 based on data from four in situ MSs of the Nam Co basin between 2007 and 2013 and data from five NMSs for the period 1966–2013.
Table 2. List of datasets used in the study
The reconstructed data of,
, and
from 2007 to 2013 were compared with the observed data of in situ MSs at a daily time scale, and we found a good correlation with the R2 values (ranging between 0.92 and 0.96; see the Appendix, ). However, the reconstructed temperature data showed poor performance in comparison with the observed data over the Zhadang station (Nash–Sutcliffe Efficiency (NSE) = 0.53). The poor correlation might be due to the large difference in elevation (i.e. 800–900 m) between the NMS and Zhadang. The Zhadang MS was installed upstream of the Zhadang Glacier at an elevation of 5680 m, and the NMS were installed below 5000 m elevation. Therefore, the elevation difference and topography of the area might be responsible for the large bias between the observed and reconstructed temperature data for the Zhadang MS.
The lack of precipitation data was resolved by employing the Asian Precipitation – Highly-Resolved Observational Data Integration Towards Evaluation of Water Resources (APHRODITE, version 1101R2, on 0.25° × 0.25° grids) dataset (Yatagai et al. Citation2012) to force the coupled models (SWAT model and DDM model coupled with volume-area scaling relation) with respect to the period 1981–2010. Daily APHRODITE precipitation data were downloaded from 1971 to 2007. The time series APHRODITE precipitation data were bias-corrected using EquationEquation (10(10)
(10) ), as presented by Sperna Weiland et al. (Citation2010):
where and
denote the mean observed and modelled precipitation, respectively, and
denotes the daily modelled precipitation for the study period. The bias-corrected APHRODITE precipitation data were compared with the gauged data of NAMOR, Baoji, Deqing, and Zhadang (for the period 2007–2013) on a monthly time scale; we found a good correlation with R2 values (ranging from 0.40 to 0.85; see the Appendix, ). Moreover, previous studies (Han and Zhou Citation2012, Weiland et al. Citation2012) on the performance evaluation of APHRODITE precipitation data over China also exhibited a high correlation with the observed gauged data and displayed good results in terms of the frequency, intensity, and amount of precipitation. Several other studies (Tahir et al. Citation2011, Zhao et al. Citation2015, Luo et al. Citation2020) have suggested that APHRODITE data are reliable for driving hydrological models in simulating the streamflows of highly elevated basins of the TP and the Upper Indus Basin (UIB).
2.2.2 General circulation model (GCM)
The GCM data were downloaded from the Climate Model Intercomparison Project 5 (CMIP5) dataset archive for 1961–2100. Three GCMs (CanESM2, MIROC-ESM, and NORESM1-M) under RCP2.6, 4.5, and 8.5, respectively, were selected based on a comparison with the observed meteorological data (see the Appendix, ) and from past climate change studies conducted over China and its surrounding countries (Su et al. Citation2013, Babur et al. Citation2016, Zhang et al. Citation2016a, Citation2016b, Zaman et al. Citation2018, Jia et al. Citation2019, Salunke et al. Citation2019, Zhao et al. Citation2019), as presented in . The RCP6.0 data were not included in the current study because the main objective of our study was to estimate the lake levels, lake area, and volume changes under low (RCP2.6), medium (RCP4.5), and high (RCP8.5) emission scenarios.
Table 3. List of selected GCMs for climate change study
Before bias correction, in comparison with observed temperature and precipitation data, all GCMs displayed biases and overestimated the results; in particular, precipitation produced large biases. Similar results were obtained by Salunke et al. (Citation2019) during a performance evaluation of 28 CMIP5 models in simulating the climate of the Himalaya-Tibetan Plateau (HTP). They concluded that none of the GCMs were able to capture all the features of the HTP summer monsoon accurately, and each model did well in some aspects and was futile in others. To minimize biases, the GCM data were bias-corrected using the generator for point climate change (GPCC) model and then compared with the observed meteorological data. The GPCC is a statistical climate downscaling model developed by Zhang (Citation2005).
The model is based on the stochastic weather generator CLIGEN, which downscales the monthly projections of GCMs in a grid box to the daily weather series at a point scale or station. It can be described as a hybrid downscaling tool because it handles spatiotemporal variations individually in two separate steps. First, it spatially downscales the monthly series from a grid box to a station by using quantile mapping, and then it disaggregates the downscaled monthly values to daily series of the target station using CLIGEN. In this method, due to the explicit treatment of spatial and temporal variations, future climate variability is captured and displayed more effectively. Additionally, CLIGEN downscales the precipitation and maximum and minimum temperatures.
The observed Tmax, Tmin, Tavg, and precipitation data of the NAMOR station were compared with the GCM ensemble mean data for the period 2007–2013, and satisfactory results were obtained with R2 values of 0.77, 0.81, 0.75, and 0.56 for Tmax, Tmin, Tavg, and precipitation, respectively (see the Appendix, ). Three GCM ensemble means were used in the modelling framework for predicting future streamflow, and this proved effective in minimizing the biases, as suggested by Su et al. (Citation2013), Zhang et al. (Citation2016a), Salunke et al. (Citation2019), and Zhao et al. (Citation2019). Another study, conducted by Dickerson-Lange and Mitchell (Citation2014), observed that ensemble GCMs are valuable tools because they show how flow distributions may shift under a wide range of future climate conditions.
2.3 Model set-up
The current study is a continuation of existing studies (Adnan et al. Citation2019a, Citation2019b); therefore, the information related to the set-up of the SWAT model explained in the existing studies is merely summarized in this section.
The forcing data (soil, land use, digital elevation model (DEM), and meteorological data) for the SWAT model were prepared before its set-up. The major steps for the SWAT model include (a) watershed delineation and sub-basin feature derivation; (b) hydrologic response unit (HRU) definition and generation of elevation bands; (c) weather generator and meteorological inputs; (d) running the SWAT model; (e) sensitivity analysis; and (f) calibration and validation of SWAT and uncertainty analysis.
Based on the stream network, the Nam Co basin was divided into 30 sub-basins using a watershed delineator in Arc SWAT. Each sub-basin was further divided into 10 elevation bands. The surface runoff volume was calculated using the Soil Conservation Service curve number method (Neitsch et al. Citation2011). The Penman-Monteith method was selected for the calculation of evapotranspiration (Penman Citation1948, Monteith Citation1965). The SWAT model was run on both monthly and daily time scales. The simulation period was from 2002 to 2015, including a five-year warming period (2002–2006). The SWAT calibration and uncertainty program (SWAT-CUP) was used for calibration, validation, sensitivity, and uncertainty analysis using the sequential uncertainty fitting algorithm (SUFI-2 algorithm). Nam Co Lake has no outlet point; therefore, in the initial stage, owing to the limitations of the SWAT model, it was calibrated on two gauged sub-basins of Nam Co Lake: the Qugaqie sub-basin (glaciated) and the Niyaqu sub-basin (non-glaciated). We calibrated 22 parameters (see the Appendix, ) of the SWAT model at the sub-basin scale and then scaled it to the basin scale. The purpose of performing calibration over two gauged sub-basins was to achieve the calibrated parameters from both the sub-basins for obtaining future-based simulations of the SWAT model over the entire Nam Co basin. The climatic and topographic features, such as land use, soil, and slope, of these two sub-basins are similar to those of the Nam Co basin. Therefore, to reduce uncertainty in the calibrated parameters, the Niyaqu sub-basin parameters were assigned to the non-glaciated sub-basins, and the parameters of the Qugaqie sub-basin were assigned to the glaciated sub-basins of the Nam Co basin. Some past studies also used the parameter up-scaling technique to transfer the calibrated parameters from a gauged to an ungauged basin (Roth et al. Citation2016) and from sub-basin to basin scale (Feaster et al. Citation2014). The simulated streamflows were converted to lake levels and then validated with the observed lake levels (for the period 2007–2013).
In the current study, the basin-scale validated SWAT model was run on a monthly time scale over four sub-periods (1981–2010, 2011–2040, 2041–2070, and 2071–2100) and over the entire period (2011–2100) under three RCP scenarios, namely RCP2.6, 4.5, and 8.5. A 5-year warm-up period was selected for each sub-period: 1976–1980, 2006–2010, 2036–2040, and 2066–2070 for the first, second, third, and fourth sub-periods, respectively. The DDM coupled with the volume-area scaling law was used to estimate the contribution of glacial melt runoff to Nam Co Lake during 1981–2100 under the three RCPs. The simulated glacier melt runoff of the DDM during 1981–2010, 2011–2040, 2041–2070, and 2071–2100 under different climate change scenarios was merged into the simulated runoff (SWAT model) of the respective period to estimate the total runoff contribution to Nam Co Lake.
3 Results
3.1 Projection of annual air temperature and precipitation changes
The linear trend analysis carried out in our study exhibited an accelerated increasing trend in projected future annual mean air temperature magnitude from 2011 to 2100 under all RCP scenarios in the Nam Co basin (see the Appendix, ). The results indicate that the annual temperature increased by 0.014, 0.033, and 0.078°C/a under RCP2.6, 4.5, and 8.5, respectively. Overall, the annual mean air temperature magnitude gradually increased from low (RCP2.6) to high (RCP8.5) emission scenarios.
Similarly, trend analysis indicated an increasing trend in annual precipitation of the Nam Co basin under all RCP scenarios from 2011 to 2100 (see the Appendix, ). It exhibited an increasing trend at a rate of 0.95, 1.54, and 2.07 mm/a under RCP2.6, 4.5, and 8.5, respectively. Overall, the annual precipitation magnitude gradually increased from low (RCP2.6) to high (RCP8.5) emission scenarios during the specified period.
3.2 Projected future change in decadal temperature magnitude under different RCPs
Under the RCP2.6 scenario, the change in the decadal magnitude of the annual and seasonal temperatures will increase during 2011–2040 and 2041–2070 (see the Appendix, ). The annual and seasonal temperatures will decrease from 2071 to 2100. A greater increase in the magnitude of summer (A–S; August–September) temperature was observed as compared to winter (O–M; October–March) from 2011–2040. The highest decadal temperature will increase in MAM (March, April, and May) during 2011–2040, with a change rate of 0.90°C/decade, while the temperature will decrease in SON (September, October, and November) from 2011 to 2100.
Under RCP4.5, the change in the decadal magnitude of the annual and seasonal temperatures will increase from 2011 to 2070 and decrease from 2071 to 2100 (see the Appendix, ). In contrast to RCP2.6, the winter (O–M) temperature increases more than that in summer (A–S) from 2011 to 2040 under RCP4.5. Similarly, under the RCP8.5 scenario, the winter (O–M) temperature increases more than that in summer (A–S) (see the Appendix, ). In winter (O–M), the temperature magnitude will increase by 1.19°C/decade from 2041 to 2070 and 1.11°C/decade from 2071 to 2100.
3.3 Projected future change in decadal precipitation magnitude under different RCPs
Under the RCP2.6 scenario, the change in the decadal magnitude of annual precipitation gradually increases from 2011 to 2100 (see the Appendix, ). The decadal change in the magnitude of winter (O–M) precipitation will gradually decrease from 2.78 mm/decade to 0.37 mm/decade from 2011 to 2100, while the magnitude of summer (A–S) precipitation will gradually increase from −0.62 mm/decade to 1.68 mm/decade during the same period. Similarly, a study conducted by Zaman et al. (Citation2020) observed an increase in the frequency of wet precipitation days from the northeast to middle parts of the Northern Highlands of Pakistan.
Under RCP4.5, the seasonal analysis exhibited the highest increase in precipitation magnitude from 2011 to 2040, compared to the remaining periods. The precipitation will increase at a substantial rate during DJF (December, January, and February), with a change rate of 6.99 mm/decade from 2011 to 2040, compared to the remaining seasons. A similar trend was observed in RCP8.5 as in RCP4.5, in the decadal magnitude of annual and seasonal precipitation during 2011–2100 (see the Appendix, ).
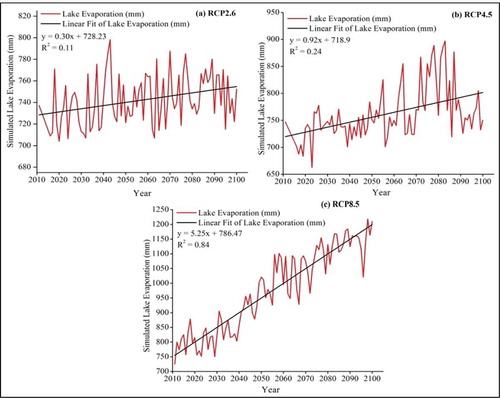
3.4 Temporal variations in simulated Nam Co Lake evaporation
Linear trend analysis of the simulated Nam Co Lake evaporation displayed an increasing trend from 2011 to 2100 under all the RCPs (see the Appendix, ). Lake evaporation exhibited an increasing trend, with a change rate of 0.30, 0.92, and 5.25 mm/a under RCP2.6, 4.5, and 8.5 emission scenarios, respectively. Overall, the trends of evaporation and annual air temperature of Nam Co Lake were consistent with each other. Notably, the simulated lake evaporation shows a gradual increase from low (RCP2.6) to high (RCP8.5) emission scenarios.
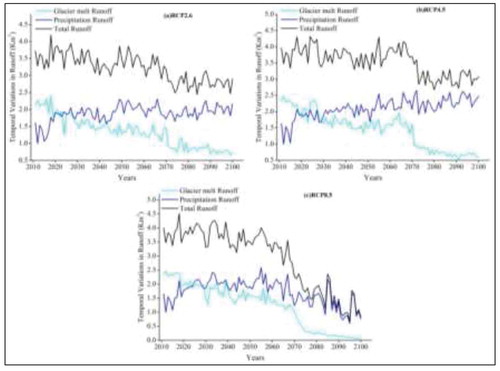
3.5 Temporal variations in projected future glacier melt and precipitation runoff
It is projected that glacial melt runoff will continuously decrease from 2011 to 2100, while it will experience a larger drop from 2070 onward; whereas under RCP2.6 and 4.5, precipitation runoff will remain stable and will experience a slight increase in its magnitude from 2070 onward, as presented in . Similarly, under RCP8.5, the glacier melt runoff gradually decreases, and it will face a sudden steep drop from 2060 onward. However, under RCP8.5, the precipitation runoff will remain stable with a slight increase in its magnitude from 2011 to 2060, while it will have a pronounced drop in its magnitude from 2060 onward. Similarly, the total runoff of the Nam Co basin will decrease from 2011 to 2100, with a sudden drop in its magnitude from 2070 onward under RCP2.6 and 4.5, whereas under RCP8.5, it will experience a sudden steep drop from 2055 onward, as presented in . Overall, the precipitation runoff will exceed the glacial melt runoff in 2030 under all of the RCP scenarios.
Figure 3. Projected future glacier melt and precipitation runoff contributions to Nam Co Lake under RCPs
3.6 Projected future water balance of Nam Co Lake
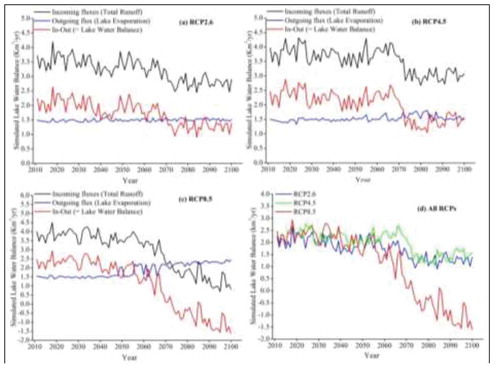
The results indicate that the total incoming runoff to the lake will remain nearly stable from 2011 to 2070, but it will experience a steep drop in its magnitude from 2070 onward under RCP2.6 and 4.5, as presented in . Similarly, evaporation in the lake will remain nearly stable until 2070, and then its magnitude will slightly increase from 2070 onward under RCP2.6 and 4.5. However, under RCP8.5, the total incoming runoff will remain stable until 2055, but will have a sharp decline from 2055 onward. In contrast, evaporation in the lake will remain stable until 2055, and then its magnitude will increase substantially. However, there is a positive water balance of Nam Co Lake from 2011 to 2100 under RCP2.6 and 4.5, and the lake will expand, whereas its magnitude will be slightly weakened from 2065 onward. However, under RCP8.5, a positive water balance is projected for Nam Co Lake from 2011 to 2073, whereas the lake will undergo a negative water balance from 2073 onward ().
Figure 4. Projected future water balance of Nam Co Lake under RCPs
3.7 Temporal variations in projected future Nam Co Lake levels
Under the assumption of a constant area (2015 km2) and base altitude of the lake (4724 m), the results obtained from DEM analysis indicate an increasing trend in projected Nam Co Lake levels from 2011 to 2100 at a rate of 0.86 and 1.0 m/a under RCP2.6 and 4.5, respectively (), which implies that the lake will expand until the end of the 21st century. However, under RCP8.5, the lake levels exhibit an increasing trend from 2011 to 2100 at a rate of 0.60 m/a; it will experience a steep drop from 2073 onward, and the lake levels will decrease by 11.3 m relative to the baseline period. Overall, it is projected that the cumulative Nam Co Lake levels will increase by 77, 89, and 47 m under RCP2.6, 4.5, and 8.5, respectively, from 2011 to 2100, under the assumption of a constant lake area.
Figure 5. (a) Projected future cumulative Nam Co Lake level variations (with constant lake area) under RCPs; (b) variations in Nam Co Lake surface area with respect to lake altitude

However, under the condition of a dynamic lake area, lake area and volume will also change as a result of an increase in the lake level under varying RCPs. The area-altitude curve showed that compared to the baseline period (1981–2010), the projected Nam Co Lake levels will increase at a rate of 0.63, 0.70, and 0.41 m/a under RCP2.6, 4.5, and 8.5, respectively, from 2011 to 2100, with an expansion in area of 778, 855, and 537 km2 and a corresponding water volume increase of 155, 179, and 94 km3, respectively. Overall, from 2011 to 2100, the lake area will expand by 38.6%, 42.4%, and 26.6% under RCP2.6, 4.5, and 8.5, respectively. Additionally, from 2011 to 2100, the cumulative Nam Co Lake levels will increase by 56, 63, and 37 m under RCP2.6, 4.5, and 8.5, respectively. An area-altitude curve is shown in . This graph shows the continuous expansion of the lake’s surface area with respect to the increase in the lake levels under emission scenarios RCP2.6, 4.5, and 8.5.
3.8 Prediction of future runoff into Nam Co Lake during sub-periods
Our hydrological modelling results displayed a significant impact of the projected climate change on the simulated runoff (inflows) to Nam Co Lake from 2011 to 2100 ().
Figure 6. Variations in the simulated runoff of the Nam Co basin under RCPs
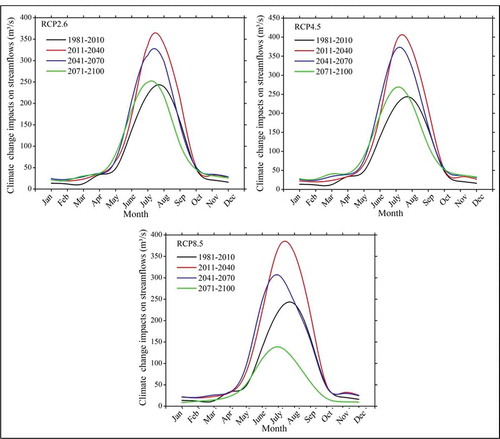
Compared to the baseline period (1981–2010), the results indicate a noteworthy contribution of runoff to Nam Co Lake during 2011–2040, followed by 2041–2070 and 2071–2100 under RCP2.6, and 4.5. For the period 2011–2100, peak runoff was projected in July and August, and its magnitude showed a range of 250–365 m3/s and 270–420 m3/s under scenarios RCP2.6 and 4.5, respectively. Similarly, under RCP8.5, the projected runoff contribution will be greater during 2011–2040, followed by 2041–2070 and then 2071–2100, as compared to the baseline period (). However, the runoff contribution for 2071–2100 is projected to be lower than that of the baseline period. The projected runoff magnitude during 2011–2100 was simulated to be 130–380 m3/s under RCP8.5.
3.9 Impact of glacier area dynamics on total runoff during sub-periods
The projected total runoff analysis displayed a substantial increase during 2011–2040 as a result of accelerated glacier melting under all RCP scenarios (). Under the RCP2.6 scenario, compared to the baseline period, the results indicated a 38.9% increase in the projected total runoff due to a loss of glacier area (loss of 53.6 km2) in the Nam Co basin during 2011–2040. The total runoff will increase by 31.6% following a loss of 20.9 km2 of glacier area from 2041 to 2070. Moreover, the total runoff will increase by only 9.4% due to a loss of 10.4 km2 of glacier area from 2071 to 2100. Overall, 84.9 km2 of glacier area will melt away under RCP2.6, whereas 52.3 km2 of glacier area will remain frozen until the end of the 21st century.
Table 4. Future change in projected runoff (%) under RCPs concerning the baseline period (1981–2010)
Under RCP4.5, compared to the baseline period, the results indicate an increase of 49.8% in the projected total runoff due to the loss of 52.5 km2 of glacier area during 2011–2040. The total runoff will increase by 46.7% due to the loss of 31.5 km2 of glacier area from 2041 to 2070. Moreover, the total runoff will increase by only 19.7% due to the loss of 19.1 km2 of glacier area from 2071 to 2100. Overall, during 2011–2100, 103.1 km2 of glacier area will be lost, while 34.2 km2 of glacier area will remain frozen under RCP4.5.
Under RCP8.5, compared to the baseline period, the results indicate an increase of 51.6% in the projected total runoff due to the loss of 60.1 km2 glacier area during 2011–2040. Moreover, the total runoff will increase by 33.5% following the loss of 51.2 km2 of glacier area from 2041 to 2070. Overall, over the period 2011–2100, 96.4% of the glacier area in the Nam Co basin will disappear and the projected total runoff will decrease by 40.2% relative to the baseline period (1981–2010) from 2071–2100 under RCP8.5. The decrease in the total runoff might be due to a decrease in precipitation runoff and a substantial increase in lake evaporation. A total of 132.2 km2 glacier area will be lost during 2011–2100, while only 5 km2 of glacier area will remain frozen until the end of the 21st century.
3.10 Relative contribution of precipitation and snow/glacier melt to Nam Co Lake during sub-periods
The simulated total runoff analysis showed that during 1981–2010, the average relative contributions of precipitation and snow/glacier melt to Nam Co Lake were 67% and 33% (including 30% glacier melt), respectively, as presented in . However, the projected relative contribution of glacier melt will reach a maximum value during 2011–2040, as compared to the remaining sub-periods under all RCPs. Moreover, the relative contribution of glacier melt will change from 50.8% to 30%, and simultaneously, the precipitation contribution to the lake will change from 49.1% to 69.9% during 2011–2100 under RCP2.6.
Figure 7. Relative contributions of simulated precipitation and snow/glacier melt to Nam Co Lake under RCPs
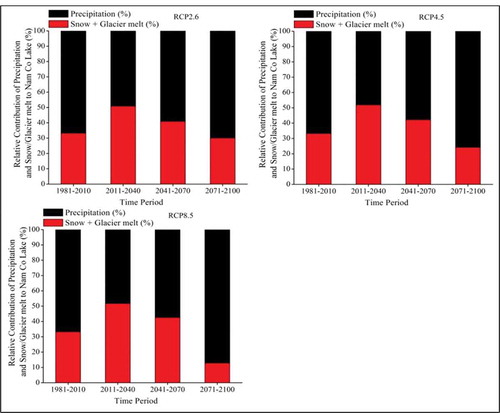
However, from 2011 to 2100, under RCP4.5, the relative contribution of glacier melt and precipitation to the projected runoff will change from 51.9% to 24.1% and 48.1% to 75.8%, respectively. Similarly, during 2011–2100, under RCP8.5, the projected relative contribution of glacier melt will change from 51.6% to 12.8%, while simultaneously the relative contribution of precipitation will change from 48.3% to 87.2% ().
4 Discussion
The present study focuses on variations in the future water balance of Nam Co Lake under projected climate change scenarios using the SWAT model in conjunction with DDM coupled with the volume-area scaling law.
Our study projects that simulated glacier melt runoff will continuously decrease from 2011 to 2100, while it will experience a pronounced drop from 2070 onward under RCP2.6 and 4.5; however, under RCP8.5, a steep drop in the magnitude of the runoff will be witnessed from 2060 onward. The Intergovernmental Panel on Climate Change (IPCC) Special Report on the ocean and cryosphere in a changing climate (Poloczanska et al. Citation2018) has projected that glacier melt runoff will reach its peak around the mid-21st century, and this will subsequently decline in High Mountain Asia under all RCPs. However, it is projected that precipitation runoff will remain stable and experience a slight increase in magnitude from 2070 onward under RCP2.6 and 4.5; however, in the case of RCP8.5, its magnitude will increase from 2060 onward. Overall, the precipitation runoff will exceed the glacial melt runoff 2030 onward under all RCPs.
Similar results were obtained by Zhao et al. (Citation2019), who also projected that the glacier runoff contribution to the Yangtze River will start to decline after the 2030s. Moreover, it is projected that from 2011 to 2100, 96.4% of the glacier area in the Nam Co basin will disappear under RCP8.5. Similarly, Zhao et al. (Citation2019) observed that the glacier area in the Yellow, Yangtze, Mekong, Salween, and Brahmaputra River basins will decline by 62.1%, 80.9%, 95.6%, 79.6%, and 75.8%, respectively, until the end of the 21st century. Another study conducted by Zhang et al. (Citation2017a) demonstrated that approximately 29% of the glacier area in the Nam Co basin was lost from 1972 to 2015. Zhong et al. (Citation2020) and Tong et al. (Citation2020) have also confirmed that glacier melting has increased in the Nam Co basin in recent decades.
The simulated runoff analysis showed that the relative contributions of precipitation and snow/glacier melt were 67% and 33%, respectively, during the baseline period. Biskop et al. (Citation2016) observed that the glacier melt contribution to Nam Co Lake ranged between 14% and 30% during 2001–2010. Similarly, Zhong et al. (Citation2020) calculated that the mean annual contribution of glacial melt to the inflow of Nam Co Lake was 22%. A study conducted by Wu et al. (Citation2014) agrees well with ours; they observed that the relative contributions of rainfall-runoff, direct lake precipitation, and glacier melt to Nam Co Lake were 52%, 20%, and 28%, respectively. By contrast, Tong et al. (Citation2020) suggested that during 1979-2013, the average relative contributions of precipitation induced runoff, snowmelt and glacier melt to Nam Co Lake were 59%, 28%, and 13%, respectively. Another study, conducted by Li et al. (Citation2017), observed that the average glacier melt contribution to the total lake volume gain was only 10% in the TP. Brun et al. (Citation2020) found that from 1994 to 2015, the glacier mass loss contribution to the lake volume increase was nearly 19 ± 21% for the entire TP; thus, it is not possible to explain all of the lake volume gain. Similarly, another study conducted by Qiao et al. (Citation2019a) demonstrated that on average, glacier melt contribution to the lakes in central TP was approximately 22% from 2000 to 2013. Zhang et al. (Citation2017a) found that from 1970 to 2015, the relative contribution of precipitation, glacier mass loss, and permafrost degradation to the increase in the levels of the TP lakes were 74%, 13%, and 12%, respectively. The correlation between lake level and precipitation revealed that precipitation (rather than glacial melt) is the main cause of lake level changes in the TP, whereas meltwater is a substantial supplement for lakes located near glaciers (e.g. Nam Co and Selin Co lakes) (Wang et al. Citation2016).
Moreover, due to the positive water balance of Nam Co Lake, the projected lake levels exhibit an increasing trend, at a rate of 0.63, 0.70, and 0.41 m/a under RCP2.6, 4.5, and 8.5, respectively, from 2011 to 2100, with an area expansion of 778, 855, and 537 km2, and a corresponding water volume increase of 155, 179, and 94 km3, respectively, under dynamic lake area conditions. Overall, from 2011 to 2100, the lake area will expand by 38.6%, 42.4%, and 26.6% under RCP2.6, 4.5, and 8.5, respectively. Zhang et al. (2017) observed that the area of Nam Co Lake increased by approximately 4.7% from 1972 to 2015. Wu et al. (Citation2014) observed that the level of Nam Co Lake had increased at a rate of 0.20 m/a from 1980 to 2010, whereas, Li and Lin (Citation2017) found that the level of Nam Co Lake had increased at a rate of 0.40 m/a from 1999 to 2008. The in situ inter-annual Nam Co lake-level analysis revealed an increase of 0.66 m in the level from 2006 to 2014, a decrease of 0.59 m from 2014 to 2017, and a sharp increase of 0.2 m in 2018 (Zhou et al. Citation2021). Moreover, a study conducted by Zhan et al. (Citation2020) indicated a drastic change in the water level of northern TP lakes (with an average rate of 0.82 m/a), whereas the water levels of the lakes located in the eastern and central TP rose at an average rate of 0.40 m/a from 2016 to 2018.
5 Conclusions
Lakes play a notable role in sustaining the water balance of numerous large Asian river basins in the TP. In this regard, the current study explores the future water balance of Nam Co Lake under projected climate change scenarios. The major findings of this study are summarized below.
The positive water balance of Nam Co Lake from 2011 to 2100, under RCP2.6 and 4.5, implies lake expansion, while the projection of negative water balance from 2070 onward under RCP8.5 indicates lake contraction.
From 2011 to 2100, the simulated Nam Co Lake levels will increase by 0.63, 0.70, and 0.41 m/a under RCP2.6, 4.5, and 8.5, respectively, as compared to the baseline period (1981–2010).
However, it is projected that, from 2011 to 2100, the lake area will increase by 778, 855, and 537 km2, and the corresponding water volume will increase by 155 km3, 179 km3, and 94 km3 under RCP2.6, 4.5, and 8.5, respectively.
Overall, from 2011 to 2100, the lake will expand by 38.6%, 42.4%, and 26.6% under RCP2.6, 4.5, and 8.5, respectively, in terms of area.
It is projected that during 2011–2100 and under RCP8.5, 96.4% of the glacier area in the Nam Co basin will disappear, and the projected total runoff will decrease by 40.2% relative to the baseline period during 2071–2100.
Overall, we conclude that in the near future (i.e. during the period 2011–2040), accelerated glacier melting along with increasing precipitation will be the main factors responsible for the rapid growth of Nam Co Lake, whereas from 2070 onward, increased lake evaporation will tend to play an important role in controlling the rapid growth of the lake.
Notably, the current study did not consider permafrost, which is an important component of water balance, due to the lack of observed frozen soil data in the Nam Co Lake basin and the inability of the SWAT model to accommodate permafrost data. Another limitation of the study is the absence of a lake module in the SWAT model, which was resolved by calibrating the SWAT model at gauged sub-basins and then up-scaling it to the basin scale. The current work suggests that future studies should consider permafrost (along with glaciers and snowmelt) to better represent the water balance of Nam Co Lake under current and projected future climate change scenarios. Moreover, future studies should use fine-resolution regional climate model (RCM) data instead of coarse-resolution GCMs to force the hydrological model for better and credible predictions of the water balance of the lakes in the TP.
Acknowledgements
This study was supported by the Second Tibetan Plateau Scientific Expedition and Research Program (STEP) (2019QZKK0605), the National Natural Science Foundation of China (41701074, 41630754), and the State Key Laboratory of Cryospheric Science (SKLCS-ZZ-2019). We are thankful to the Nam Co Station for Multisphere Observation and Research, Institute of Tibetan Plateau, for providing us hydrometeorological data to conduct this study.
Disclosure statement
No potential conflict of interest was reported by the authors.
Additional information
Funding
References
- Adnan, M., et al., 2019b. Simulation and analysis of the water balance of the Nam Co Lake using SWAT model. Water, 11 (7), 1383. doi:https://doi.org/10.3390/w11071383
- Adnan, M., et al., 2019a. Evaluation of SWAT model performance on glaciated and non-glaciated subbasins of Nam Co Lake, Southern Tibetan Plateau, China. Journal of Mountain Science, 16 (5), 1075–1097. doi:https://doi.org/10.1007/s11629-018-5070-7
- Babur, M., et al., 2016. Assessment of climate change impact on reservoir inflows using multi climate-models under RCPs—The case of Mangla Dam in Pakistan. Water, 8 (9), 389. doi:https://doi.org/10.3390/w8090389
- Bibi, S., et al., 2018. Climatic and associated cryospheric, biospheric, and hydrological changes on the Tibetan Plateau: a review. International Journal of Climatology, 38, e1–e17. doi:https://doi.org/10.1002/joc.5411
- Biskop, S., et al., 2016. Differences in the water-balance components of four lakes in the southern-central Tibetan Plateau. Hydrology & Earth System Sciences, 20 (1), 209–225. doi:https://doi.org/10.5194/hess-20-209-2016
- Brun, F., et al., 2020. Limited contribution of glacier mass loss to the recent increase in Tibetan Plateau lake volume. Frontiers in Earth Science, 8, 495. doi:https://doi.org/10.3389/feart.2020.582060
- Dagang, Z., et al., 2004. Evolution and climatic change of Nam Co of Tibet and an ancient large lake in the northern Tibetan Plateau since the late Pleistocene. Geology in China, 31, 269.
- Dickerson-Lange, S.E. and Mitchell, R., 2014. Modeling the effects of climate change projections on streamflow in the Nooksack River basin, Northwest Washington. Hydrological Processes, 28 (20), 5236–5250. doi:https://doi.org/10.1002/hyp.10012
- Du, Y., et al., 2018. Temporal variations in the quantity of groundwater flow in Nam Co Lake. Water, 10 (7), 941. doi:https://doi.org/10.3390/w10070941
- Farinotti, D., et al., 2019. A consensus estimate for the ice thickness distribution of all glaciers on Earth. Nature Geoscience, 12 (3), 168–173. doi:https://doi.org/10.1038/s41561-019-0300-3
- Feaster, T.D., et al., 2014. Scaling up watershed model parameters—Flow and load simulations of the Edisto River Basin, South Carolina, 2007–09 (No. 2014–5104). US Geological Survey.
- Grinsted, A., 2013. An estimate of global glacier volume. The Cryosphere, 7 (1), 141. doi:https://doi.org/10.5194/tc-7-141-2013
- Guo, W., et al., 2014. The second glacier inventory dataset of China (Version 1.0). Cold and Arid Regions Science Data Center at Lanzhou.
- Han, Z. and Zhou, T., 2012. Assessing the quality of APHRODITE high-resolution daily precipitation dataset over contiguous China. Chinese Journal of Atmospheric Science, 36, 361–373.
- Hock, R., 2003. Temperature index melt modeling in mountain areas. Journal of Hydrology, 282 (1–4), 104–115. doi:https://doi.org/10.1016/S0022-1694(03)00257-9
- Hwang, C., et al., 2019. Lake level changes in the Tibetan Plateau from Cryosat-2, SARAL, ICESat, and Jason-2 altimeters. Terrestrial, Atmospheric and Oceanic Sciences, 30 (1), 1–18. doi:https://doi.org/10.3319/TAO.2019.01.22.01
- Immerzeel, W.W., Van Beek, L.P., and Bierkens, M.F., 2010. Climate change will affect the Asian water towers. Science, 328 (5984), 1382–1385. doi:https://doi.org/10.1126/science.1183188
- Jia, K., et al., 2019. Assessing the performance of CMIP5 global climate models for simulating future precipitation change in the Tibetan Plateau. Water, 11 (9), 1771. doi:https://doi.org/10.3390/w11091771
- Jiang, L.G., et al., 2017. Monitoring recent lake level variations on the Tibetan Plateau using CryoSat-2 SARIn mode data. Journal of Hydrology, 544, 109–124. doi:https://doi.org/10.1016/j.jhydrol.2016.11.024
- Kang, S., et al., 2007. Glacier retreating dramatically on the Mt. Nyainqentanglha during the last 40 years. Journal of Glaciology and Geocryology, 29, 869–873.
- Kotlarski, S., Paul, F., and Jacob, D., 2010. Forcing a distributed glacier mass balance model with the regional climate model REMO. Part I: climate model evaluation. Journal of Climate, 23 (6), 1589–1606. doi:https://doi.org/10.1175/2009JCLI2711.1
- Krause, P., et al., 2010. Hydrological system analysis and modelling of the Nam Co basin in Tibet. Advances in Geosciences, 27, 29–36. doi:https://doi.org/10.5194/adgeo-27-29-2010
- Kropáček, J., et al., 2012. Analysis of lake level changes in Nam Co in central Tibet utilizing synergistic satellite altimetry and optical imagery. International Journal of Applied Earth Observation and Geoinformation, 17, 3–11. doi:https://doi.org/10.1016/j.jag.2011.10.001
- Lee, S., et al., 2016. Arctic sea ice thickness estimation from CryoSat-2 satellite data using machine learning-based lead detection. Remote Sensing, 8 (9), 698. doi:https://doi.org/10.3390/rs8090698
- Lei, Y., et al., 2013. Coherent lake growth on the central Tibetan Plateau since the 1970s: characterization and attribution. Journal of Hydrology, 483, 61–67. doi:https://doi.org/10.1016/j.jhydrol.2013.01.003
- Li, B., et al., 2017. Climate change driven water budget dynamics of a Tibetan inland lake. Global and Planetary Change, 150, 70–80. doi:https://doi.org/10.1016/j.gloplacha.2017.02.003
- Li, G. and Lin, H., 2017. Recent decadal glacier mass balances over the Western Nyainqentanglha Mountains and the increase in their melting contribution to Nam Co Lake measured by differential bistatic SAR interferometry. Global and Planetary Change, 149, 177–190. doi:https://doi.org/10.1016/j.gloplacha.2016.12.018
- Li, H., et al., 2019a. Monitoring 40-year lake area changes of the Qaidam Basin, Tibetan Plateau, using Landsat time series. Remote Sensing, 11 (3), 343. doi:https://doi.org/10.3390/rs11030343
- Li, Y., et al., 2014b. Patterns and potential drivers of dramatic changes in Tibetan lakes, 1972–2010. PLoS One, 9 (11), e111890. doi:https://doi.org/10.1371/journal.pone.0111890
- Liu, S., et al., 1999. Mass balance sensitivity to climate change: a case study of Glacier No. 1 at Urumqi Riverhead, Tianshan Mountains, China. Chinese Geographical Science, 9 (2), 134–140. doi:https://doi.org/10.1007/BF02791363
- Loomis, B.D., et al., 2019. Water storage trends in high mountain Asia. Frontiers in Earth Science, 7, 235. doi:https://doi.org/10.3389/feart.2019.00235
- Luo, X., et al., 2020. Evaluation of corrected APHRODITE estimates for hydrological simulation in the Yarlung Tsangpo–Brahmaputra River Basin. International Journal of Climatology, 40 (9), 4158–4170. doi:https://doi.org/10.1002/joc.6449
- Ma, R., et al., 2011. China’s lakes at present: number, area and spatial distribution. Science China Earth Sciences, 54 (2), 283–289. doi:https://doi.org/10.1007/s11430-010-4052-6
- Mao, D., et al., 2018. Impacts of climate change on Tibetan lakes: patterns and processes. Remote Sensing, 10 (3), 358. doi:https://doi.org/10.3390/rs10030358
- Monteith, J.L., 1965. Evaporation and environment. In Symposia of the Society for Experimental Biology, 19, 205–234. Cambridge University Press (CUP) Cambridge.
- Neitsch, S.L., et al., 2011. Soil and water assessment tool theoretical documentation version 2009. Texas Water Resources Institute.
- Penman, H.L., 1948. Natural evaporation from open water, bare soil, and grass [J]. Proceedings of the Royal Society of London. Series A. Mathematical and Physical Sciences, 193, 120–145.
- Pepin, N., et al., 2015. Elevation-dependent warming in mountain regions of the world. Nature Climate Change, 5, 424.
- Poloczanska, E., et al., 2018, The IPCC special report on the ocean and cryosphere in a changing climate. 2018 Ocean Sciences Meeting. Portland, Oregon, USA: AGU.
- Qiao, B., et al., 2019b. Estimation of lake water storage and changes based on bathymetric data and altimetry data and the association with climate change in the central Tibetan Plateau. Journal of Hydrology, 578, 124052. doi:https://doi.org/10.1016/j.jhydrol.2019.124052
- Qiao, B., Zhu, L., and Yang, R., 2019a. Temporal-spatial differences in lake water storage changes and their links to climate change throughout the Tibetan Plateau. Remote Sensing of Environment, 222, 232–243. doi:https://doi.org/10.1016/j.rse.2018.12.037
- Ren, S., et al., 2020. Glacier mass balance in the Nyainqentanglha Mountains between 2000 and 2017 retrieved from ZiYuan-3 stereo images and the SRTM DEM. Remote Sensing, 12 (5), 864. doi:https://doi.org/10.3390/rs12050864
- Roth, V., Nigussie, T.K., and Lemann, T., 2016. Model parameter transfer for streamflow and sediment loss prediction with SWAT in a tropical watershed. Environmental Earth Sciences, 75 (19), 1–13. doi:https://doi.org/10.1007/s12665-016-6129-9
- Salunke, P., Jain, S., and Mishra, S.K., 2019. Performance of the CMIP5 models in the simulation of the Himalaya-Tibetan Plateau monsoon. Theoretical and Applied Climatology, 137 (1–2), 909–928. doi:https://doi.org/10.1007/s00704-018-2644-9
- Shean, D.E., et al., 2020. A systematic, regional assessment of high mountain Asia glacier mass balance. Frontiers in Earth Science, 7, 363. doi:https://doi.org/10.3389/feart.2019.00363
- Song, C., Huang, B., and Ke, L., 2013. Modeling and analysis of lake water storage changes on the Tibetan Plateau using multi-mission satellite data. Remote Sensing of Environment, 135, 25–35. doi:https://doi.org/10.1016/j.rse.2013.03.013
- Song, C.Q., Ye, Q.H., and Cheng, X., 2015b. Shifts in water level variation of Nam Co in the central Tibetan Plateau from ICESat and CryoSat-2 altimetry and station observation. Chinese Science Bulletin, 60, 1–11.
- Song, C.Q., et al., 2015a. Combined ICESat and CryoSat-2 altimetry for accessing water level dynamics of Tibetan Lakes over 2003–2014. Water, 7 (12), 4685–4700. doi:https://doi.org/10.3390/w7094685
- Sperna Weiland, F., et al., 2010. The ability of a GCM-forced hydrological model to reproduce global discharge variability. Hydrology and Earth System Sciences, 14 (8), 1595–1621. doi:https://doi.org/10.5194/hess-14-1595-2010
- Stahl, K., et al., 2008. Coupled modelling of glacier and streamflow response to future climate scenarios. Water Resources Research, 44 (2). doi:https://doi.org/10.1029/2007WR005956
- Su, F., et al., 2013. Evaluation of the global climate models in the CMIP5 over the Tibetan Plateau. Journal of Climate, 26 (10), 3187–3208. doi:https://doi.org/10.1175/JCLI-D-12-00321.1
- Su, F., et al., 2016. Hydrological response to future climate changes for the major upstream river basins in the Tibetan Plateau. Global and Planetary Change, 136, 82–95. doi:https://doi.org/10.1016/j.gloplacha.2015.10.012
- Tahir, A.A., et al., 2011. Modeling snowmelt-runoff under climate scenarios in the Hunza River basin, Karakoram Range, Northern Pakistan. Journal of Hydrology, 409 (1–2), 104–117. doi:https://doi.org/10.1016/j.jhydrol.2011.08.035
- Tong, K., Su, F., and Li, C., 2020. Modeling of Water Fluxes and Budget in Nam Co Basin during 1979–2013. Journal of Hydrometeorology, 21 (4), 829–844. doi:https://doi.org/10.1175/JHM-D-19-0135.1
- Wang, B., et al., 2020. Quantifying the evaporation amounts of 75 high-elevation large dimictic lakes on the Tibetan Plateau. Science Advances, 6 (26), eaay8558. doi:https://doi.org/10.1126/sciadv.aay8558
- Wang, J. and Zhu, L., 2006. Preliminary study on the field investigation of Nam Co. Annual report of Nam Co monitoring and research station for multisphere interactions. Beijing: ITPRCAS, 42.
- Wang, Q., Yi, S., and Sun, W., 2016. The changing pattern of lake and its contribution to increased mass in the Tibetan Plateau derived from GRACE and ICESat data. Geophysical Journal International, 207 (1), 528–541. doi:https://doi.org/10.1093/gji/ggw293
- Wang, X., et al., 2013. Water-level changes in China’s large lakes determined from ICESat/GLAS data. Remote Sensing of Environment, 132, 131–144. doi:https://doi.org/10.1016/j.rse.2013.01.005
- Weiland, F.S., et al., 2012. Extracting information from an ensemble of GCMs to reliably assess future global runoff change. Journal of Hydrology, 412, 66–75. doi:https://doi.org/10.1016/j.jhydrol.2011.03.047
- Wu, Y., et al., 2014. Long-term changes of lake level and water budget in the Nam Co Lake Basin, central Tibetan Plateau. Journal of Hydrometeorology, 15 (3), 1312–1322. doi:https://doi.org/10.1175/JHM-D-13-093.1
- Wu, Y. and Zhu, L., 2008. The response of lake-glacier variations to climate change in Nam Co Catchment, central Tibetan Plateau, during 1970–2000. Journal of Geographical Sciences, 18 (2), 177–189. doi:https://doi.org/10.1007/s11442-008-0177-3
- Yang, K., et al., 2018. Quantifying recent precipitation change and predicting lake expansion in the Inner Tibetan Plateau. Climatic Change, 147 (1–2), 149–163. doi:https://doi.org/10.1007/s10584-017-2127-5
- Yang, K., et al., 2014. Recent climate changes over the Tibetan Plateau and their impacts on energy and water cycle: a review. Global and Planetary Change, 112, 79–91. doi:https://doi.org/10.1016/j.gloplacha.2013.12.001
- Yao, F., et al., 2018. Lake storage variation on the endorheic Tibetan Plateau and its attribution to climate change since the new millennium. Environmental Research Letters, 13 (6), 064011. doi:https://doi.org/10.1088/1748-9326/aab5d3
- Yatagai, A., et al., 2012. APHRODITE: constructing a long-term daily gridded precipitation dataset for Asia based on a dense network of rain gauges. Bulletin of the American Meteorological Society, 93 (9), 1401–1415. doi:https://doi.org/10.1175/BAMS-D-11-00122.1
- Zaman, M., et al., 2020. Event-based time distribution patterns, return levels, and their trends of extreme precipitation across Indus Basin. Water, 12, 3373.
- Zaman, M., et al., 2018. Enumerating the effects of climate change on water resources using GCM scenarios at the Xin’anjiang watershed, China. Water, 10 (10), 1296. doi:https://doi.org/10.3390/w10101296
- Zhan, P., et al., 2020. Recent abnormal hydrologic behavior of Tibetan lakes inferred from multi-mission altimetry and its driving force analyses. Authorea Preprints.
- Zhang, B., et al., 2011. Estimation and trend detection of water storage at Nam Co Lake, central Tibetan Plateau. Journal of Hydrology, 405 (1–2), 161–170. doi:https://doi.org/10.1016/j.jhydrol.2011.05.018
- Zhang, G., et al., 2020a. Lake water and glacier mass gains in the northwestern Tibetan Plateau observed from multi-sensor remote sensing data: implication of an enhanced hydrological cycle. Remote Sensing of Environment, 237, 111554. doi:https://doi.org/10.1016/j.rse.2019.111554
- Zhang, G., et al., 2019b. A robust but variable lake expansion on the Tibetan Plateau. Science Bulletin, 64, 1306–1309.
- Zhang, G., et al., 2011b. Monitoring lake level changes on the Tibetan Plateau using ICESat altimetry data (2003−2009). Remote Sensing of Environment, 115 (7), 1733–1742. doi:https://doi.org/10.1016/j.rse.2011.03.005
- Zhang, G., et al., 2019. Regional differences of lake evolution across China during 1960s–2015 and its natural and anthropogenic causes. Remote Sensing of Environment, 221, 386–404. doi:https://doi.org/10.1016/j.rse.2018.11.038
- Zhang, G., et al., 2017a. Extensive and drastically different alpine lake changes on Asia’s high plateaus during the past four decades. Geophysical Research Letters, 44 (1), 252–260. doi:https://doi.org/10.1002/2016GL072033
- Zhang, G., et al., 2017b. Lake volume and groundwater storage variations in Tibetan Plateau’s endorheic basin. Geophysical Research Letters, 44 (11), 5550–5560. doi:https://doi.org/10.1002/2017GL073773
- Zhang, G., et al., 2014. Lakes’ state and abundance across the Tibetan Plateau. Chinese Science Bulletin, 59 (24), 3010–3021. doi:https://doi.org/10.1007/s11434-014-0258-x
- Zhang, X.-C., 2005. Spatial downscaling of global climate model output for site-specific assessment of crop production and soil erosion. Agricultural and Forest Meteorology, 135 (1–4), 215–229. doi:https://doi.org/10.1016/j.agrformet.2005.11.016
- Zhang, Y., Luo, Y., and Sun, L., 2016a. Quantifying future changes in glacier melt and river runoff in the headwaters of the Urumqi River, China. Environmental Earth Sciences, 75 (9), 770. doi:https://doi.org/10.1007/s12665-016-5563-z
- Zhang, Y., et al., 2016b. Impacts of climate change on streamflows under RCP scenarios: a case study in Xin River Basin, China. Atmospheric Research, 178, 521–534. doi:https://doi.org/10.1016/j.atmosres.2016.04.018
- Zhao, Q., et al., 2019. Projecting climate change impacts on hydrological processes on the Tibetan Plateau with model calibration against the glacier inventory data and observed streamflow. Journal of Hydrology, 573, 60–81. doi:https://doi.org/10.1016/j.jhydrol.2019.03.043
- Zhao, Q., et al., 2015. Modeling hydrologic response to climate change and shrinking glaciers in the highly glacierized Kunma Like River Catchment, Central Tian Shan. Journal of Hydrometeorology, 16 (6), 2383–2402. doi:https://doi.org/10.1175/JHM-D-14-0231.1
- Zhong, X., et al., 2020. Precipitation dominates long-term water storage changes in Nam Co Lake (Tibetan Plateau) accompanied by intensified cryosphere melts revealed by a basin-wide hydrological modelling. Remote Sensing, 12 (12), 1926. doi:https://doi.org/10.3390/rs12121926
- Zhou, S., 2021. A note on the lake level variations of Nam Co, south-central Tibetan Plateau from 2005 to 2019. Sciences in Cold and Arid Regions, 12, 430–435.
- Zhou, S., et al., 2013. Water balance observations reveal significant subsurface water seepage from Lake Nam Co, south-central Tibetan Plateau. Journal of Hydrology, 491, 89–99. doi:https://doi.org/10.1016/j.jhydrol.2013.03.030
- Zhu, L., Xie, M., and Wu, Y., 2010. Quantitative analysis of lake area variations and the influence factors from 1971 to 2004 in the Nam Co basin of the Tibetan Plateau. Chinese Science Bulletin, 55 (13), 1294–1303. doi:https://doi.org/10.1007/s11434-010-0015-8
- Zou, F., Tenzer, R., and Jin, S., 2019. Water storage variations in Tibet from GRACE, ICESat, and hydrological data. Remote Sensing, 11 (9), 1103. doi:https://doi.org/10.3390/rs11091103
Appendix
Table A1. List of parameters used for calibration and validation of the SWAT model at sub-basin and basin scales
Figure A1. Comparison between observed and reconstructed data at four meteorological stations, 2007–2013
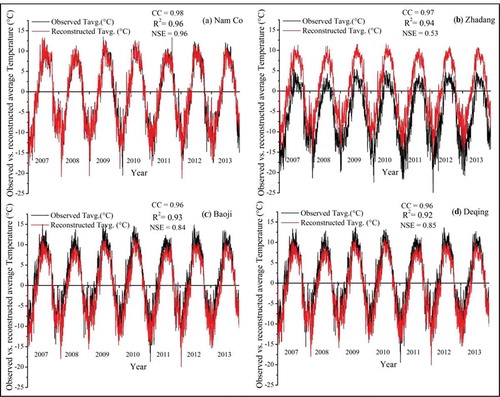
Figure A2. Comparison between observed and Aphrodite precipitation data at four meteorological stations, 2007–2013
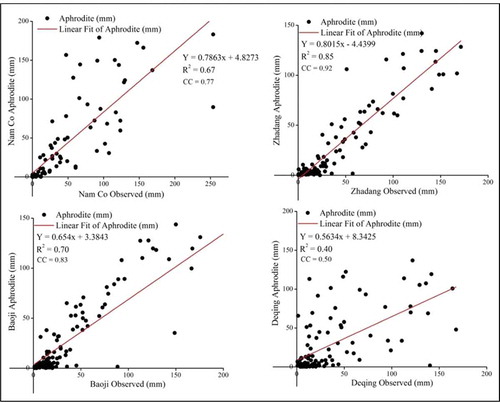
Figure A3. Comparison between observed (NAMOR MS) and GCM bias-corrected ensemble mean data, 2007–2013
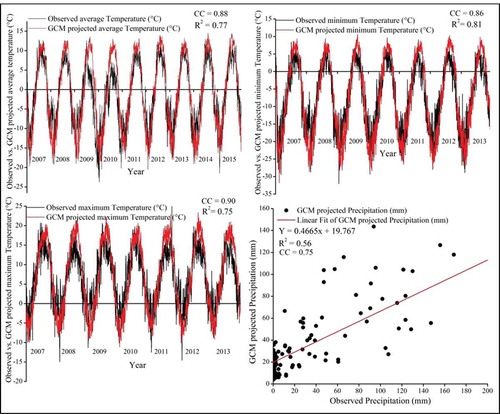
Figure A4. Projected future trends of annual air temperature in the Nam Co Lake basin under representative concentration pathways (RCPs)
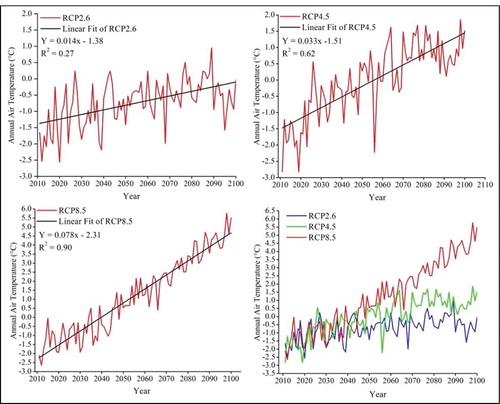
Figure A5. Projected future trends of annual precipitation in the Nam Co Lake basin under representative concentration pathways (RCPs)
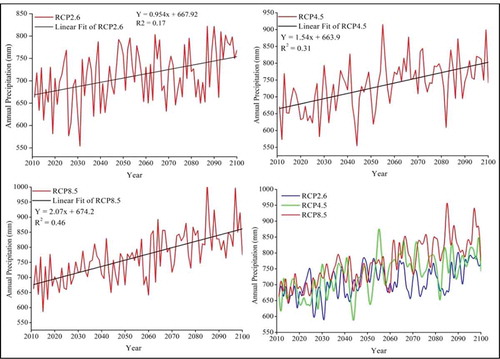
Figure A6. Decadal changes of annual and seasonal temperatures per period under representative concentration pathways (RCPs) 2.6, 4.5 and 8.5
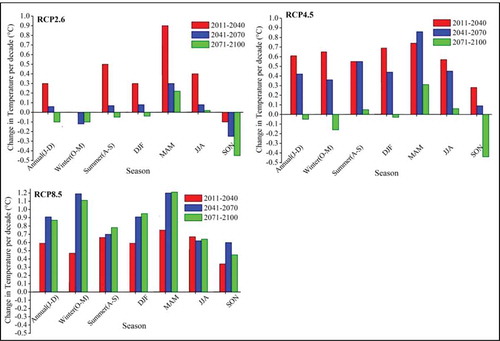
Figure A7. Decadal changes of annual and seasonal precipitation per period under representative concentration pathways (RCPs) 2.6, 4.5 and 8.5. J–D, January to December; O–M, October to March; A–S, April to September; DJF, December to February; MAM, March to May; JJA, June to August; SON, September to November
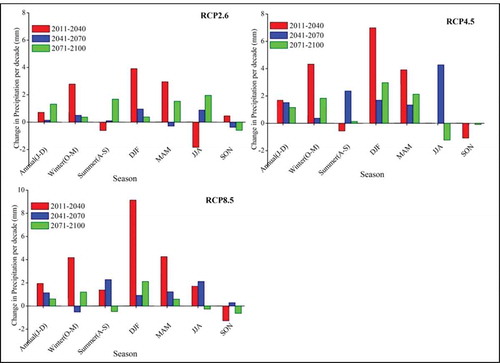
Figure A8. Projected future trends of simulated Nam Co Lake evaporation under representative concentration pathways (RCPs)